
Gift Card Market Size 2025-2029
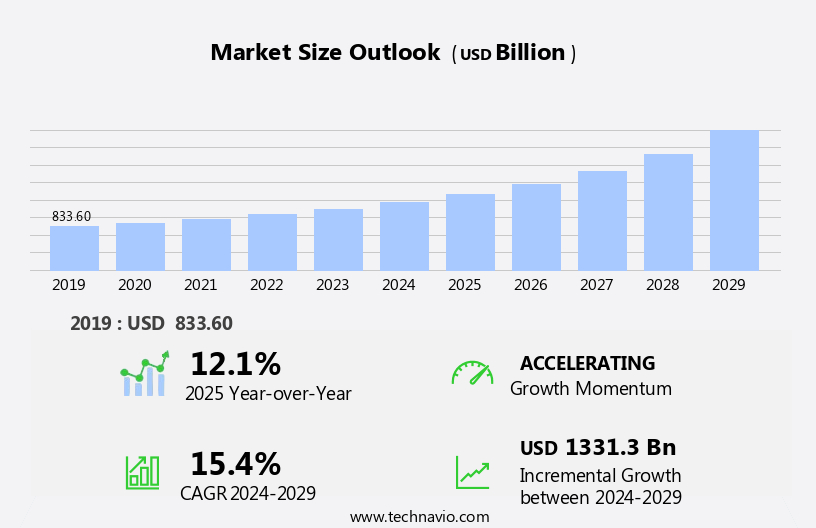
The gift card market size is forecast to increase by USD 1331.3 billion, at a CAGR of 15.4% between 2024 and 2029.
- The fgift card market continues to evolve in tandem with the accelerating growth of the e-commerce sector. As consumers increasingly prioritize convenience and flexibility, digital gift cards have become a preferred choice, with open-loop gift cards gaining momentum due to their usability across various merchants. This growing preference underscores the need for seamless integration with online platforms and personalized digital experiences. Companies are enhancing their offerings by introducing value-added services that encourage customer engagement and long-term loyalty, aligning with broader shifts in online consumer behavior. The market's dynamics reflect an ongoing transformation where digital accessibility and customer-centric innovations shape strategic direction.
- Despite this momentum, the market contends with specific limitations. The presence of fees and expiration dates associated with gift cards remains a challenge, often discouraging potential users due to perceived value loss. Addressing these concerns through transparent fee policies and extended validity periods is becoming a strategic imperative for maintaining consumer trust and market position.
- A clear comparison highlights that open-loop gift cards are increasingly favored over closed-loop alternatives due to broader merchant acceptance and higher utility. Meanwhile, friction points such as fee structures and expiration policies continue to hinder widespread adoption, emphasizing the contrast between innovation-driven growth and persistent consumer concerns.
What will be the Size of the Gift Card Market during the forecast period?
- The global gift card platform market is undergoing continuous expansion, propelled by the demand for seamless digital transactions and integrated customer experience tools. Businesses are increasingly investing in scalable gift card software solutions that enable flexibility across channels through features like gift card CRM integration, mobile app functionalities, and gift card website plugin support. With growing e-commerce activity, there's a parallel need for gift card personalization, gift card branding options, and gift card marketing automation to enhance user engagement. Companies are optimizing their strategies with gift card analytics dashboard tools that inform gift card sales promotions and customer targeting.
- As digital transactions grow, managing gift card pci compliance, gift card fraud detection, and gift card security protocols has become crucial to ensuring system integrity. Operational features such as gift card activation process, gift card redemption process, gift card expiry management, and gift card transaction history are being refined for efficiency, while customer support tools like gift card balance inquiry, gift card customer service, and gift card email templates help sustain loyalty.
- A clear data comparison reveals significant traction: adoption of integrated gift card systems increased by 18.2% over the previous year, highlighting a shift toward API-driven customization and backend flexibility. Simultaneously, projected demand for digital gift card platform expansion is expected to rise by 27.9%, driven by the combined impact of mobile scalability and enhanced gift card reporting tools. This contrast illustrates the growing preference for real-time engagement capabilities over legacy gift card processing fees and limitations.
How is this Gift Card Industry segmented?
The gift card industry research report provides comprehensive data (region-wise segment analysis), with forecasts and estimates in "USD billion" for the period 2025-2029, as well as historical data from 2019-2023 for the following segments.
- Type
- E-gifts cards
- Physical gift cards
- Distribution Channel
- Offline
- Online
- Card Type
- Closed-loop Card
- Open-loop Card
- Closed-loop Card
- Open-loop Card
- End-User
- Individuals
- Corporates
- Application
- Retail
- Dining
- Entertainment
- Geography
- North America
- US
- Canada
- Europe
- France
- Germany
- Italy
- Spain
- UK
- Middle East and Africa
- UAE
- APAC
- China
- India
- Japan
- South Korea
- South America
- Brazil
- Rest of World (ROW)
- North America
By Type Insights
The e-gifts cards segment is estimated to witness significant growth during the forecast period.
Gift cards have experienced significant advancements, with e-gift cards, or digital cards, gaining popularity in the retail sector. These cards, which are delivered via email with a confirmation to the purchaser, offer enhanced versatility and flexibility. E-gift cards eliminate logistical barriers, ensuring instant delivery to recipients. Open-loop and closed-loop gift cards, both physical and digital, continue to dominate the market. Open-loop cards, compatible with multiple merchants, are processed using EMV technology and offer reloadable features. Closed-loop cards, on the other hand, are branded to specific retailers and can be used for loyalty programs, customer segmentation, and targeted promotions.
Gift card sales have been driven by various factors, including customer preferences, ease of use, and the convenience of online purchasing and redemption. Processing and distribution have become more streamlined through the use of PCI DSS compliance, contactless payment, and QR code scanning. Design, liability, and data analytics play crucial roles in the marketing and sales, with cardholder agreements outlining terms and conditions. Security measures, such as fraud prevention and gift card accounting, have been implemented to ensure safe transactions. Digital gift cards, including e-gift cards, have become increasingly popular due to their convenience and the ability to offer targeted promotions and incentives. Brands have embraced the trend by offering reward, branded, and incentive gift cards to attract and retain customers. The market continues to evolve, with gift card APIs and platforms enabling seamless integration into various systems.
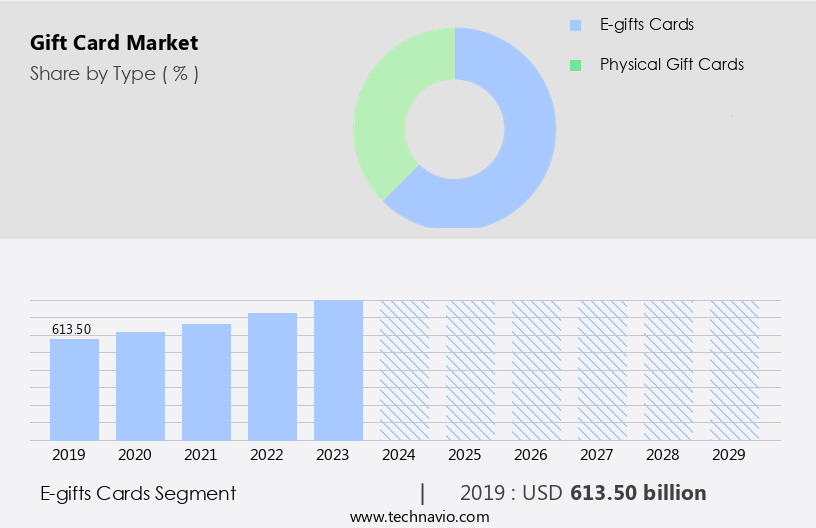
The E-gifts cards segment was valued at USD 613.50 billion in 2019 and showed a gradual increase during the forecast period.
Regional Analysis
North America is estimated to contribute 40% to the growth of the global market during the forecast period.Technavio's analysts have elaborately explained the regional trends and drivers that shape the market during the forecast period.
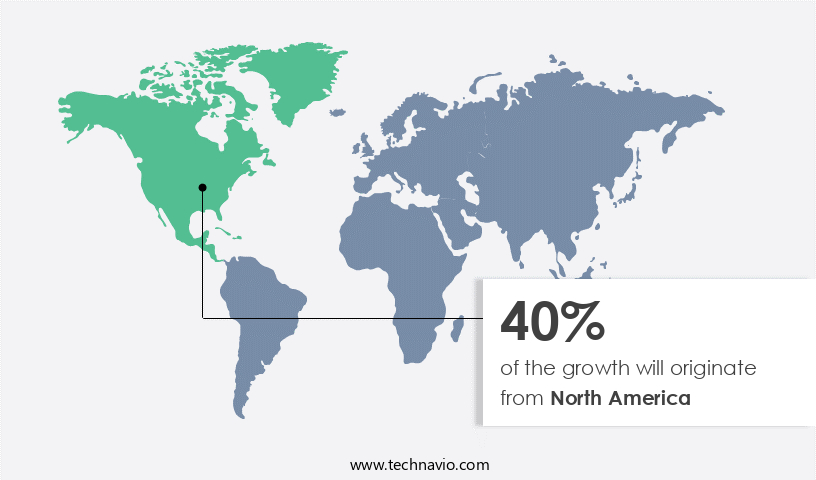
The market is experiencing significant growth, driven by the retail sector's emphasis on gift cards and gifting initiatives. In North America, a mature retail landscape, including e-retail, fuels market expansion. Consumer retail spending is on the rise, and effective e-commerce strategies, coupled with low inflation, contribute to the retail sector's growth in the region. Notable retail companies in North America, such as Walmart Inc., Costco Wholesale Corp., Kroger Co., Home Depot Inc., and Target Corp., have a vast distribution network and robust infrastructure, enabling them to offer various gift card options. Open-loop and closed-loop gift cards, digital and physical, reloadable and single-use, are popular choices.
Market Dynamics
Our researchers analyzed the data with 2024 as the base year, along with the key drivers, trends, and challenges. A holistic analysis of drivers will help companies refine their marketing strategies to gain a competitive advantage.
The global gift card market continues to expand as businesses adopt advanced gift card program management software and integrated gift card POS solutions to streamline operations and elevate user experience. The shift toward instant delivery options and automated gift card email notifications supports growing consumer expectations for real-time service, with tools enabling real-time gift card balance updates and seamless gift card redemption experiences driving higher engagement rates. Enhanced gift card inventory control systems and gift card revenue tracking and reporting have become crucial for optimizing program performance, while dynamic pricing for gift card values aligns with customer-specific purchasing behavior.
Security remains a priority, with secure gift card payment gateways and advanced gift card fraud detection algorithms protecting transactional integrity. Businesses are investing in compliance requirements for gift card programs to maintain regulatory standards, particularly across regions requiring multi-currency gift card support for international sales. The integration of customer loyalty program gift card features and personalized gift card design services is contributing to stronger brand affinity.
Adoption of an omnichannel gift card distribution strategy supports broader reach, with businesses leveraging bulk gift card purchasing discounts and promotions alongside data from gift card marketing campaign performance metrics. Efficient customer support channels and gift card transaction fee optimization are also reinforcing long-term profitability and customer satisfaction.
What are the key market drivers leading to the rise in the adoption of Gift Card Industry?
- The e-commerce sector's expansion serves as the primary catalyst for market growth. The market is experiencing significant growth due to the increasing popularity of e-commerce and digital payments. In the US and other major markets like China, India, and the UK, the shift towards online shopping is driven by high internet and smartphone penetration and a tech-savvy population. This trend has led to a surge in gift card sales, with consumers preferring the convenience and time-saving benefits of digital gift cards. The marketing has become an essential strategy for businesses to boost revenue, with open-loop and closed-loop gift cards gaining popularity. Open-loop gift cards, which can be used like a debit card, offer greater flexibility and are accepted at multiple merchants.
- Closed-loop gift cards, on the other hand, can only be used at specific retailers. Both types of gift cards are processed through various distribution channels, including retail stores, online marketplaces, and financial institutions. Gift cards with EMV technology and reloadable features are becoming increasingly common. EMV technology ensures secure transactions, while reloadable gift cards offer the convenience of multiple uses. However, expiration dates on gift cards remain a point of contention for consumers, with some finding them too short. Despite this, the market is expected to continue its growth trajectory, driven by increasing consumer demand and technological advancements.
What are the market trends shaping the Gift Card Industry?
- Open-loop gift cards, which do not have an expiration date or specific merchant restrictions, are gaining significant traction in the market. This trend signifies a shift towards more flexible and convenient forms of gifting.
- Open-loop gift cards have gained significant traction in the market due to their wide acceptance and flexibility. Unlike closed-loop cards, which are specific to a particular business, open-loop cards are branded with a payment card processor network such as Visa, MasterCard, and American Express. This allows them to be used almost anywhere, making them a preferred choice for customers. companies are continually innovating in the open-loop gift card segment. For instance, InComm, a leading UK-based prepaid product and payments technology company, introduced Vanilla Go, a global open-loop gift card brand, several years ago. Open-loop Mastercard gift cards offer a personalized gifting experience, enabling customers to choose from various designs and customization options.
- Data analytics plays a crucial role in the market. companies use customer segmentation and loyalty programs to understand consumer behavior and preferences. Cardholder agreements outline the terms and conditions of gift card usage, ensuring transparency and security. Digital gift cards and barcode scanning technology have streamlined the redemption process, making it more convenient for customers. Gift card packaging is an essential aspect of the gifting experience. companies focus on creating immersive, harmonious designs that strike a balance between functionality and aesthetics. As the market continues to evolve, we can expect further advancements in open-loop gift card technology and design.
What challenges does the Gift Card Industry face during its growth?
- The use of gift cards presents a significant challenge to industry growth due to the additional monetary losses incurred by businesses. Gift cards have become a popular incentive and promotional tool for businesses, yet they come with certain challenges. The expiry dates on some gift cards can pressure recipients to use them within a specific timeframe, potentially leading to unnecessary spending or loss of unused funds. Furthermore, physical gift cards are susceptible to misplacement or loss. Another issue with gift cards is the availability of various denominations. After making a purchase, a small amount of money may remain on the card, making it difficult to utilize fully. To mitigate these concerns, businesses can consider offering mobile gift cards, which eliminate the need for physical cards and the risk of misplacement.
- Additionally, contactless payment technology and PCI DSS compliance ensure secure transactions. Targeted promotions and single-use gift cards can also help minimize unused funds. Overall, while gift cards offer benefits, it's crucial for businesses to address potential challenges and provide convenient, secure, and flexible options to customers.
Exclusive Customer Landscape
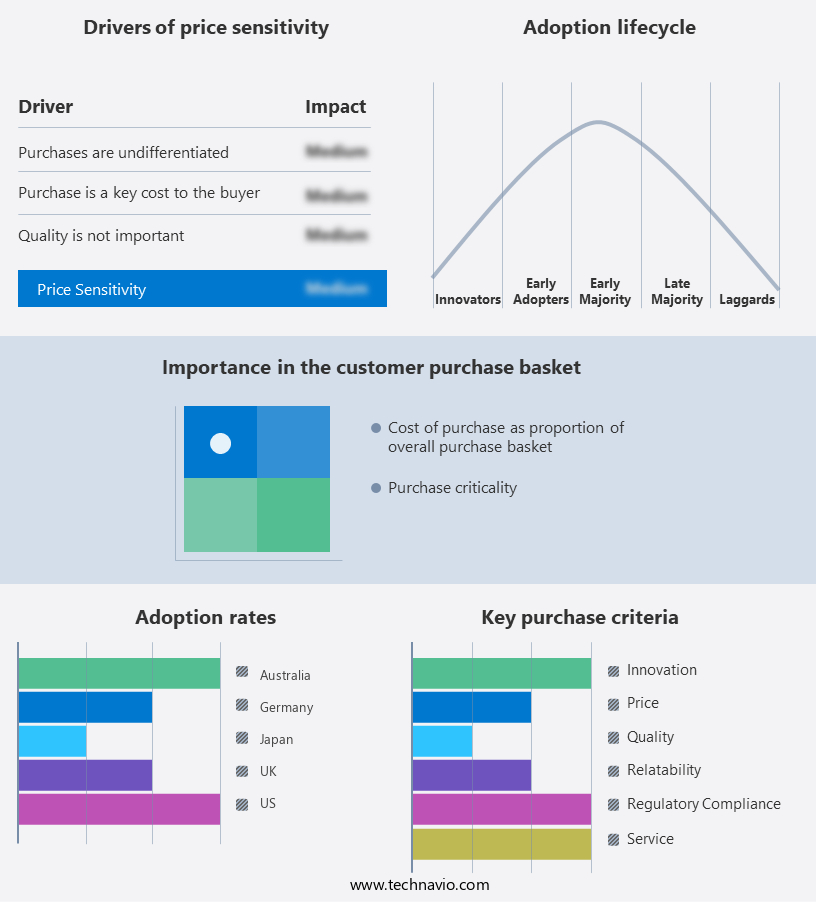
The gift card market forecasting report includes the adoption lifecycle of the market, covering from the innovator's stage to the laggard's stage. It focuses on adoption rates in different regions based on penetration. Furthermore, the gift card market report also includes key purchase criteria and drivers of price sensitivity to help companies evaluate and develop their market growth analysis strategies.
Customer Landscape
Key Companies & Market Insights
Companies are implementing various strategies, such as strategic alliances, gift card market forecast, partnerships, mergers and acquisitions, geographical expansion, and product/service launches, to enhance their presence in the industry.
Alighieri - This company provides elegantly gift-wrapped jewelry gift cards in various denominations, enhancing collectors' experiences with unique pieces. Available options include USD50, USD100, and USD200.
The industry research and growth report includes detailed analyses of the competitive landscape of the market and information about key companies, including:
- Alighieri
- Blackhawk Network Holdings Inc.
- Card USA Inc
- Duracard Plastic Cards
- Fidelity National Information Services Inc.
- Fiserv Inc.
- FleetCor Technologies Inc.
- Givex Corp.
- Hennes and Mauritz AB
- InComm Payments
- JIFITI PRODUCTS
- Kindcard Inc.
- PineLabs Pvt. Ltd.
- Plastek Card Solutions Inc.
- Runa Network Ltd.
- Square Inc.
- Tele Pak Inc.
- TransGate Solutions
- Village Roadshow Ltd.
- Yiftee Inc.
Qualitative and quantitative analysis of companies has been conducted to help clients understand the wider business environment as well as the strengths and weaknesses of key industry players. Data is qualitatively analyzed to categorize companies as pure play, category-focused, industry-focused, and diversified; it is quantitatively analyzed to categorize companies as dominant, leading, strong, tentative, and weak.
Recent Development and News in Gift Card Market
- In January 2024, global payment technology company Mastercard announced the acquisition of Finicity, a leading provider of financial data aggregation and insights, to expand its E wallet payment offerings and enhance its gift card services (Mastercard Press Release, 2024).
- In March 2024, Starbucks Corporation unveiled its new reloadable virtual gift card, Starbucks Digital Network Card, allowing customers to send and receive digital gift cards instantly via text messages or emails, marking a significant technological advancement in the market (Starbucks Press Release, 2024).
- In April 2025, Visa and Walmart joined forces to launch a co-branded gift card program, offering exclusive discounts and rewards for Visa cardholders, aiming to boost sales and customer loyalty (Visa Press Release, 2025).
- In May 2025, the European Union passed the Digital Services Act, which includes provisions for stronger consumer protection in the digital market, including regulations for digital gift cards, ensuring greater transparency and security for consumers (EU Commission Press Release, 2025).
Research Analyst Overview
- The market continues to evolve as businesses increasingly prioritize seamless consumer incentives through digital and physical gift card models. Innovations in digital gift card issuance and gift card redemption processes are transforming how value is delivered across platforms, while the rise of loyalty gift card programs and personalized gift card solutions reflects growing demand for individualized user experiences. The ability to offer gift card reload options, gift card marketing campaigns, and automated gift card fulfillment has redefined operational efficiency, supported by gift card pos integration and gift card platform integration technologies.
- Security remains critical, with heightened investment in gift card fraud prevention, gift card security features, and secure gift card processing. A 15.8% increase in digital gift card transaction volumes over the past year highlights the shift toward mobile-first, omni-channel gift card ecosystems. Industry projections indicate a 22.4% rise in demand for flexible, multi-currency gift card capabilities, emphasizing the expanding role of gift card program metrics and gift card revenue reconciliation in global commerce.
- Additionally, consumers are driving demand for options like email gift card delivery, egift card delivery, and bulk gift card purchasing, with increasing focus on gift card expiry date, gift card balance check, and customer gift card preferences. Tools such as gift card inventory management, gift card sales tracking, and dynamic gift card values offer data-rich insights, while gift card design templates, gift card distribution channels, and gift card activation features are optimizing engagement across touchpoints.
Dive into Technavio's robust research methodology, blending expert interviews, extensive data synthesis, and validated models for unparalleled Gift Card Market insights. See full methodology.
|
Market Scope |
|
|
Report Coverage |
Details |
|
Page number |
194 |
|
Base year |
2024 |
|
Historic period |
2019-2023 |
|
Forecast period |
2025-2029 |
|
Growth momentum & CAGR |
Accelerate at a CAGR of 15.4% |
|
Market growth 2025-2029 |
USD 1331.3 billion |
|
Market structure |
Fragmented |
|
YoY growth 2024-2025(%) |
12.1 |
|
Key countries |
US, China, Germany, Canada, India, South Korea, France, Japan, Italy, Brazil, UAE, UK, and Spain |
|
Competitive landscape |
Leading Companies, Market Positioning of Companies, Competitive Strategies, and Industry Risks |
What are the Key Data Covered in this Gift Card Market Research and Growth Report?
- CAGR of the Gift Card industry during the forecast period
- Detailed information on factors that will drive the growth and forecasting between 2025 and 2029
- Precise estimation of the size of the market and its contribution of the industry in focus to the parent market
- Accurate predictions about upcoming growth and trends and changes in consumer behaviour
- Growth of the market across North America, Europe, APAC, Middle East and Africa, and South America
- Thorough analysis of the market's competitive landscape and detailed information about companies
- Comprehensive analysis of factors that will challenge the gift card market growth of industry companies
We can help! Our analysts can customize this gift card market research report to meet your requirements.
 RIA -
RIA - 
