GIS Market Analysis North America, Europe, APAC, South America, Middle East and Africa - US, China, Germany, UK, Canada, Brazil, Japan, France, South Korea, UAE - Size and Forecast 2025-2029

GIS Market Analysis North America, Europe, APAC, South America, Middle East and Africa - US, China, Germany, UK, Canada, Brazil, Japan, France, South Korea, UAE - Size and Forecast 2025-2029

Published: Feb 2025 218 Pages SKU: IRTNTR45957

Market Overview at a Glance

$24.07 B
Market Opportunity
20.3%
CAGR
17.2
YoY growth 2024-2025(%)

GIS Market Size 2025-2029

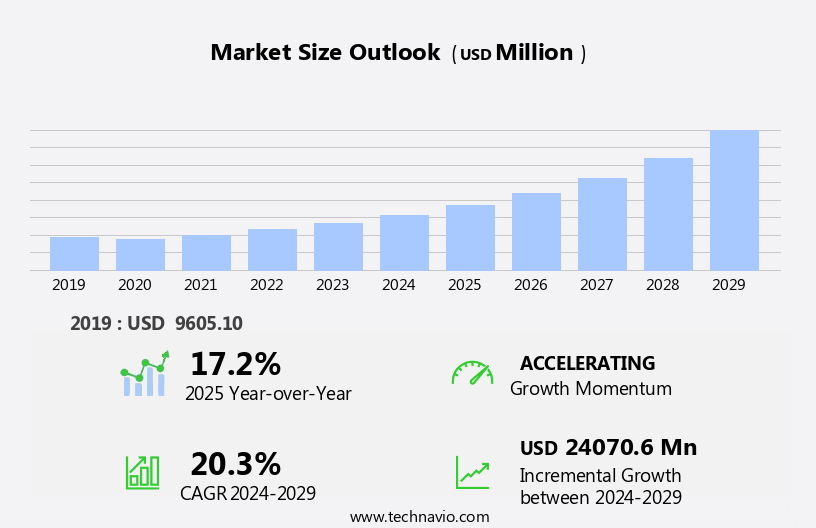
The GIS market size is forecast to increase by USD 24.07 billion, at a CAGR of 20.3% between 2024 and 2029.

  • The Global Geographic Information System (GIS) market is experiencing significant growth, driven by the increasing integration of Building Information Modeling (BIM) and GIS technologies. This convergence enables more effective spatial analysis and decision-making in various industries, particularly in soil and water management. However, the market faces challenges, including the lack of comprehensive planning and preparation leading to implementation failures of GIS solutions. Companies must address these challenges by investing in thorough project planning and collaboration between GIS and BIM teams to ensure successful implementation and maximize the potential benefits of these advanced technologies.
  • By focusing on strategic planning and effective implementation, organizations can capitalize on the opportunities presented by the growing adoption of GIS and BIM technologies, ultimately driving operational efficiency and innovation.

What will be the Size of the GIS Market during the forecast period?

GIS Market Size

Explore in-depth regional segment analysis with market size data - historical 2019-2023 and forecasts 2025-2029 - in the full report.  
Request Free Sample

The global Geographic Information Systems (GIS) market continues to evolve, driven by the increasing demand for advanced spatial data analysis and management solutions. GIS technology is finding applications across various sectors, including natural resource management, urban planning, and infrastructure management. The integration of Bing Maps, terrain analysis, vector data, Lidar data, and Geographic Information Systems enables precise spatial data analysis and modeling. Hydrological modeling, spatial statistics, spatial indexing, and route optimization are essential components of GIS, providing valuable insights for sectors such as public safety, transportation planning, and precision agriculture. Location-based services and data visualization further enhance the utility of GIS, enabling real-time mapping and spatial analysis.

The ongoing development of OGC standards, spatial data infrastructure, and mapping APIs continues to expand the capabilities of GIS, making it an indispensable tool for managing and analyzing geospatial data. The continuous unfolding of market activities and evolving patterns in the market reflect the dynamic nature of this technology and its applications.

How is this GIS Industry segmented?

The GIS industry research report provides comprehensive data (region-wise segment analysis), with forecasts and estimates in "USD million" for the period 2025-2029, as well as historical data from 2019-2023 for the following segments.

  • Product
    • Software
    • Data
    • Services
  • Type
    • Telematics and navigation
    • Mapping
    • Surveying
    • Location-based services
  • Device
    • Desktop
    • Mobile
  • Geography
    • North America
      • US
      • Canada
    • Europe
      • France
      • Germany
      • UK
    • Middle East and Africa
      • UAE
    • APAC
      • China
      • Japan
      • South Korea
    • South America
      • Brazil
    • Rest of World (ROW)

By Product Insights

The software segment is estimated to witness significant growth during the forecast period.

The Global Geographic Information System (GIS) market encompasses a range of applications and technologies, including raster data, urban planning, geospatial data, geocoding APIs, GIS services, routing APIs, aerial photography, satellite imagery, GIS software, geospatial analytics, public safety, field data collection, transportation planning, precision agriculture, OGC standards, location intelligence, remote sensing, asset management, network analysis, spatial analysis, infrastructure management, spatial data standards, disaster management, environmental monitoring, spatial modeling, coordinate systems, spatial overlay, real-time mapping, mapping APIs, spatial join, mapping applications, smart cities, spatial data infrastructure, map projections, spatial databases, natural resource management, Bing Maps, terrain analysis, vector data, Lidar data, and geographic information systems.

The software segment includes desktop, mobile, cloud, and server solutions. Open-source GIS software, with its industry-specific offerings, poses a challenge to the market, while the adoption of cloud-based GIS software represents an emerging trend. However, the lack of standardization and interoperability issues hinder the widespread adoption of cloud-based solutions. Applications in sectors like public safety, transportation planning, and precision agriculture are driving market growth. Additionally, advancements in technologies like remote sensing, spatial modeling, and real-time mapping are expanding the market's scope.

GIS Market Size

Request Free Sample

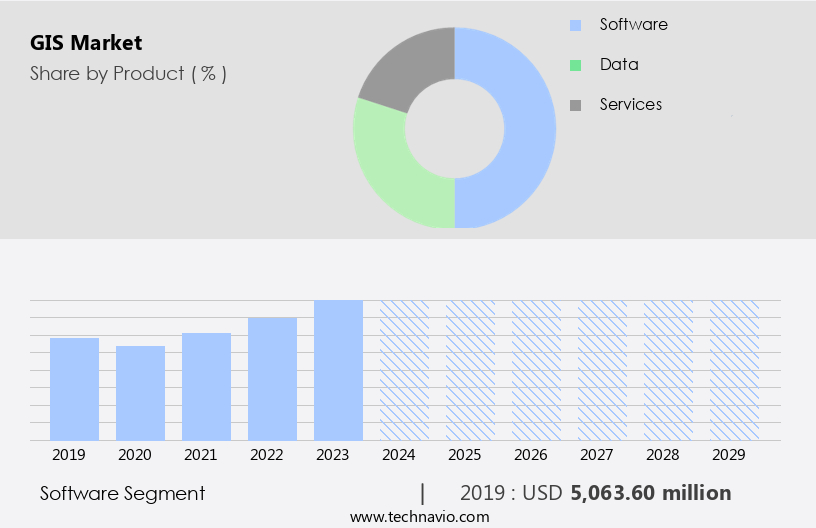
The Software segment was valued at USD 5.06 billion in 2019 and showed a gradual increase during the forecast period.

Regional Analysis

North America is estimated to contribute 38% to the growth of the global market during the forecast period. Technavio's analysts have elaborately explained the regional trends and drivers that shape the market during the forecast period.

GIS Market Share by Geography

 Request Free Sample

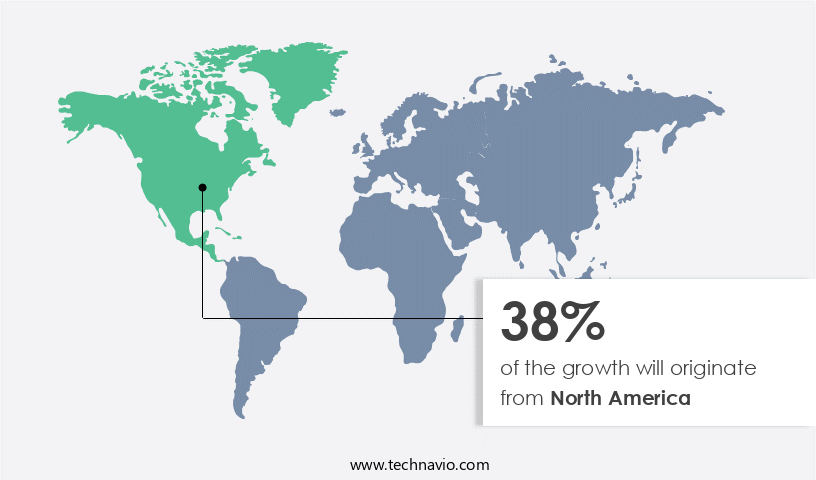
In the dynamic and technologically advanced North American market, Geographic Information Systems (GIS) solutions have gained significant traction. Google Maps, a leading location-based platform, integrates various GIS functionalities such as geocoding APIs, routing APIs, and real-time mapping. Raster data, satellite imagery, and aerial photography are crucial components of GIS, enabling applications in urban planning, precision agriculture, and disaster management. ESRI, a prominent player in the US, offers comprehensive GIS software and services, including geospatial analytics, spatial data infrastructure, and network analysis. The Canadian market is also experiencing rapid growth, driven by the adoption of GIS in sectors like government, utilities, and telecommunications.

The region's industrially developed and technologically mature sectors foster a fertile ground for GIS innovation. Key applications include asset management, infrastructure management, and spatial modeling. OGC standards, spatial indexing, and spatial data infrastructure facilitate seamless data exchange and integration. Public safety, transportation planning, and land use planning are other sectors benefiting from GIS. Remote sensing, hydrological modeling, and spatial statistics offer valuable insights for environmental monitoring and natural resource management. Bing Maps and other competitors contribute to the market's competitive landscape. The integration of location-based services, data visualization, and mapping applications further enhances the value proposition of GIS. Overall, the North American market is characterized by continuous innovation and expanding applications.

Market Dynamics

Our researchers analyzed the data with 2024 as the base year, along with the key drivers, trends, and challenges. A holistic analysis of drivers will help companies refine their marketing strategies to gain a competitive advantage.

What are the key market drivers leading to the rise in the adoption of GIS Industry?

  • The integration of Building Information Modeling (BIM) and Geographic Information Systems (GIS) is a significant market trend, driving innovation and efficiency in the construction industry by enabling seamless data exchange and analysis between architectural designs and geographic locations. 
  • The market is experiencing significant growth due to the increasing adoption of Geographic Information Systems (GIS) in various industries. One of the key drivers is the integration of GIS with Building Information Modeling (BIM). At the primary level, GIS and BIM software work together to organize and standardize 2D and 3D design data. For instance, ESRI's ArcGIS for AutoCAD allows the input of GIS data into AutoCAD software. At the secondary level, GIS adds value to BIM by visualizing and analyzing data related to buildings and their surrounding features, such as environmental and demographic information. Moreover, GIS plays a crucial role in field data collection, transportation planning, precision agriculture, infrastructure management, disaster management, network analysis, and spatial analysis.
  • OGC standards ensure interoperability between different GIS systems, enabling seamless data sharing and collaboration. Remote sensing technology enhances the capabilities of GIS by providing accurate and timely information from satellite and airborne sensors. Location intelligence is another area where GIS excels, providing insights into customer behavior, market trends, and operational efficiency. Asset management and infrastructure management also benefit from GIS by enabling real-time monitoring, maintenance scheduling, and performance analysis. In conclusion, the market is poised for continued growth, driven by its ability to provide valuable insights through spatial data analysis and visualization. Recent research emphasizes the importance of GIS in various industries, including transportation, agriculture, and infrastructure management.

What are the market trends shaping the GIS Industry?

  • The use of Geographic Information Systems (GIS) for soil and water management is becoming increasingly prevalent in the current market. This trend signifies a significant shift towards advanced technologies in addressing environmental concerns.
  • GIS (Geographic Information Systems) solutions play a crucial role in environmental monitoring and management, particularly in the area of water resource management. These systems enable the creation of spatial models, coordinate systems, and spatial overlays for mapping water resources, facilitating agricultural and conservation purposes. For instance, the Kerala Water Authority in India implemented a GIS project in 2015 to manage water loss. Big Raster and IBM's GIS analytic tools were employed for monitoring water loss, aiming for a 100% success rate in equitable water supply during the forecast period.
  • IBM's big data and analytics wing is also planning to develop GIS solutions for managing water supply in India. Spatial join, mapping APIs, mapping applications, and real-time mapping are integral components of these GIS solutions, contributing to the development of smart cities and spatial data infrastructures. Map projections and spatial databases are essential for accurate and efficient spatial data management.

What challenges does the GIS Industry face during its growth?

  • The absence of proper planning is a significant challenge that can result in the failure of GIS solution implementations, thereby impeding the growth of the industry. 
  • Geographic Information Systems (GIS) have become essential tools for businesses managing natural resources. GIS enables terrain analysis through vector and Lidar data, offering insights for hydrological modeling and spatial statistics. Spatial indexing and route optimization are crucial for location-based services, while data visualization enhances decision-making. Bing Maps and other GIS platforms facilitate these functions, making it easier for businesses to manage and analyze geographic data. However, the successful implementation of a GIS system necessitates proper planning to avoid mismatches between the system's capabilities and the end-user's requirements.
  • In industries like disaster management, precise and updated data is vital for accurate analysis. The importance of thorough planning and testing before implementing a GIS system the system's effectiveness and efficiency in meeting the organization's needs.

Exclusive Customer Landscape

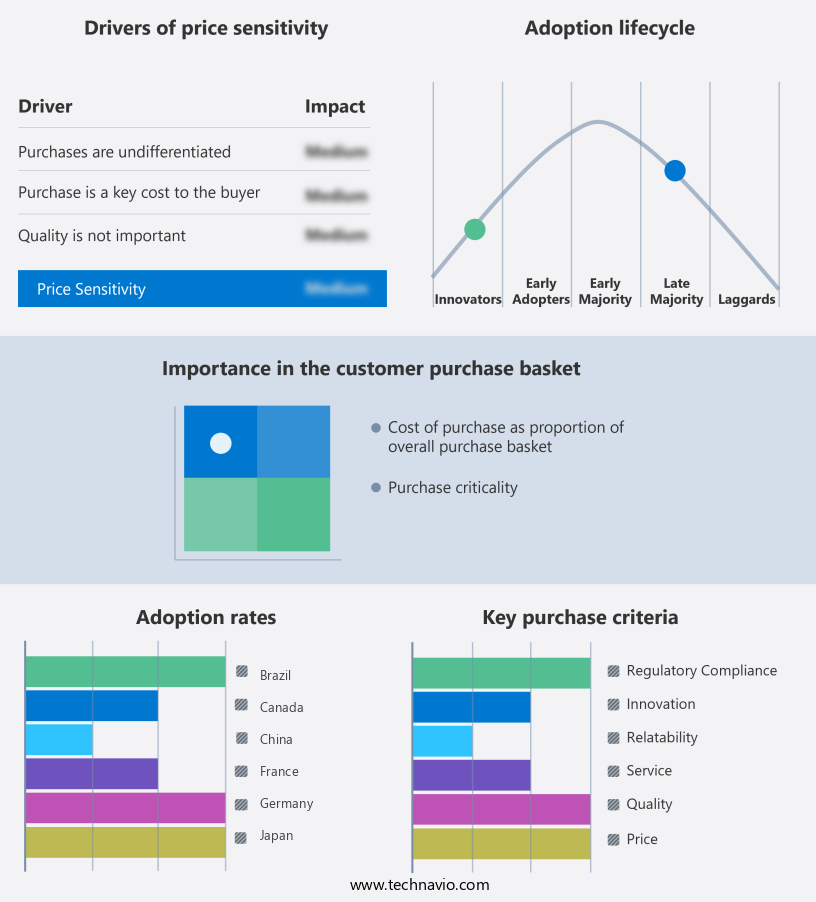
The GIS market forecasting report includes the adoption lifecycle of the market, covering from the innovator's stage to the laggard's stage. It focuses on adoption rates in different regions based on penetration. Furthermore, the GIS market report also includes key purchase criteria and drivers of price sensitivity to help companies evaluate and develop their market growth analysis strategies.

GIS Market Share by Geography

 Customer Landscape

Key Companies & Market Insights

Companies are implementing various strategies, such as strategic alliances, gis market forecast, partnerships, mergers and acquisitions, geographical expansion, and product/service launches, to enhance their presence in the industry.

AmigoCloud Inc. - This company specializes in Geographic Information Systems (GIS), providing expert analysis and mapping services, data collection, and efficient data management solutions. 

The industry research and growth report includes detailed analyses of the competitive landscape of the market and information about key companies, including:

  • AmigoCloud Inc.
  • Autodesk Inc.
  • Bentley Systems Inc.
  • Caliper Corp.
  • Cadcorp Ltd.
  • Esri Global Inc.
  • General Electric Co.
  • Google LLC
  • Hexagon AB
  • Hi Target
  • Mapbox Inc.
  • Maxar Technologies Inc.
  • Pitney Bowes Inc.
  • Rolta India Ltd.
  • Scanpoint Geomatics Ltd.
  • Takor Group Ltd.
  • TomTom NV
  • Topcon Corp.
  • Trimble Inc.
  • UrtheCast Corp.

Qualitative and quantitative analysis of companies has been conducted to help clients understand the wider business environment as well as the strengths and weaknesses of key industry players. Data is qualitatively analyzed to categorize companies as pure play, category-focused, industry-focused, and diversified; it is quantitatively analyzed to categorize companies as dominant, leading, strong, tentative, and weak.

Recent Development and News in GIS Market

  • In January 2024, Esri, a leading GIS software company, announced the launch of its ArcGIS Enterprise 10.9 version, which introduced advanced analytics capabilities and improved cloud support (Esri Press Release, 2024).
  • In March 2024, Hexagon AB, a global technology company, acquired Intergraph Corporation's GIS business, expanding its geospatial solutions portfolio and strengthening its position in the market (Hexagon AB Press Release, 2024).
  • In April 2025, Google Maps Platform and Microsoft Azure signed a strategic partnership, enabling seamless integration of GIS services between their platforms, providing enhanced capabilities for businesses (Microsoft News Center, 2025).
  • In May 2025, the European Union approved the Copernicus Regulation, a €15.4 billion funding program for Earth observation and GIS services, demonstrating a significant commitment to advancing geospatial technology in Europe (European Commission Press Release, 2025).

Research Analyst Overview

  • The market is experiencing significant advancements in spatial optimization, predictive analytics, and geospatial data integration. Businesses are leveraging GIS workflows to assess vulnerability and mitigate risks, utilizing artificial intelligence and machine learning for climate change modeling and spatial relationships. Prescriptive analytics and business intelligence provide insights for resource allocation and optimization, while data consistency is ensured through cloud-based GIS and data governance. Data mining and spatial queries enhance data accuracy and completeness, enabling scenario analysis and risk assessment.
  • Geospatial intelligence is further advanced through virtual reality and augmented reality, offering immersive experiences for spatial simulation and data interoperability. Optimization algorithms and data security are crucial components of the market, ensuring efficient operations and protecting sensitive information. Overall, the market is transforming the way businesses make informed decisions by integrating geospatial data and advanced analytics.

Dive into Technavio's robust research methodology, blending expert interviews, extensive data synthesis, and validated models for unparalleled GIS Market insights. See full methodology.

Market Scope

Report Coverage

Details

Page number

218

Base year

2024

Historic period

2019-2023

Forecast period

2025-2029

Growth momentum & CAGR

Accelerate at a CAGR of 20.3%

Market growth 2025-2029

USD 24070.6 million

Market structure

Fragmented

YoY growth 2024-2025(%)

17.2

Key countries

US, China, Germany, UK, Canada, Brazil, Japan, France, South Korea, and UAE

Competitive landscape

Leading Companies, Market Positioning of Companies, Competitive Strategies, and Industry Risks

Request Free Sample

What are the Key Data Covered in this GIS Market Research and Growth Report?

  • CAGR of the GIS industry during the forecast period
  • Detailed information on factors that will drive the growth and forecasting between 2025 and 2029
  • Precise estimation of the size of the market and its contribution of the industry in focus to the parent market
  • Accurate predictions about upcoming growth and trends and changes in consumer behaviour
  • Growth of the market across North America, Europe, APAC, South America, and Middle East and Africa
  • Thorough analysis of the market's competitive landscape and detailed information about companies
  • Comprehensive analysis of factors that will challenge the gis market growth of industry companies

We can help! Our analysts can customize this gis market research report to meet your requirements.

Get in touch

1 Executive Summary

  • 1.1 Market overview
    • Executive Summary - Chart on Market Overview
    • Executive Summary - Data Table on Market Overview
    • Executive Summary - Chart on Global Market Characteristics
    • Executive Summary - Chart on Market by Geography
    • Executive Summary - Chart on Market Segmentation by Product
    • Executive Summary - Chart on Market Segmentation by Type
    • Executive Summary - Chart on Market Segmentation by Device
    • Executive Summary - Chart on Incremental Growth
    • Executive Summary - Data Table on Incremental Growth
    • Executive Summary - Chart on Company Market Positioning

2 Technavio Analysis

  • 2.1 Analysis of price sensitivity, lifecycle, customer purchase basket, adoption rates, and purchase criteria
    • Analysis of price sensitivity, lifecycle, customer purchase basket, adoption rates, and purchase criteria
  • 2.2 Criticality of inputs and Factors of differentiation
    • Overview on criticality of inputs and factors of differentiation
  • 2.3 Factors of disruption
    • Overview on factors of disruption
  • 2.4 Impact of drivers and challenges
    • Impact of drivers and challenges in 2024 and 2029

3 Market Landscape

  • 3.1 Market ecosystem
    • Parent Market
    • Data Table on - Parent Market
  • 3.2 Market characteristics
    • Market characteristics analysis
  • 3.3 Value chain analysis
    • Value chain analysis

4 Market Sizing

  • 4.1 Market definition
    • Offerings of companies included in the market definition
  • 4.2 Market segment analysis
    • Market segments
  • 4.3 Market size 2024
    • 4.4 Market outlook: Forecast for 2024-2029
      • Chart on Global - Market size and forecast 2024-2029 ($ million)
      • Data Table on Global - Market size and forecast 2024-2029 ($ million)
      • Chart on Global Market: Year-over-year growth 2024-2029 (%)
      • Data Table on Global Market: Year-over-year growth 2024-2029 (%)

    5 Historic Market Size

    • 5.1 Global GIS Market 2019 - 2023
      • Historic Market Size - Data Table on Global GIS Market 2019 - 2023 ($ million)
    • 5.2 Product segment analysis 2019 - 2023
      • Historic Market Size - Product Segment 2019 - 2023 ($ million)
    • 5.3 Type segment analysis 2019 - 2023
      • Historic Market Size - Type Segment 2019 - 2023 ($ million)
    • 5.4 Device segment analysis 2019 - 2023
      • Historic Market Size - Device Segment 2019 - 2023 ($ million)
    • 5.5 Geography segment analysis 2019 - 2023
      • Historic Market Size - Geography Segment 2019 - 2023 ($ million)
    • 5.6 Country segment analysis 2019 - 2023
      • Historic Market Size - Country Segment 2019 - 2023 ($ million)

    6 Qualitative Analysis

    • 6.1 The AI impact on Global GIS Market

      7 Five Forces Analysis

      • 7.1 Five forces summary
        • Five forces analysis - Comparison between 2024 and 2029
      • 7.2 Bargaining power of buyers
        • Bargaining power of buyers - Impact of key factors 2024 and 2029
      • 7.3 Bargaining power of suppliers
        • Bargaining power of suppliers - Impact of key factors in 2024 and 2029
      • 7.4 Threat of new entrants
        • Threat of new entrants - Impact of key factors in 2024 and 2029
      • 7.5 Threat of substitutes
        • Threat of substitutes - Impact of key factors in 2024 and 2029
      • 7.6 Threat of rivalry
        • Threat of rivalry - Impact of key factors in 2024 and 2029
      • 7.7 Market condition
        • Chart on Market condition - Five forces 2024 and 2029

      8 Market Segmentation by Product

      • 8.1 Market segments
        • Chart on Product - Market share 2024-2029 (%)
        • Data Table on Product - Market share 2024-2029 (%)
      • 8.2 Comparison by Product
        • Chart on Comparison by Product
        • Data Table on Comparison by Product
      • 8.3 Software - Market size and forecast 2024-2029
        • Chart on Software - Market size and forecast 2024-2029 ($ million)
        • Data Table on Software - Market size and forecast 2024-2029 ($ million)
        • Chart on Software - Year-over-year growth 2024-2029 (%)
        • Data Table on Software - Year-over-year growth 2024-2029 (%)
      • 8.4 Data - Market size and forecast 2024-2029
        • Chart on Data - Market size and forecast 2024-2029 ($ million)
        • Data Table on Data - Market size and forecast 2024-2029 ($ million)
        • Chart on Data - Year-over-year growth 2024-2029 (%)
        • Data Table on Data - Year-over-year growth 2024-2029 (%)
      • 8.5 Services - Market size and forecast 2024-2029
        • Chart on Services - Market size and forecast 2024-2029 ($ million)
        • Data Table on Services - Market size and forecast 2024-2029 ($ million)
        • Chart on Services - Year-over-year growth 2024-2029 (%)
        • Data Table on Services - Year-over-year growth 2024-2029 (%)
      • 8.6 Market opportunity by Product
        • Market opportunity by Product ($ million)
        • Data Table on Market opportunity by Product ($ million)

      9 Market Segmentation by Type

      • 9.1 Market segments
        • Chart on Type - Market share 2024-2029 (%)
        • Data Table on Type - Market share 2024-2029 (%)
      • 9.2 Comparison by Type
        • Chart on Comparison by Type
        • Data Table on Comparison by Type
      • 9.3 Telematics and navigation - Market size and forecast 2024-2029
        • Chart on Telematics and navigation - Market size and forecast 2024-2029 ($ million)
        • Data Table on Telematics and navigation - Market size and forecast 2024-2029 ($ million)
        • Chart on Telematics and navigation - Year-over-year growth 2024-2029 (%)
        • Data Table on Telematics and navigation - Year-over-year growth 2024-2029 (%)
      • 9.4 Mapping - Market size and forecast 2024-2029
        • Chart on Mapping - Market size and forecast 2024-2029 ($ million)
        • Data Table on Mapping - Market size and forecast 2024-2029 ($ million)
        • Chart on Mapping - Year-over-year growth 2024-2029 (%)
        • Data Table on Mapping - Year-over-year growth 2024-2029 (%)
      • 9.5 Surveying - Market size and forecast 2024-2029
        • Chart on Surveying - Market size and forecast 2024-2029 ($ million)
        • Data Table on Surveying - Market size and forecast 2024-2029 ($ million)
        • Chart on Surveying - Year-over-year growth 2024-2029 (%)
        • Data Table on Surveying - Year-over-year growth 2024-2029 (%)
      • 9.6 Location-based services - Market size and forecast 2024-2029
        • Chart on Location-based services - Market size and forecast 2024-2029 ($ million)
        • Data Table on Location-based services - Market size and forecast 2024-2029 ($ million)
        • Chart on Location-based services - Year-over-year growth 2024-2029 (%)
        • Data Table on Location-based services - Year-over-year growth 2024-2029 (%)
      • 9.7 Market opportunity by Type
        • Market opportunity by Type ($ million)
        • Data Table on Market opportunity by Type ($ million)

      10 Market Segmentation by Device

      • 10.1 Market segments
        • Chart on Device - Market share 2024-2029 (%)
        • Data Table on Device - Market share 2024-2029 (%)
      • 10.2 Comparison by Device
        • Chart on Comparison by Device
        • Data Table on Comparison by Device
      • 10.3 Desktop - Market size and forecast 2024-2029
        • Chart on Desktop - Market size and forecast 2024-2029 ($ million)
        • Data Table on Desktop - Market size and forecast 2024-2029 ($ million)
        • Chart on Desktop - Year-over-year growth 2024-2029 (%)
        • Data Table on Desktop - Year-over-year growth 2024-2029 (%)
      • 10.4 Mobile - Market size and forecast 2024-2029
        • Chart on Mobile - Market size and forecast 2024-2029 ($ million)
        • Data Table on Mobile - Market size and forecast 2024-2029 ($ million)
        • Chart on Mobile - Year-over-year growth 2024-2029 (%)
        • Data Table on Mobile - Year-over-year growth 2024-2029 (%)
      • 10.5 Market opportunity by Device
        • Market opportunity by Device ($ million)
        • Data Table on Market opportunity by Device ($ million)

      11 Customer Landscape

      • 11.1 Customer landscape overview
        • Analysis of price sensitivity, lifecycle, customer purchase basket, adoption rates, and purchase criteria

      12 Geographic Landscape

      • 12.1 Geographic segmentation
        • Chart on Market share by geography 2024-2029 (%)
        • Data Table on Market share by geography 2024-2029 (%)
      • 12.2 Geographic comparison
        • Chart on Geographic comparison
        • Data Table on Geographic comparison
      • 12.3 North America - Market size and forecast 2024-2029
        • Chart on North America - Market size and forecast 2024-2029 ($ million)
        • Data Table on North America - Market size and forecast 2024-2029 ($ million)
        • Chart on North America - Year-over-year growth 2024-2029 (%)
        • Data Table on North America - Year-over-year growth 2024-2029 (%)
      • 12.4 Europe - Market size and forecast 2024-2029
        • Chart on Europe - Market size and forecast 2024-2029 ($ million)
        • Data Table on Europe - Market size and forecast 2024-2029 ($ million)
        • Chart on Europe - Year-over-year growth 2024-2029 (%)
        • Data Table on Europe - Year-over-year growth 2024-2029 (%)
      • 12.5 APAC - Market size and forecast 2024-2029
        • Chart on APAC - Market size and forecast 2024-2029 ($ million)
        • Data Table on APAC - Market size and forecast 2024-2029 ($ million)
        • Chart on APAC - Year-over-year growth 2024-2029 (%)
        • Data Table on APAC - Year-over-year growth 2024-2029 (%)
      • 12.6 South America - Market size and forecast 2024-2029
        • Chart on South America - Market size and forecast 2024-2029 ($ million)
        • Data Table on South America - Market size and forecast 2024-2029 ($ million)
        • Chart on South America - Year-over-year growth 2024-2029 (%)
        • Data Table on South America - Year-over-year growth 2024-2029 (%)
      • 12.7 Middle East and Africa - Market size and forecast 2024-2029
        • Chart on Middle East and Africa - Market size and forecast 2024-2029 ($ million)
        • Data Table on Middle East and Africa - Market size and forecast 2024-2029 ($ million)
        • Chart on Middle East and Africa - Year-over-year growth 2024-2029 (%)
        • Data Table on Middle East and Africa - Year-over-year growth 2024-2029 (%)
      • 12.8 US - Market size and forecast 2024-2029
        • Chart on US - Market size and forecast 2024-2029 ($ million)
        • Data Table on US - Market size and forecast 2024-2029 ($ million)
        • Chart on US - Year-over-year growth 2024-2029 (%)
        • Data Table on US - Year-over-year growth 2024-2029 (%)
      • 12.9 China - Market size and forecast 2024-2029
        • Chart on China - Market size and forecast 2024-2029 ($ million)
        • Data Table on China - Market size and forecast 2024-2029 ($ million)
        • Chart on China - Year-over-year growth 2024-2029 (%)
        • Data Table on China - Year-over-year growth 2024-2029 (%)
      • 12.10 Germany - Market size and forecast 2024-2029
        • Chart on Germany - Market size and forecast 2024-2029 ($ million)
        • Data Table on Germany - Market size and forecast 2024-2029 ($ million)
        • Chart on Germany - Year-over-year growth 2024-2029 (%)
        • Data Table on Germany - Year-over-year growth 2024-2029 (%)
      • 12.11 UK - Market size and forecast 2024-2029
        • Chart on UK - Market size and forecast 2024-2029 ($ million)
        • Data Table on UK - Market size and forecast 2024-2029 ($ million)
        • Chart on UK - Year-over-year growth 2024-2029 (%)
        • Data Table on UK - Year-over-year growth 2024-2029 (%)
      • 12.12 Canada - Market size and forecast 2024-2029
        • Chart on Canada - Market size and forecast 2024-2029 ($ million)
        • Data Table on Canada - Market size and forecast 2024-2029 ($ million)
        • Chart on Canada - Year-over-year growth 2024-2029 (%)
        • Data Table on Canada - Year-over-year growth 2024-2029 (%)
      • 12.13 Brazil - Market size and forecast 2024-2029
        • Chart on Brazil - Market size and forecast 2024-2029 ($ million)
        • Data Table on Brazil - Market size and forecast 2024-2029 ($ million)
        • Chart on Brazil - Year-over-year growth 2024-2029 (%)
        • Data Table on Brazil - Year-over-year growth 2024-2029 (%)
      • 12.14 Japan - Market size and forecast 2024-2029
        • Chart on Japan - Market size and forecast 2024-2029 ($ million)
        • Data Table on Japan - Market size and forecast 2024-2029 ($ million)
        • Chart on Japan - Year-over-year growth 2024-2029 (%)
        • Data Table on Japan - Year-over-year growth 2024-2029 (%)
      • 12.15 France - Market size and forecast 2024-2029
        • Chart on France - Market size and forecast 2024-2029 ($ million)
        • Data Table on France - Market size and forecast 2024-2029 ($ million)
        • Chart on France - Year-over-year growth 2024-2029 (%)
        • Data Table on France - Year-over-year growth 2024-2029 (%)
      • 12.16 South Korea - Market size and forecast 2024-2029
        • Chart on South Korea - Market size and forecast 2024-2029 ($ million)
        • Data Table on South Korea - Market size and forecast 2024-2029 ($ million)
        • Chart on South Korea - Year-over-year growth 2024-2029 (%)
        • Data Table on South Korea - Year-over-year growth 2024-2029 (%)
      • 12.17 UAE - Market size and forecast 2024-2029
        • Chart on UAE - Market size and forecast 2024-2029 ($ million)
        • Data Table on UAE - Market size and forecast 2024-2029 ($ million)
        • Chart on UAE - Year-over-year growth 2024-2029 (%)
        • Data Table on UAE - Year-over-year growth 2024-2029 (%)
      • 12.18 Market opportunity by geography
        • Market opportunity by geography ($ million)
        • Data Tables on Market opportunity by geography ($ million)

      13 Drivers, Challenges, and Opportunity/Restraints

      • 13.1 Market drivers
        • 13.2 Market challenges
          • 13.3 Impact of drivers and challenges
            • Impact of drivers and challenges in 2024 and 2029
          • 13.4 Market opportunities/restraints

            14 Competitive Landscape

            • 14.1 Overview
              • 14.2 Competitive Landscape
                • Overview on criticality of inputs and factors of differentiation
              • 14.3 Landscape disruption
                • Overview on factors of disruption
              • 14.4 Industry risks
                • Impact of key risks on business

              15 Competitive Analysis

              • 15.1 Companies profiled
                • Companies covered
              • 15.2 Company ranking index
                • Company ranking index
              • 15.3 Market positioning of companies
                • Matrix on companies position and classification
              • 15.4 AmigoCloud Inc.
                • AmigoCloud Inc. - Overview
                • AmigoCloud Inc. - Product / Service
                • AmigoCloud Inc. - Key offerings
                • SWOT
              • 15.5 Autodesk Inc.
                • Autodesk Inc. - Overview
                • Autodesk Inc. - Product / Service
                • Autodesk Inc. - Key news
                • Autodesk Inc. - Key offerings
                • SWOT
              • 15.6 Bentley Systems Inc.
                • Bentley Systems Inc. - Overview
                • Bentley Systems Inc. - Product / Service
                • Bentley Systems Inc. - Key news
                • Bentley Systems Inc. - Key offerings
                • SWOT
              • 15.7 Caliper Corp.
                • Caliper Corp. - Overview
                • Caliper Corp. - Product / Service
                • Caliper Corp. - Key offerings
                • SWOT
              • 15.8 Cadcorp Ltd.
                • Cadcorp Ltd. - Overview
                • Cadcorp Ltd. - Product / Service
                • Cadcorp Ltd. - Key offerings
                • SWOT
              • 15.9 Esri Global Inc.
                • Esri Global Inc. - Overview
                • Esri Global Inc. - Product / Service
                • Esri Global Inc. - Key news
                • Esri Global Inc. - Key offerings
                • SWOT
              • 15.10 Google LLC
                • Google LLC - Overview
                • Google LLC - Product / Service
                • Google LLC - Key news
                • Google LLC - Key offerings
                • SWOT
              • 15.11 Hexagon AB
                • Hexagon AB - Overview
                • Hexagon AB - Business segments
                • Hexagon AB - Key news
                • Hexagon AB - Key offerings
                • Hexagon AB - Segment focus
                • SWOT
              • 15.12 Hi Target
                • Hi Target - Overview
                • Hi Target - Product / Service
                • Hi Target - Key offerings
                • SWOT
              • 15.13 Mapbox Inc.
                • Mapbox Inc. - Overview
                • Mapbox Inc. - Product / Service
                • Mapbox Inc. - Key offerings
                • SWOT
              • 15.14 Maxar Technologies Inc.
                • Maxar Technologies Inc. - Overview
                • Maxar Technologies Inc. - Product / Service
                • Maxar Technologies Inc. - Key news
                • Maxar Technologies Inc. - Key offerings
                • SWOT
              • 15.15 Pitney Bowes Inc.
                • Pitney Bowes Inc. - Overview
                • Pitney Bowes Inc. - Business segments
                • Pitney Bowes Inc. - Key news
                • Pitney Bowes Inc. - Key offerings
                • Pitney Bowes Inc. - Segment focus
                • SWOT
              • 15.16 Rolta India Ltd.
                • Rolta India Ltd. - Overview
                • Rolta India Ltd. - Product / Service
                • Rolta India Ltd. - Key offerings
                • SWOT
              • 15.17 Scanpoint Geomatics Ltd.
                • Scanpoint Geomatics Ltd. - Overview
                • Scanpoint Geomatics Ltd. - Product / Service
                • Scanpoint Geomatics Ltd. - Key offerings
                • SWOT
              • 15.18 Takor Group Ltd.
                • Takor Group Ltd. - Overview
                • Takor Group Ltd. - Product / Service
                • Takor Group Ltd. - Key offerings
                • SWOT

              16 Appendix

              • 16.1 Scope of the report
                • 16.2 Inclusions and exclusions checklist
                  • Inclusions checklist
                  • Exclusions checklist
                • 16.3 Currency conversion rates for US$
                  • Currency conversion rates for US$
                • 16.4 Research methodology
                  • Research methodology
                • 16.5 Data procurement
                  • Information sources
                • 16.6 Data validation
                  • Data validation
                • 16.7 Validation techniques employed for market sizing
                  • Validation techniques employed for market sizing
                • 16.8 Data synthesis
                  • Data synthesis
                • 16.9 360 degree market analysis
                  • 360 degree market analysis
                • 16.10 List of abbreviations
                  • List of abbreviations

                Research Methodology

                Technavio presents a detailed picture of the market by way of study, synthesis, and summation of data from multiple sources. The analysts have presented the various facets of the market with a particular focus on identifying the key industry influencers. The data thus presented is comprehensive, reliable, and the result of extensive research, both primary and secondary.

                INFORMATION SOURCES

                Primary sources

                • Manufacturers and suppliers
                • Channel partners
                • Industry experts
                • Strategic decision makers

                Secondary sources

                • Industry journals and periodicals
                • Government data
                • Financial reports of key industry players
                • Historical data
                • Press releases

                DATA ANALYSIS

                Data Synthesis

                • Collation of data
                • Estimation of key figures
                • Analysis of derived insights

                Data Validation

                • Triangulation with data models
                • Reference against proprietary databases
                • Corroboration with industry experts

                REPORT WRITING

                Qualitative

                • Market drivers
                • Market challenges
                • Market trends
                • Five forces analysis

                Quantitative

                • Market size and forecast
                • Market segmentation
                • Geographical insights
                • Competitive landscape

                Interested in this report?

                Get your sample now to see our research methodology and insights!

                Download Now

                Frequently Asked Questions

                Gis market growth will increase by $ 24070.6 mn during 2025-2029 .

                The Gis market is expected to grow at a CAGR of 20.3% during 2025-2029 .

                Gis market is segmented by Product( Software, Data, Services) Type( Telematics and navigation, Mapping, Surveying, Location-based services, MEA) Device( Desktop, Mobile, APAC, South America, Middle East and Africa)

                AmigoCloud Inc., Autodesk Inc., Bentley Systems Inc., Caliper Corp., Cadcorp Ltd., Esri Global Inc., General Electric Co., Google LLC, Hexagon AB, Hi Target, Mapbox Inc., Maxar Technologies Inc., Pitney Bowes Inc., Rolta India Ltd., Scanpoint Geomatics Ltd., Takor Group Ltd., TomTom NV, Topcon Corp., Trimble Inc., UrtheCast Corp. are a few of the key vendors in the Gis market.

                North America will register the highest growth rate of 38% among the other regions. Therefore, the Gis market in North America is expected to garner significant business opportunities for the vendors during the forecast period.

                US, China, Germany, UK, Canada, Brazil, Japan, France, South Korea, UAE

                • Integration of BIM and GISOne of the major factors that drive the global GIS market is the increasing integration of GIS solutions with building information modeling (BIM). BIM has certain levels of implementation. At the primary level is the driving factor this market.
                • BIM software is used with a GIS for organizing and standardizing 2D and 3D design data. For example is the driving factor this market.
                • ArcGIS for AutoCAD is a software created by ESRI is the driving factor this market.
                • which can input GIS data in AutoCAD software. At the secondary level of BIM implementation is the driving factor this market.
                • GIS and BIM software work together to integrate 3D computer-aided design (CAD) in construction works. GIS adds value to BIM by visualizing and analyzing the data regarding buildings and the surrounding features is the driving factor this market.
                • such as environmental and demographic information. BIM data and workflows include information regarding sensors and the placement of devices in IoT-connected networks. Location-based services by GIS providers help absorb huge volumes of data from stationary and moving devices and support performing real-time spatial analytics and deriving useful geographic insights from it. The 3D models present in software such as Autodesk Infraworks 360 help integrate GIS data with 3D modeling and designing data is the driving factor this market.
                • which is very useful in construction works. Owing to the advantages associated with the integration of BIM with GIS solutions is the driving factor this market.
                • the demand for GIS solutions is expected to increase during the forecast period is the driving factor this market.
                • driving the growth of the market in focus. is the driving factor this market.

                The Gis market vendors should focus on grabbing business opportunities from the Software segment as it accounted for the largest market share in the base year.