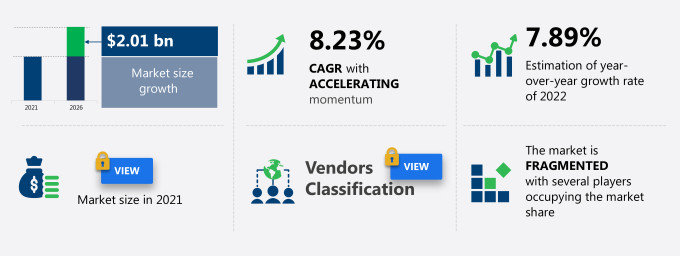
The GIS market share in EMEA is expected to increase to USD 2.01 billion from 2021 to 2026, and the market’s growth momentum will accelerate at a CAGR of 8.23%.
This EMEA GIS market research report provides valuable insights on the post COVID-19 impact on the market, which will help companies evaluate their business approaches. Furthermore, this report extensively covers GIS market in EMEA segmentation by:
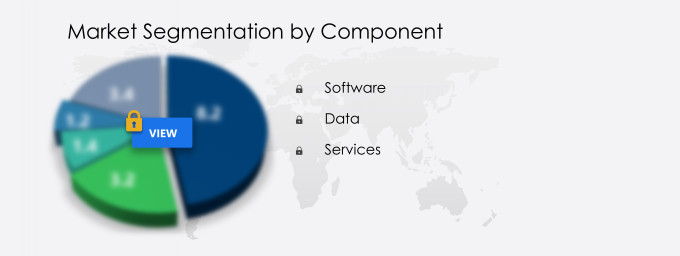
- Component - Software, data, and services
- End-user - Government, utilities, military, telecommunication, and others
What will the GIS Market Size in EMEA be During the Forecast Period?
Download the Free Report Sample to Unlock the GIS Market Size in EMEA for the Forecast Period and Other Important Statistics
The EMEA GIS market report also offers information on several market vendors, including arxiT SA, Autodesk Inc., Bentley Systems Inc., Cimtex International, CNIM SA, Computer Aided Development Corp. Ltd., Environmental Systems Research Institute Inc., Fugro NV, General Electric Co., HERE Global BV, Hexagon AB, Hi-Target, Mapbox Inc., Maxar Technologies Inc., Pitney Bowes Inc., PSI Services LLC, Rolta India Ltd., SNC Lavalin Group Inc., SuperMap Software Co. Ltd., Takor Group Ltd., and Trimble Inc. among others.
GIS Market in EMEA: Key Drivers, Trends, and Challenges
The integration of BIM and GIS is notably driving the GIS market growth in EMEA, although factors such as data viability and risk of intrusion may impede market growth. Our research analysts have studied the historical data and deduced the key market drivers and the COVID-19 pandemic impact on the GIS industry in EMEA. The holistic analysis of the drivers will help in deducing end goals and refining marketing strategies to gain a competitive edge.
Key GIS Market Driver in EMEA
One of the key factors driving the geographic information system (GIS) market growth in EMEA is the integration of BIM and GIS. A GIS adds value to BIM by visualizing and analyzing the data with regard to the buildings and surrounding features, such as environmental and demographic information. BIM data and workflows include information regarding sensors and the placement of devices in IoT-connected networks. For instance, Dubai's Civil Defense Department has integrated GIS data with its automatic fire surveillance system. This information is provided in a matter of seconds on the building monitoring systems of the Civil Defense Department. Furthermore, location-based services offered by GIS providers help generate huge volumes of data from stationary and moving devices and enable users to perform real-time spatial analytics and derive useful geographic insights from it. Owing to the advantages associated with the integration of BIM with GIS solutions, the demand for GIS solutions is expected to increase during the forecast period.
Key GIS Market Challenge in EMEA
One of the key challenges to the is the GIS market growth in EMEA is the data viability and risk of intrusion. Hackers can hack into these systems with malicious intentions and manipulate the data, which could have destructive or negative repercussions. Such hacking of data could cause nationwide chaos. For instance, if a hacker manipulated the traffic management database, massive traffic jams and accidents could result. If a hacker obtained access to the database of a national disaster management organization and manipulated the data to create a false disaster situation, it could lead to a panic situation. Therefore, the security infrastructure accompanying the implementation of GIS software solutions must be robust. Such security threats may impede market growth in the coming years.
Key GIS Market Trend in EMEA
Integration of augmented reality (AR) and GIS is one of the key geographic information system market trends in EMEA that is expected to impact the industry positively in the forecast period. AR apps could provide GIS content to professional end-users and aid them in making decisions on-site, using advanced and reliable information available on their mobile devices and smartphones. For instance, when the user simply points the camera of the phone at the ground, the application will be able to show the user the location and orientation of water pipes and electric cables that are concealed underground. Organizations such as the Open Geospatial Consortium (OGC) and the World Wide Web Consortium (W3C) are seeking investments and are open to sponsors for an upcoming AR pilot project, which seeks to advance the standards of AR technology at both respective organizations. Such factors will further support the market growth in the coming years.
This GIS market in EMEA analysis report also provides detailed information on other upcoming trends and challenges that will have a far-reaching effect on the market growth. The actionable insights on the trends and challenges will help companies evaluate and develop growth strategies for 2022-2026.
Parent Market Analysis
Technavio categorizes the geographic information system (GIS) market in EMEA as a part of the global systems software market. Our research report has extensively covered external factors influencing the parent market growth potential in the coming years, which will determine the levels of growth of the GIS market in EMEA during the forecast period.
Who are the Major GIS Market Vendors in EMEA?
The report analyzes the market’s competitive landscape and offers information on several market vendors, including:
- arxiT SA
- Autodesk Inc.
- Bentley Systems Inc.
- Cimtex International
- CNIM SA
- Computer Aided Development Corp. Ltd.
- Environmental Systems Research Institute Inc.
- Fugro NV
- General Electric Co.
- HERE Global BV
- Hexagon AB
- Hi-Target
- Mapbox Inc.
- Maxar Technologies Inc.
- Pitney Bowes Inc.
- PSI Services LLC
- Rolta India Ltd.
- SNC Lavalin Group Inc.
- SuperMap Software Co. Ltd.
- Takor Group Ltd.
- Trimble Inc.
This statistical study of the GIS market in EMEA encompasses successful business strategies deployed by the key vendors. The GIS market in EMEA is fragmented and the vendors are deploying growth strategies such as an increase in service extensions, technological innovations, and M&A activities to compete in the market.
Product Insights and News
- Autodesk Inc. - Under the unified segment, the company offers customers with productive business solutions through powerful technology products and services.
- Autodesk Inc. - The company offers GIS data as background data for designing to use in CAD software.
To make the most of the opportunities and recover from post COVID-19 impact, market vendors should focus more on the growth prospects in the fast-growing segments, while maintaining their positions in the slow-growing segments.
The GIS market in EMEA forecast report offers in-depth insights into key vendor profiles. The profiles include information on the production, sustainability, and prospects of the leading companies.
GIS Market in EMEA Value Chain Analysis
Our report provides extensive information on the value chain analysis for the GIS market in EMEA, which vendors can leverage to gain a competitive advantage during the forecast period. The end-to-end understanding of the value chain is essential in profit margin optimization and evaluation of business strategies. The data available in our value chain analysis segment can help vendors drive costs and enhance customer services during the forecast period.
What are the Revenue-generating Component Segments in the GIS Market in EMEA?
To gain further insights on the market contribution of various segments Request for a FREE sample
The GIS market share growth in EMEA by the software segment will be significant during the forecast period. The significant increase in demand for software solutions due to the increase in installations of GIS software will drive the segment growth in the coming years. For instance, GIS solution provider Environmental Systems Research Institute (ESRI) has a major presence in the region, with several leading European utilities adopting the organization's GIS software.
This report provides an accurate prediction of the contribution of all the segments to the growth of the GIS market size in EMEA and actionable market insights on post COVID-19 impact on each segment.
|
GIS Market Scope in EMEA |
|
|
Report Coverage |
Details |
|
Page number |
120 |
|
Base year |
2021 |
|
Forecast period |
2022-2026 |
|
Growth momentum & CAGR |
Accelerate at a CAGR of 8.23% |
|
Market growth 2022-2026 |
$ 2.01 billion |
|
Market structure |
Fragmented |
|
YoY growth (%) |
7.89 |
|
Competitive landscape |
Leading companies, Competitive strategies, Consumer engagement scope |
|
Key companies profiled |
arxiT SA, Autodesk Inc., Bentley Systems Inc., Cimtex International, CNIM SA, Computer Aided Development Corp. Ltd., Environmental Systems Research Institute Inc., Fugro NV, General Electric Co., HERE Global BV, Hexagon AB, Hi-Target, Mapbox Inc., Maxar Technologies Inc., Pitney Bowes Inc., PSI Services LLC, Rolta India Ltd., SNC Lavalin Group Inc., SuperMap Software Co. Ltd., Takor Group Ltd., and Trimble Inc. |
|
Market dynamics |
Parent market analysis, Market growth inducers and obstacles, Fast-growing and slow-growing segment analysis, COVID 19 impact and recovery analysis and future consumer dynamics, Market condition analysis for forecast period |
|
Customization purview |
If our report has not included the data that you are looking for, you can reach out to our analysts and get segments customized. |
What are the Key Data Covered in this GIS Market in EMEA Report?
- CAGR of the market during the forecast period 2022-2026
- Detailed information on factors that will drive GIS market growth in EMEA during the next five years
- Precise estimation of the GIS market size in EMEA and its contribution to the parent market
- Accurate predictions on upcoming trends and changes in consumer behavior
- The growth of the GIS industry in EMEA
- A thorough analysis of the market’s competitive landscape and detailed information on vendors
- Comprehensive details of factors that will challenge the growth of GIS market vendors in EMEA
We can help! Our analysts can customize this report to meet your requirements. Get in touch


