Gluten-free Beer Market Analysis, Size, and Forecast 2026-2030: North America (US, Canada, and Mexico), Europe (Germany, UK, and France), APAC (China, India, and Japan), South America (Brazil and Argentina), Middle East and Africa (South Africa, UAE, and Turkey), and Rest of World (ROW)

Gluten-free Beer Market Analysis, Size, and Forecast 2026-2030:
North America (US, Canada, and Mexico), Europe (Germany, UK, and France), APAC (China, India, and Japan), South America (Brazil and Argentina), Middle East and Africa (South Africa, UAE, and Turkey), and Rest of World (ROW)

Published: Mar 2026 290 Pages SKU: IRTNTR73125

Market Overview at a Glance

$26.49 B
Market Opportunity
19.4%
CAGR 2025 - 2030
39.8%
North America Growth
$8.25 B
Off-trade store segment 2024

Gluten-free Beer Market Size 2026-2030

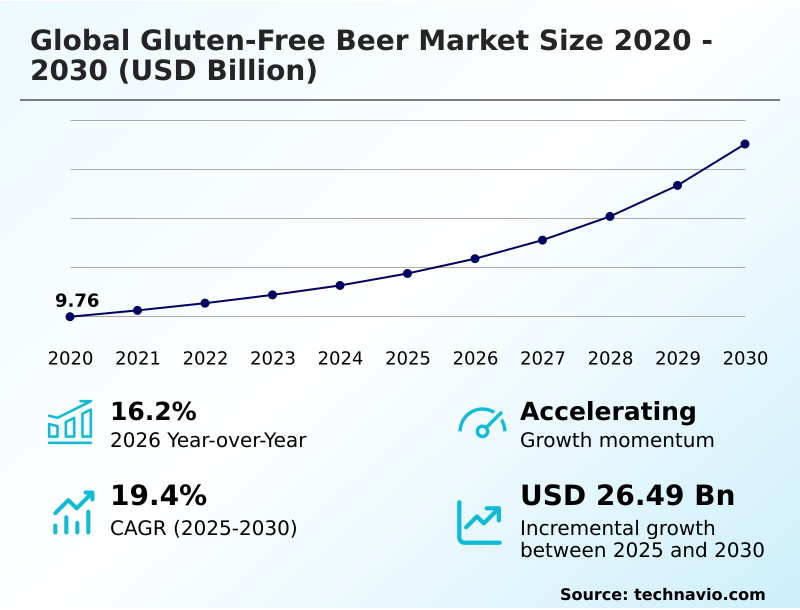
The gluten-free beer market size is valued to increase by USD 26.49 billion, at a CAGR of 19.4% from 2025 to 2030. Growing awareness of health benefits of gluten-free food products will drive the gluten-free beer market.

Major Market Trends & Insights

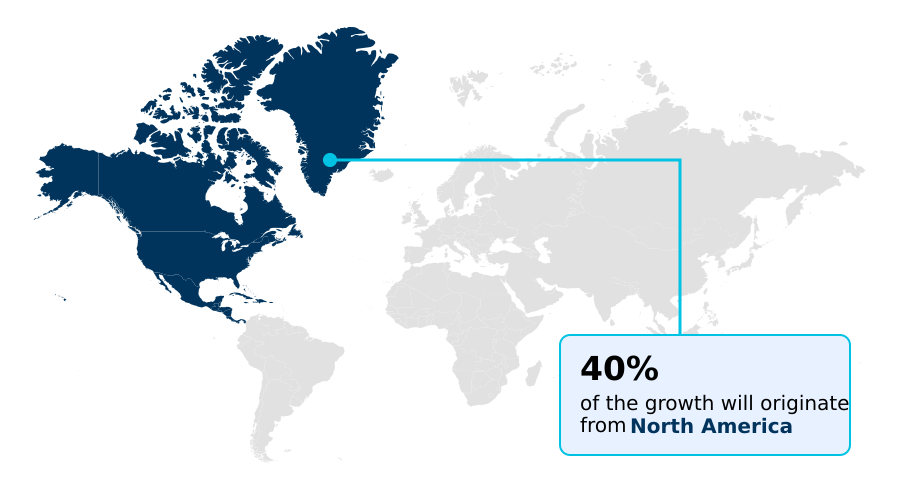
  • North America dominated the market and accounted for a 39.8% growth during the forecast period.
  • By Distribution Channel - Off-trade store segment was valued at USD 8.25 billion in 2024
  • By Type - Sorghum corn and rice segment accounted for the largest market revenue share in 2024

Market Size & Forecast

  • Market Opportunities: USD 35.33 billion
  • Market Future Opportunities: USD 26.49 billion
  • CAGR from 2025 to 2030 : 19.4%

Market Summary

  • The gluten-free beer market is evolving from a niche category into a significant lifestyle segment, driven by heightened celiac disease awareness and broader consumer dietary trends toward health-conscious consumption. A key dynamic is the continuous craft brewing innovation aimed at achieving sensory quality enhancement in products.
  • This involves using alternative grains, advanced brewing enzymes, and sophisticated fermentation control systems to create compelling allergen-free beverages. For instance, a mid-sized brewery aiming for niche market expansion must navigate complex supply chain logistics for specialty grain sourcing.
  • A critical business scenario involves implementing a transparent brewing process to ensure cross-contamination prevention in a dedicated gluten-free facility, which builds consumer brand loyalty. This requires rigorous quality control and often gluten-free certification.
  • However, the market also contends with challenges like competition from other dietary friendly alternatives and the complexities of regulatory compliance management, which can impact market entry strategy and product portfolio diversification. The adoption of sustainable brewing practices and clean label ingredients is becoming a standard expectation, influencing both production methods and brand storytelling marketing.

What will be the Size of the Gluten-free Beer Market during the forecast period?

Get Key Insights on Market Forecast (PDF) Request Free Sample

How is the Gluten-free Beer Market Segmented?

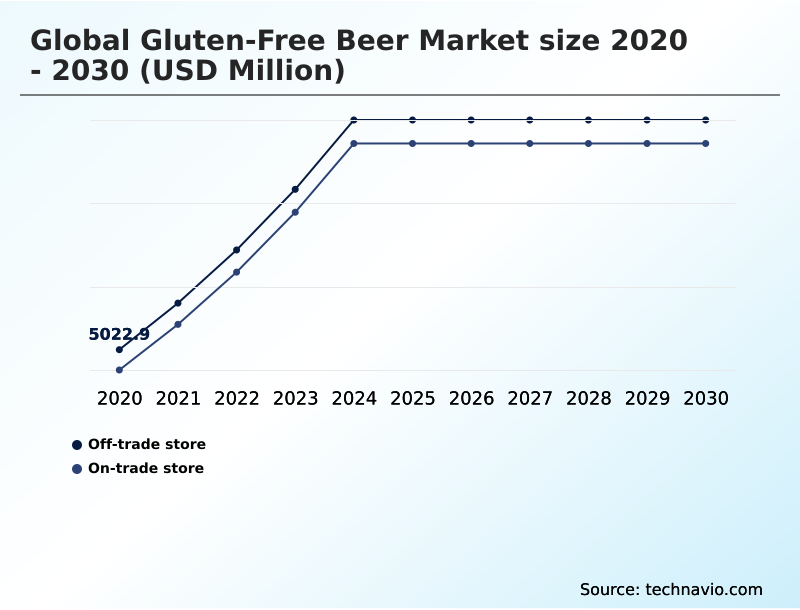
The gluten-free beer industry research report provides comprehensive data (region-wise segment analysis), with forecasts and estimates in "USD million" for the period 2026-2030, as well as historical data from 2020-2024 for the following segments.

  • Distribution channel
    • Off-trade store
    • On-trade store
  • Type
    • Sorghum corn and rice
    • Buckwheat
    • Others
  • Packaging
    • Bottles
    • Cans
    • Kegs
  • Geography
    • North America
      • US
      • Canada
      • Mexico
    • Europe
      • Germany
      • UK
      • France
    • APAC
      • China
      • India
      • Japan
    • South America
      • Brazil
      • Argentina
    • Middle East and Africa
      • South Africa
      • UAE
      • Turkey
    • Rest of World (ROW)

By Distribution Channel Insights

The off-trade store segment is estimated to witness significant growth during the forecast period.

The off-trade store segment is the principal growth driver, commanding approximately 65% of total market sales. This channel's dominance stems from the widespread availability of products in supermarkets, hypermarkets, and liquor stores, supporting a robust off-trade retail strategy.

The expansion of e-commerce beverage platforms further facilitates health-conscious consumption by offering convenient access to a wide range of allergen-free beverages. This direct-to-consumer sales model enhances the visibility of innovations like sorghum-based ale and buckwheat brewing.

Producers are focusing on sustainable brewing practices and advanced filtration methods to meet consumer dietary trends and ensure product quality, bolstering consumer brand loyalty and driving niche market expansion through organized retail penetration, which is critical for the specialty beverage market.

Request Free Sample

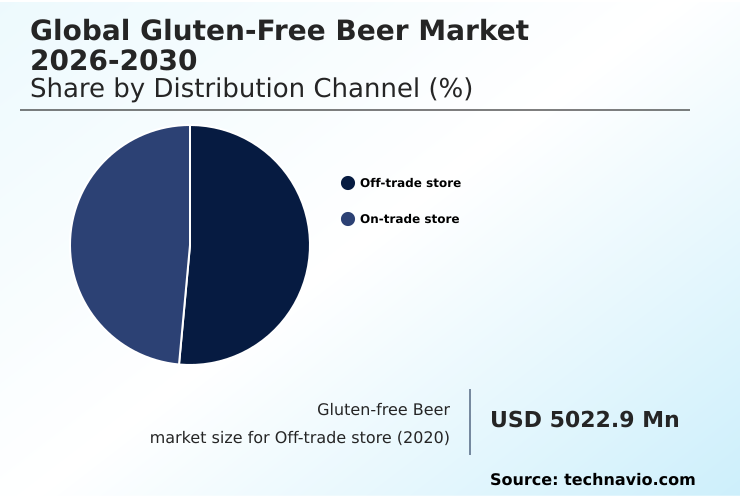
The Off-trade store segment was valued at USD 8.25 billion in 2024 and showed a gradual increase during the forecast period.

Request Free Sample

Regional Analysis

North America is estimated to contribute 39.8% to the growth of the global market during the forecast period.Technavio’s analysts have elaborately explained the regional trends and drivers that shape the market during the forecast period.

See How Gluten-free Beer Market Demand is Rising in North America Request Free Sample

The global landscape is led by North America, which accounts for nearly 40% of the incremental growth opportunity, driven by high celiac disease awareness and a mature craft beer community.

The region's sophisticated supply chain logistics for alternative grains have enabled producers to reduce raw material waste by over 15%.

Europe follows as a key region, characterized by stringent regulatory compliance management and strong on-trade channel expansion, especially in the UK and Germany.

Meanwhile, APAC is the fastest-growing market, fueled by rising health-conscious consumption and the premiumization of beverages in urban centers across China and Australia.

This horeca sector demand is creating new avenues for product portfolio diversification and niche market expansion, pushing for greater food service inclusivity worldwide and prompting innovations in rice malt production.

Market Dynamics

Our researchers analyzed the data with 2025 as the base year, along with the key drivers, trends, and challenges. A holistic analysis of drivers will help companies refine their marketing strategies to gain a competitive advantage.

  • The increasing demand for gluten-free beer is reshaping the alcoholic beverage sector, driven primarily by consumers seeking options for gluten-free beer for celiac disease and those interested in gluten-free beer and digestive health. This has spurred innovations in gluten-free brewing techniques, with many producers brewing gluten-free beer with sorghum or exploring the benefits of buckwheat in gluten-free beer.
  • Craft breweries with gluten-free options are at the forefront, developing diverse gluten-free ipa and stout varieties and expanding the availability of non-alcoholic gluten-free beer brands. A key technological driver is the use of enzyme technology for gluten removal, which allows for a wider range of flavor profiles.
  • The gluten-free beer market in North America remains a dominant force, though producers globally face challenges in gluten-free brewing ingredients. The competitive landscape of gluten-free beer is becoming more complex, influencing gluten-free beer packaging trends cans vs bottles. The consumer perception of gluten-free beer taste is steadily improving due to advancements like rice-based gluten-free lager production.
  • Companies that deploy effective marketing strategies for gluten-free beer, particularly through online retail for gluten-free beverages, see customer engagement rates more than double those of competitors. This growth is happening alongside the need to navigate the impact of regulations on gluten-free beer and promote sustainable practices in gluten-free brewing.

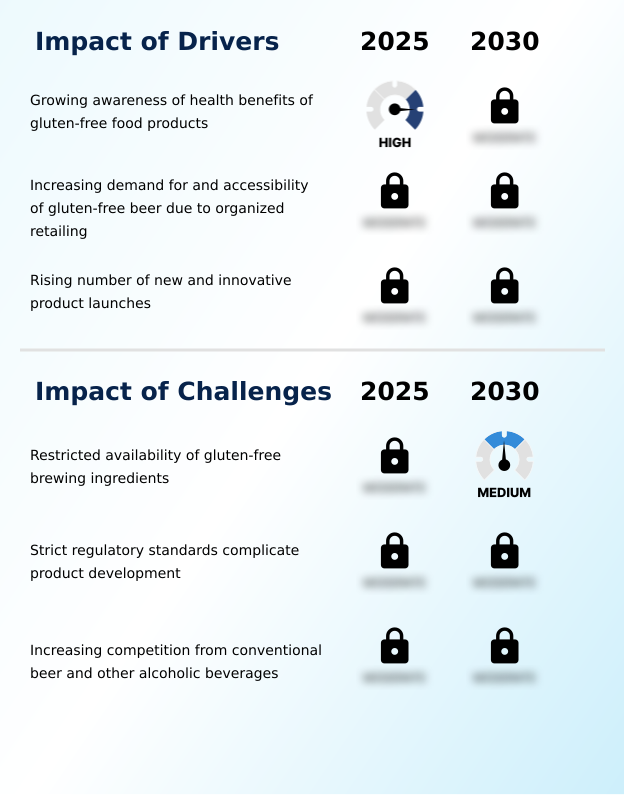
What are the key market drivers leading to the rise in the adoption of Gluten-free Beer Industry?

  • The primary driver for market growth is the increasing consumer awareness of the health benefits associated with gluten-free food and beverage products.

  • Growth is fundamentally driven by rising celiac disease awareness and a broader shift toward health-conscious consumption.
  • The presence of clean label ingredients is a key purchasing factor, with products highlighting a transparent brewing process showing a 25% higher rate of adoption among new consumers.
  • Increased organized retail penetration has also been critical, as placement in mainstream supermarkets boosts a product's initial sales velocity by over 50% compared to specialty store-only distribution.
  • This accessibility, combined with constant artisanal beverage production and innovation, expands the market beyond medical necessity.
  • As consumer dietary trends evolve, the demand for high-quality, functional beverage ingredients and dietary friendly alternatives continues to strengthen, reinforcing the need for product portfolio diversification and a solid market entry strategy.

What are the market trends shaping the Gluten-free Beer Industry?

  • The growing influence of online retailing is a transformative trend shaping the market. Digital commerce enhances accessibility and brand discovery for both niche and established producers.

  • The market is increasingly shaped by the influence of online retailing and continuous craft brewing innovation. The adoption of e-commerce beverage platforms allows for a direct-to-consumer sales model, enabling brands to achieve up to 40% greater market penetration in new regions compared to relying on traditional retail alone.
  • This digital shift supports the premiumization of beverages and provides a platform for brand storytelling marketing. Concurrently, the trend of small-batch production is accelerating product development, with craft producers launching new fruit-infused lager and botanical-infused beer styles in half the time of larger competitors.
  • This agility meets the demand for a transparent brewing process and strengthens consumer brand loyalty within the taproom and brewpub culture, driving the overall lifestyle beverage choice.

What challenges does the Gluten-free Beer Industry face during its growth?

  • A key challenge impacting industry growth is the restricted availability of specialized gluten-free brewing ingredients.

  • Key challenges center on operational and competitive pressures, including the complexities of specialty grain sourcing and strict regulatory compliance management. The cost of certified organic ingredients and other alternative grains can be up to 35% higher than conventional malt, directly impacting price competitiveness and market entry strategy.
  • Furthermore, navigating international gluten-free certification standards adds significant overhead, extending product launch timelines by an average of six months. The industry also faces intense rivalry from a widening array of dietary friendly alternatives. Firms must focus on sensory quality enhancement and efficient supply chain logistics to maintain margins.
  • This environment demands continuous innovation in fermentation control systems and malting process alternatives to overcome inherent production hurdles and secure a competitive footing.

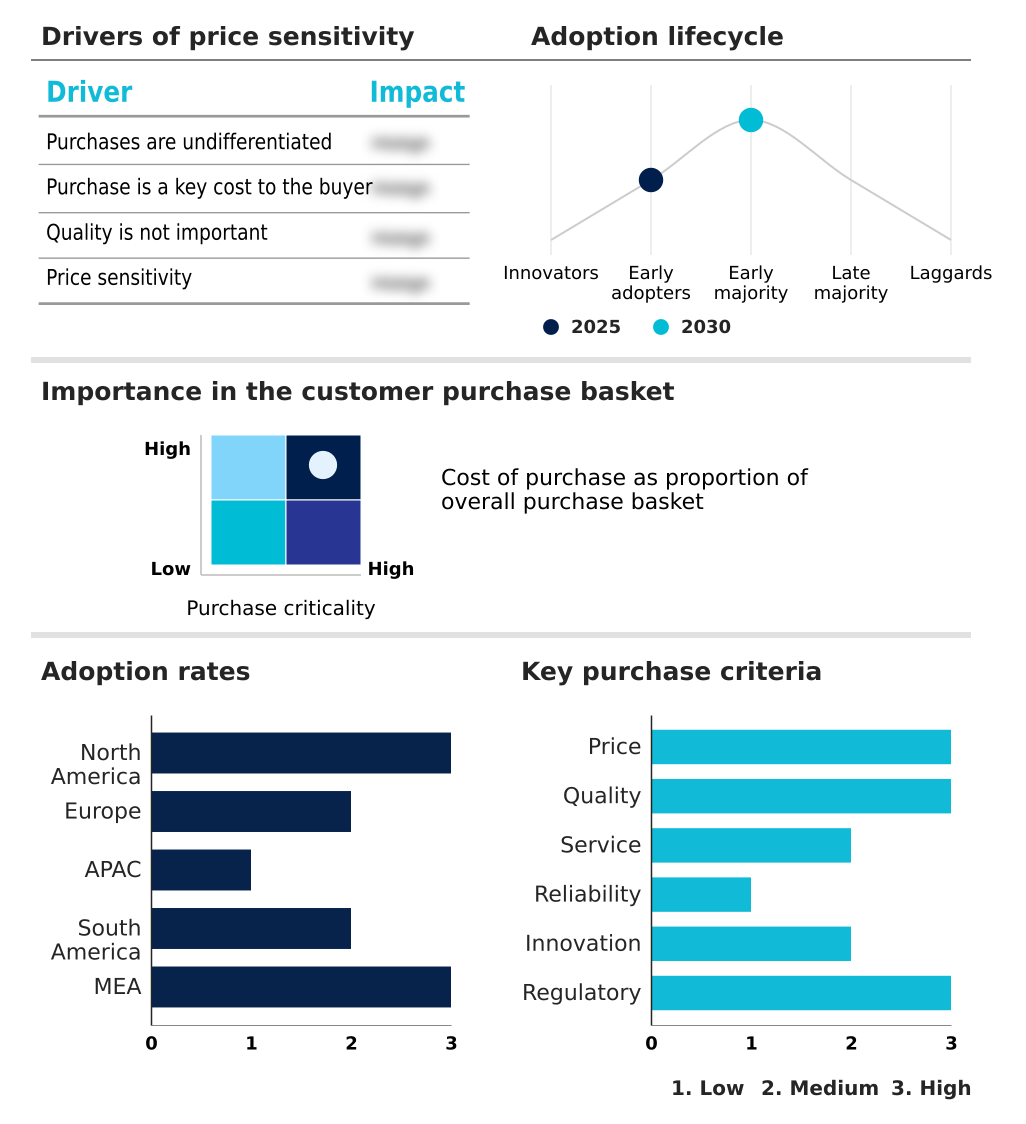
Exclusive Technavio Analysis on Customer Landscape

The gluten-free beer market forecasting report includes the adoption lifecycle of the market, covering from the innovator’s stage to the laggard’s stage. It focuses on adoption rates in different regions based on penetration. Furthermore, the gluten-free beer market report also includes key purchase criteria and drivers of price sensitivity to help companies evaluate and develop their market growth analysis strategies.

Customer Landscape of Gluten-free Beer Industry

Competitive Landscape

Companies are implementing various strategies, such as strategic alliances, gluten-free beer market forecast, partnerships, mergers and acquisitions, geographical expansion, and product/service launches, to enhance their presence in the industry.

ALT Brew - The portfolio includes sorghum-based gluten-free beers and gluten-reduced variants, catering to diverse dietary needs through established global brands and innovative formulations.

The industry research and growth report includes detailed analyses of the competitive landscape of the market and information about key companies, including:

  • ALT Brew
  • Anheuser Busch InBev SA NV
  • Bards Tale Beer Co.
  • Brasserie de Brunehaut SA
  • Brasseurs Du Monde
  • Brewery Rickoli
  • Burning Brothers Brewing LLC
  • Dohler GmbH
  • DSM Firmenich AG
  • Duck Foot Brewing Co.
  • Epic Brewing Co.
  • Ghostfish Brewing Co.
  • Ground Breaker Brewing
  • Holidaily Brewing Co.
  • Ipswich Ale Brewery
  • Lakefront Brewery Inc.
  • Molson Coors Beverage Co.
  • New Belgium Brewing Co. Inc.
  • New Planet Beer Co.
  • Stone Brewing Co. LLC

Qualitative and quantitative analysis of companies has been conducted to help clients understand the wider business environment as well as the strengths and weaknesses of key industry players. Data is qualitatively analyzed to categorize companies as pure play, category-focused, industry-focused, and diversified; it is quantitatively analyzed to categorize companies as dominant, leading, strong, tentative, and weak.

Recent Development and News in Gluten-free beer market

  • In November, 2024, Darling Brew launched its Break Free gluten-free lager, expanding its portfolio to cater to the health-conscious consumer segment with a product praised for its flavor and sustainable production methods.
  • In January, 2025, Kati Patang, an Indian craft beverage company, acquired a minority stake in the UK-based Chadlington Brewery to scale the production and European distribution of its saffron-infused, gluten-free lager.
  • In April, 2025, Japanese brewery Rice Hack introduced its Oryvia range, a new line of rice-based, allergen-free beers targeting urban professionals and capitalizing on the appeal of using familiar, indigenous grains.
  • In May, 2025, Anheuser-Busch InBev entered into a strategic partnership with a prominent Canadian craft producer to co-develop and market a new line of innovative sorghum-based ales for the mass market.

Dive into Technavio’s robust research methodology, blending expert interviews, extensive data synthesis, and validated models for unparalleled Gluten-free Beer Market insights. See full methodology.

Market Scope
Page number 290
Base year 2025
Historic period 2020-2024
Forecast period 2026-2030
Growth momentum & CAGR Accelerate at a CAGR of 19.4%
Market growth 2026-2030 USD 26486.6 million
Market structure Fragmented
YoY growth 2025-2026(%) 16.2%
Key countries US, Canada, Mexico, Germany, UK, France, Italy, Spain, The Netherlands, China, India, Japan, South Korea, Australia, Indonesia, Brazil, Argentina, Chile, South Africa, UAE, Turkey, Israel and Saudi Arabia
Competitive landscape Leading Companies, Market Positioning of Companies, Competitive Strategies, and Industry Risks

Request Free Sample

Research Analyst Overview

  • The market is undergoing a strategic transformation, moving beyond its origins in addressing non-celiac gluten sensitivity to become a mainstream choice for lifestyle-oriented consumers. This shift is underpinned by significant craft brewing innovation and advancements in gluten reduction technology, including sophisticated brewing enzymes and malting process alternatives.
  • A critical boardroom-level decision involves weighing the investment in a dedicated gluten-free facility, which ensures absolute cross-contamination prevention, against the operational flexibility of using enzymatic gluten removal in existing lines. The focus on sensory quality enhancement has led to the development of diverse products such as sorghum-based ale, botanical-infused beer, and low-calorie beer formulation.
  • Breweries utilizing advanced filtration methods report a 20% improvement in product consistency. The use of alternative grains like millet and quinoa, alongside developments in rice malt production and yeast strain development, is expanding the range of available allergen-free beverages.
  • Achieving gluten-free certification for these functional beverage ingredients and clean label ingredients remains a priority, reinforcing consumer trust and market position through beverage flavor profiling and high-protein grain brewing in pilot-scale brewing labs.

What are the Key Data Covered in this Gluten-free Beer Market Research and Growth Report?

  • What is the expected growth of the Gluten-free Beer Market between 2026 and 2030?

    • USD 26.49 billion, at a CAGR of 19.4%

  • What segmentation does the market report cover?

    • The report is segmented by Distribution Channel (Off-trade store, and On-trade store), Type (Sorghum corn and rice, Buckwheat, and Others), Packaging (Bottles, Cans, and Kegs) and Geography (North America, Europe, APAC, South America, Middle East and Africa)

  • Which regions are analyzed in the report?

    • North America, Europe, APAC, South America and Middle East and Africa

  • What are the key growth drivers and market challenges?

    • Growing awareness of health benefits of gluten-free food products, Restricted availability of gluten‑free brewing ingredients

  • Who are the major players in the Gluten-free Beer Market?

    • ALT Brew, Anheuser Busch InBev SA NV, Bards Tale Beer Co., Brasserie de Brunehaut SA, Brasseurs Du Monde, Brewery Rickoli, Burning Brothers Brewing LLC, Dohler GmbH, DSM Firmenich AG, Duck Foot Brewing Co., Epic Brewing Co., Ghostfish Brewing Co., Ground Breaker Brewing, Holidaily Brewing Co., Ipswich Ale Brewery, Lakefront Brewery Inc., Molson Coors Beverage Co., New Belgium Brewing Co. Inc., New Planet Beer Co. and Stone Brewing Co. LLC

Market Research Insights

  • The market's momentum is shaped by the convergence of consumer wellness goals and retail evolution. The expansion of the direct-to-consumer sales model has been a pivotal shift, with brands that leverage this channel reporting up to a 20% higher customer lifetime value compared to those relying solely on traditional distribution.
  • This strategy supports the premiumization of beverages and aligns with the demand for a transparent brewing process. Concurrently, food service inclusivity is driving on-trade channel expansion, as establishments that offer dietary friendly alternatives see a 15% increase in traffic from groups with mixed dietary needs.
  • This growth is reinforced by organized retail penetration, where clear allergen-safe recommendations and product placement boost trial rates. These dynamics transform a lifestyle beverage choice into a cornerstone of modern retail and hospitality, emphasizing the importance of a sophisticated market entry strategy.

We can help! Our analysts can customize this gluten-free beer market research report to meet your requirements.

Get in touch

1. Executive Summary

1.1 Market overview

Executive Summary - Chart on Market Overview
Executive Summary - Data Table on Market Overview
Executive Summary - Chart on Global Market Characteristics
Executive Summary - Chart on Market by Geography
Executive Summary - Chart on Market Segmentation by Distribution Channel
Executive Summary - Chart on Market Segmentation by Type
Executive Summary - Chart on Market Segmentation by Packaging
Executive Summary - Chart on Incremental Growth
Executive Summary - Data Table on Incremental Growth
Executive Summary - Chart on Company Market Positioning

2. Technavio Analysis

2.1 Analysis of price sensitivity, lifecycle, customer purchase basket, adoption rates, and purchase criteria

2.2 Criticality of inputs and Factors of differentiation

Chart on Overview on criticality of inputs and factors of differentiation

2.3 Factors of disruption

Chart on Overview on factors of disruption

2.4 Impact of drivers and challenges

Chart on Impact of drivers and challenges in 2025 and 2030

3. Market Landscape

3.1 Market ecosystem

Chart on Parent Market
Data Table on - Parent Market

3.2 Market characteristics

Chart on Market characteristics analysis

3.3 Value chain analysis

Chart on Value chain analysis

4. Market Sizing

4.1 Market definition

Data Table on Offerings of companies included in the market definition

4.2 Market segment analysis

Market segments

4.3 Market size 2025

4.4 Market outlook: Forecast for 2025-2030

Chart on Global - Market size and forecast 2025-2030 ($ million)
Data Table on Global - Market size and forecast 2025-2030 ($ million)
Chart on Global Market: Year-over-year growth 2025-2030 (%)
Data Table on Global Market: Year-over-year growth 2025-2030 (%)

5. Historic Market Size

5.1 Global Gluten-Free Beer Market 2020 - 2024

Historic Market Size - Data Table on Global Gluten-Free Beer Market 2020 - 2024 ($ million)

5.2 Distribution Channel segment analysis 2020 - 2024

Historic Market Size - Distribution Channel Segment 2020 - 2024 ($ million)

5.3 Type segment analysis 2020 - 2024

Historic Market Size - Type Segment 2020 - 2024 ($ million)

5.4 Packaging segment analysis 2020 - 2024

Historic Market Size - Packaging Segment 2020 - 2024 ($ million)

5.5 Geography segment analysis 2020 - 2024

Historic Market Size - Geography Segment 2020 - 2024 ($ million)

5.6 Country segment analysis 2020 - 2024

Historic Market Size - Country Segment 2020 - 2024 ($ million)

6. Qualitative Analysis

6.1 The AI Impact on Global Gluten-free Beer Market

7. Five Forces Analysis

7.1 Five forces summary

Five forces analysis - Comparison between 2025 and 2030

7.2 Bargaining power of buyers

Bargaining power of buyers - Impact of key factors 2025 and 2030

7.3 Bargaining power of suppliers

Bargaining power of suppliers - Impact of key factors in 2025 and 2030

7.4 Threat of new entrants

Threat of new entrants - Impact of key factors in 2025 and 2030

7.5 Threat of substitutes

Threat of substitutes - Impact of key factors in 2025 and 2030

7.6 Threat of rivalry

Threat of rivalry - Impact of key factors in 2025 and 2030

7.7 Market condition

Chart on Market condition - Five forces 2025 and 2030

8. Market Segmentation by Distribution Channel

8.1 Market segments

Chart on Distribution Channel - Market share 2025-2030 (%)
Data Table on Distribution Channel - Market share 2025-2030 (%)

8.2 Comparison by Distribution Channel

Chart on Comparison by Distribution Channel
Data Table on Comparison by Distribution Channel

8.3 Off-trade store - Market size and forecast 2025-2030

Chart on Off-trade store - Market size and forecast 2025-2030 ($ million)
Data Table on Off-trade store - Market size and forecast 2025-2030 ($ million)
Chart on Off-trade store - Year-over-year growth 2025-2030 (%)
Data Table on Off-trade store - Year-over-year growth 2025-2030 (%)

8.4 On-trade store - Market size and forecast 2025-2030

Chart on On-trade store - Market size and forecast 2025-2030 ($ million)
Data Table on On-trade store - Market size and forecast 2025-2030 ($ million)
Chart on On-trade store - Year-over-year growth 2025-2030 (%)
Data Table on On-trade store - Year-over-year growth 2025-2030 (%)

8.5 Market opportunity by Distribution Channel

Market opportunity by Distribution Channel ($ million)
Data Table on Market opportunity by Distribution Channel ($ million)

9. Market Segmentation by Type

9.1 Market segments

Chart on Type - Market share 2025-2030 (%)
Data Table on Type - Market share 2025-2030 (%)

9.2 Comparison by Type

Chart on Comparison by Type
Data Table on Comparison by Type

9.3 Sorghum corn and rice - Market size and forecast 2025-2030

Chart on Sorghum corn and rice - Market size and forecast 2025-2030 ($ million)
Data Table on Sorghum corn and rice - Market size and forecast 2025-2030 ($ million)
Chart on Sorghum corn and rice - Year-over-year growth 2025-2030 (%)
Data Table on Sorghum corn and rice - Year-over-year growth 2025-2030 (%)

9.4 Buckwheat - Market size and forecast 2025-2030

Chart on Buckwheat - Market size and forecast 2025-2030 ($ million)
Data Table on Buckwheat - Market size and forecast 2025-2030 ($ million)
Chart on Buckwheat - Year-over-year growth 2025-2030 (%)
Data Table on Buckwheat - Year-over-year growth 2025-2030 (%)

9.5 Others - Market size and forecast 2025-2030

Chart on Others - Market size and forecast 2025-2030 ($ million)
Data Table on Others - Market size and forecast 2025-2030 ($ million)
Chart on Others - Year-over-year growth 2025-2030 (%)
Data Table on Others - Year-over-year growth 2025-2030 (%)

9.6 Market opportunity by Type

Market opportunity by Type ($ million)
Data Table on Market opportunity by Type ($ million)

10. Market Segmentation by Packaging

10.1 Market segments

Chart on Packaging - Market share 2025-2030 (%)
Data Table on Packaging - Market share 2025-2030 (%)

10.2 Comparison by Packaging

Chart on Comparison by Packaging
Data Table on Comparison by Packaging

10.3 Bottles - Market size and forecast 2025-2030

Chart on Bottles - Market size and forecast 2025-2030 ($ million)
Data Table on Bottles - Market size and forecast 2025-2030 ($ million)
Chart on Bottles - Year-over-year growth 2025-2030 (%)
Data Table on Bottles - Year-over-year growth 2025-2030 (%)

10.4 Cans - Market size and forecast 2025-2030

Chart on Cans - Market size and forecast 2025-2030 ($ million)
Data Table on Cans - Market size and forecast 2025-2030 ($ million)
Chart on Cans - Year-over-year growth 2025-2030 (%)
Data Table on Cans - Year-over-year growth 2025-2030 (%)

10.5 Kegs - Market size and forecast 2025-2030

Chart on Kegs - Market size and forecast 2025-2030 ($ million)
Data Table on Kegs - Market size and forecast 2025-2030 ($ million)
Chart on Kegs - Year-over-year growth 2025-2030 (%)
Data Table on Kegs - Year-over-year growth 2025-2030 (%)

10.6 Market opportunity by Packaging

Market opportunity by Packaging ($ million)
Data Table on Market opportunity by Packaging ($ million)

11. Customer Landscape

11.1 Customer landscape overview

Analysis of price sensitivity, lifecycle, customer purchase basket, adoption rates, and purchase criteria

12. Geographic Landscape

12.1 Geographic segmentation

Chart on Market share by geography 2025-2030 (%)
Data Table on Market share by geography 2025-2030 (%)

12.2 Geographic comparison

Chart on Geographic comparison
Data Table on Geographic comparison

12.3 North America - Market size and forecast 2025-2030

Chart on North America - Market size and forecast 2025-2030 ($ million)
Data Table on North America - Market size and forecast 2025-2030 ($ million)
Chart on North America - Year-over-year growth 2025-2030 (%)
Data Table on North America - Year-over-year growth 2025-2030 (%)
Chart on Regional Comparison - North America
Data Table on Regional Comparison - North America

12.3.1 US - Market size and forecast 2025-2030

Chart on US - Market size and forecast 2025-2030 ($ million)
Data Table on US - Market size and forecast 2025-2030 ($ million)
Chart on US - Year-over-year growth 2025-2030 (%)
Data Table on US - Year-over-year growth 2025-2030 (%)

12.3.2 Canada - Market size and forecast 2025-2030

Chart on Canada - Market size and forecast 2025-2030 ($ million)
Data Table on Canada - Market size and forecast 2025-2030 ($ million)
Chart on Canada - Year-over-year growth 2025-2030 (%)
Data Table on Canada - Year-over-year growth 2025-2030 (%)

12.3.3 Mexico - Market size and forecast 2025-2030

Chart on Mexico - Market size and forecast 2025-2030 ($ million)
Data Table on Mexico - Market size and forecast 2025-2030 ($ million)
Chart on Mexico - Year-over-year growth 2025-2030 (%)
Data Table on Mexico - Year-over-year growth 2025-2030 (%)

12.4 Europe - Market size and forecast 2025-2030

Chart on Europe - Market size and forecast 2025-2030 ($ million)
Data Table on Europe - Market size and forecast 2025-2030 ($ million)
Chart on Europe - Year-over-year growth 2025-2030 (%)
Data Table on Europe - Year-over-year growth 2025-2030 (%)
Chart on Regional Comparison - Europe
Data Table on Regional Comparison - Europe

12.4.1 Germany - Market size and forecast 2025-2030

Chart on Germany - Market size and forecast 2025-2030 ($ million)
Data Table on Germany - Market size and forecast 2025-2030 ($ million)
Chart on Germany - Year-over-year growth 2025-2030 (%)
Data Table on Germany - Year-over-year growth 2025-2030 (%)

12.4.2 UK - Market size and forecast 2025-2030

Chart on UK - Market size and forecast 2025-2030 ($ million)
Data Table on UK - Market size and forecast 2025-2030 ($ million)
Chart on UK - Year-over-year growth 2025-2030 (%)
Data Table on UK - Year-over-year growth 2025-2030 (%)

12.4.3 France - Market size and forecast 2025-2030

Chart on France - Market size and forecast 2025-2030 ($ million)
Data Table on France - Market size and forecast 2025-2030 ($ million)
Chart on France - Year-over-year growth 2025-2030 (%)
Data Table on France - Year-over-year growth 2025-2030 (%)

12.4.4 Italy - Market size and forecast 2025-2030

Chart on Italy - Market size and forecast 2025-2030 ($ million)
Data Table on Italy - Market size and forecast 2025-2030 ($ million)
Chart on Italy - Year-over-year growth 2025-2030 (%)
Data Table on Italy - Year-over-year growth 2025-2030 (%)

12.4.5 Spain - Market size and forecast 2025-2030

Chart on Spain - Market size and forecast 2025-2030 ($ million)
Data Table on Spain - Market size and forecast 2025-2030 ($ million)
Chart on Spain - Year-over-year growth 2025-2030 (%)
Data Table on Spain - Year-over-year growth 2025-2030 (%)

12.4.6 The Netherlands - Market size and forecast 2025-2030

Chart on The Netherlands - Market size and forecast 2025-2030 ($ million)
Data Table on The Netherlands - Market size and forecast 2025-2030 ($ million)
Chart on The Netherlands - Year-over-year growth 2025-2030 (%)
Data Table on The Netherlands - Year-over-year growth 2025-2030 (%)

12.5 APAC - Market size and forecast 2025-2030

Chart on APAC - Market size and forecast 2025-2030 ($ million)
Data Table on APAC - Market size and forecast 2025-2030 ($ million)
Chart on APAC - Year-over-year growth 2025-2030 (%)
Data Table on APAC - Year-over-year growth 2025-2030 (%)
Chart on Regional Comparison - APAC
Data Table on Regional Comparison - APAC

12.5.1 China - Market size and forecast 2025-2030

Chart on China - Market size and forecast 2025-2030 ($ million)
Data Table on China - Market size and forecast 2025-2030 ($ million)
Chart on China - Year-over-year growth 2025-2030 (%)
Data Table on China - Year-over-year growth 2025-2030 (%)

12.5.2 India - Market size and forecast 2025-2030

Chart on India - Market size and forecast 2025-2030 ($ million)
Data Table on India - Market size and forecast 2025-2030 ($ million)
Chart on India - Year-over-year growth 2025-2030 (%)
Data Table on India - Year-over-year growth 2025-2030 (%)

12.5.3 Japan - Market size and forecast 2025-2030

Chart on Japan - Market size and forecast 2025-2030 ($ million)
Data Table on Japan - Market size and forecast 2025-2030 ($ million)
Chart on Japan - Year-over-year growth 2025-2030 (%)
Data Table on Japan - Year-over-year growth 2025-2030 (%)

12.5.4 South Korea - Market size and forecast 2025-2030

Chart on South Korea - Market size and forecast 2025-2030 ($ million)
Data Table on South Korea - Market size and forecast 2025-2030 ($ million)
Chart on South Korea - Year-over-year growth 2025-2030 (%)
Data Table on South Korea - Year-over-year growth 2025-2030 (%)

12.5.5 Australia - Market size and forecast 2025-2030

Chart on Australia - Market size and forecast 2025-2030 ($ million)
Data Table on Australia - Market size and forecast 2025-2030 ($ million)
Chart on Australia - Year-over-year growth 2025-2030 (%)
Data Table on Australia - Year-over-year growth 2025-2030 (%)

12.5.6 Indonesia - Market size and forecast 2025-2030

Chart on Indonesia - Market size and forecast 2025-2030 ($ million)
Data Table on Indonesia - Market size and forecast 2025-2030 ($ million)
Chart on Indonesia - Year-over-year growth 2025-2030 (%)
Data Table on Indonesia - Year-over-year growth 2025-2030 (%)

12.6 South America - Market size and forecast 2025-2030

Chart on South America - Market size and forecast 2025-2030 ($ million)
Data Table on South America - Market size and forecast 2025-2030 ($ million)
Chart on South America - Year-over-year growth 2025-2030 (%)
Data Table on South America - Year-over-year growth 2025-2030 (%)
Chart on Regional Comparison - South America
Data Table on Regional Comparison - South America

12.6.1 Brazil - Market size and forecast 2025-2030

Chart on Brazil - Market size and forecast 2025-2030 ($ million)
Data Table on Brazil - Market size and forecast 2025-2030 ($ million)
Chart on Brazil - Year-over-year growth 2025-2030 (%)
Data Table on Brazil - Year-over-year growth 2025-2030 (%)

12.6.2 Argentina - Market size and forecast 2025-2030

Chart on Argentina - Market size and forecast 2025-2030 ($ million)
Data Table on Argentina - Market size and forecast 2025-2030 ($ million)
Chart on Argentina - Year-over-year growth 2025-2030 (%)
Data Table on Argentina - Year-over-year growth 2025-2030 (%)

12.6.3 Chile - Market size and forecast 2025-2030

Chart on Chile - Market size and forecast 2025-2030 ($ million)
Data Table on Chile - Market size and forecast 2025-2030 ($ million)
Chart on Chile - Year-over-year growth 2025-2030 (%)
Data Table on Chile - Year-over-year growth 2025-2030 (%)

12.7 Middle East and Africa - Market size and forecast 2025-2030

Chart on Middle East and Africa - Market size and forecast 2025-2030 ($ million)
Data Table on Middle East and Africa - Market size and forecast 2025-2030 ($ million)
Chart on Middle East and Africa - Year-over-year growth 2025-2030 (%)
Data Table on Middle East and Africa - Year-over-year growth 2025-2030 (%)
Chart on Regional Comparison - Middle East and Africa
Data Table on Regional Comparison - Middle East and Africa

12.7.1 South Africa - Market size and forecast 2025-2030

Chart on South Africa - Market size and forecast 2025-2030 ($ million)
Data Table on South Africa - Market size and forecast 2025-2030 ($ million)
Chart on South Africa - Year-over-year growth 2025-2030 (%)
Data Table on South Africa - Year-over-year growth 2025-2030 (%)

12.7.2 UAE - Market size and forecast 2025-2030

Chart on UAE - Market size and forecast 2025-2030 ($ million)
Data Table on UAE - Market size and forecast 2025-2030 ($ million)
Chart on UAE - Year-over-year growth 2025-2030 (%)
Data Table on UAE - Year-over-year growth 2025-2030 (%)

12.7.3 Turkey - Market size and forecast 2025-2030

Chart on Turkey - Market size and forecast 2025-2030 ($ million)
Data Table on Turkey - Market size and forecast 2025-2030 ($ million)
Chart on Turkey - Year-over-year growth 2025-2030 (%)
Data Table on Turkey - Year-over-year growth 2025-2030 (%)

12.7.4 Israel - Market size and forecast 2025-2030

Chart on Israel - Market size and forecast 2025-2030 ($ million)
Data Table on Israel - Market size and forecast 2025-2030 ($ million)
Chart on Israel - Year-over-year growth 2025-2030 (%)
Data Table on Israel - Year-over-year growth 2025-2030 (%)

12.7.5 Saudi Arabia - Market size and forecast 2025-2030

Chart on Saudi Arabia - Market size and forecast 2025-2030 ($ million)
Data Table on Saudi Arabia - Market size and forecast 2025-2030 ($ million)
Chart on Saudi Arabia - Year-over-year growth 2025-2030 (%)
Data Table on Saudi Arabia - Year-over-year growth 2025-2030 (%)

12.8 Market opportunity by geography

Market opportunity by geography ($ million)
Data Tables on Market opportunity by geography ($ million)

13. Drivers, Challenges, and Opportunity

13.1 Market drivers

Growing awareness of health benefits of gluten-free food products
Increasing demand for and accessibility of gluten-free beer due to organized retailing
Rising number of new and innovative product launches

13.2 Market challenges

Restricted availability of gluten‑free brewing ingredients
Strict regulatory standards complicate product development
Increasing competition from conventional beer and other alcoholic beverages

13.3 Impact of drivers and challenges

Impact of drivers and challenges in 2025 and 2030

13.4 Market opportunities

Growing influence of online retailing
Adoption of innovative techniques and use of new ingredients
Craft breweries rapidly expanding gluten‑free offerings

14. Competitive Landscape

14.1 Overview

14.2

Overview on criticality of inputs and factors of differentiation

14.3 Landscape disruption

Overview on factors of disruption

14.4 Industry risks

Impact of key risks on business

15. Competitive Analysis

15.1 Companies profiled

Companies covered

15.2 Company ranking index

15.3 Market positioning of companies

Matrix on companies position and classification

15.4 ALT Brew

ALT Brew - Overview
ALT Brew - Product / Service
ALT Brew - Key offerings
SWOT

15.5 Anheuser Busch InBev SA NV

Anheuser Busch InBev SA NV - Overview
Anheuser Busch InBev SA NV - Business segments
Anheuser Busch InBev SA NV - Key offerings
Anheuser Busch InBev SA NV - Segment focus
SWOT

15.6 Bards Tale Beer Co.

Bards Tale Beer Co. - Overview
Bards Tale Beer Co. - Product / Service
Bards Tale Beer Co. - Key offerings
SWOT

15.7 Brasserie de Brunehaut SA

Brasserie de Brunehaut SA - Overview
Brasserie de Brunehaut SA - Product / Service
Brasserie de Brunehaut SA - Key offerings
SWOT

15.8 Brasseurs Du Monde

Brasseurs Du Monde - Overview
Brasseurs Du Monde - Product / Service
Brasseurs Du Monde - Key offerings
SWOT

15.9 Brewery Rickoli

Brewery Rickoli - Overview
Brewery Rickoli - Product / Service
Brewery Rickoli - Key offerings
SWOT

15.10 Burning Brothers Brewing LLC

Burning Brothers Brewing LLC - Overview
Burning Brothers Brewing LLC - Product / Service
Burning Brothers Brewing LLC - Key offerings
SWOT

15.11 Dohler GmbH

Dohler GmbH - Overview
Dohler GmbH - Product / Service
Dohler GmbH - Key offerings
SWOT

15.12 DSM Firmenich AG

DSM Firmenich AG - Overview
DSM Firmenich AG - Business segments
DSM Firmenich AG - Key offerings
DSM Firmenich AG - Segment focus
SWOT

15.13 Duck Foot Brewing Co.

Duck Foot Brewing Co. - Overview
Duck Foot Brewing Co. - Product / Service
Duck Foot Brewing Co. - Key offerings
SWOT

15.14 Epic Brewing Co.

Epic Brewing Co. - Overview
Epic Brewing Co. - Product / Service
Epic Brewing Co. - Key offerings
SWOT

15.15 Ground Breaker Brewing

Ground Breaker Brewing - Overview
Ground Breaker Brewing - Product / Service
Ground Breaker Brewing - Key offerings
SWOT

15.16 Lakefront Brewery Inc.

Lakefront Brewery Inc. - Overview
Lakefront Brewery Inc. - Product / Service
Lakefront Brewery Inc. - Key offerings
SWOT

15.17 Molson Coors Beverage Co.

Molson Coors Beverage Co. - Overview
Molson Coors Beverage Co. - Business segments
Molson Coors Beverage Co. - Key news
Molson Coors Beverage Co. - Key offerings
Molson Coors Beverage Co. - Segment focus
SWOT

15.18 New Belgium Brewing Co. Inc.

New Belgium Brewing Co. Inc. - Overview
New Belgium Brewing Co. Inc. - Product / Service
New Belgium Brewing Co. Inc. - Key offerings
SWOT

16. Appendix

16.1 Scope of the report

Market definition
Objectives
Notes and caveats

16.2 Inclusions and exclusions checklist

Inclusions checklist
Exclusions checklist

16.3 Currency conversion rates for US$

16.4 Research methodology

16.5 Data procurement

Information sources

16.6 Data validation

16.7 Validation techniques employed for market sizing

16.8 Data synthesis

16.9 360 degree market analysis

16.10 List of abbreviations

Research Methodology

Technavio presents a detailed picture of the market by way of study, synthesis, and summation of data from multiple sources. The analysts have presented the various facets of the market with a particular focus on identifying the key industry influencers. The data thus presented is comprehensive, reliable, and the result of extensive research, both primary and secondary.

INFORMATION SOURCES

Primary sources

  • Manufacturers and suppliers
  • Channel partners
  • Industry experts
  • Strategic decision makers

Secondary sources

  • Industry journals and periodicals
  • Government data
  • Financial reports of key industry players
  • Historical data
  • Press releases

DATA ANALYSIS

Data Synthesis

  • Collation of data
  • Estimation of key figures
  • Analysis of derived insights

Data Validation

  • Triangulation with data models
  • Reference against proprietary databases
  • Corroboration with industry experts

REPORT WRITING

Qualitative

  • Market drivers
  • Market challenges
  • Market trends
  • Five forces analysis

Quantitative

  • Market size and forecast
  • Market segmentation
  • Geographical insights
  • Competitive landscape

Interested in this report?

Get your sample now to see our research methodology and insights!

Download Now

Frequently Asked Questions

Gluten-free Beer market growth will increase by USD 26486.6 million during 2026-2030.

The Gluten-free Beer market is expected to grow at a CAGR of 19.4% during 2026-2030.

Gluten-free Beer market is segmented by Distribution channel (Off-trade store, On-trade store) Type (Sorghum corn and rice, Buckwheat, Others) Packaging (Bottles, Cans, Kegs)

ALT Brew, Anheuser Busch InBev SA NV, Bards Tale Beer Co., Brasserie de Brunehaut SA, Brasseurs Du Monde, Brewery Rickoli, Burning Brothers Brewing LLC, Dohler GmbH, DSM Firmenich AG, Duck Foot Brewing Co., Epic Brewing Co., Ghostfish Brewing Co., Ground Breaker Brewing, Holidaily Brewing Co., Ipswich Ale Brewery, Lakefront Brewery Inc., Molson Coors Beverage Co., New Belgium Brewing Co. Inc., New Planet Beer Co., Stone Brewing Co. LLC are a few of the key vendors in the Gluten-free Beer market.

North America will register the highest growth rate of 39.8% among the other regions. Therefore, the Gluten-free Beer market in North America is expected to garner significant business opportunities for the vendors during the forecast period.

US, Canada, Mexico, Germany, UK, France, Italy, Spain, The Netherlands, China, India, Japan, South Korea, Australia, Indonesia, Brazil, Argentina, Chile, South Africa, UAE, Turkey, Israel, Saudi Arabia

  • Growing awareness of health benefits of gluten-free food products is the driving factor this market.

The Gluten-free Beer market vendors should focus on grabbing business opportunities from the Distribution channel segment as it accounted for the largest market share in the base year.
RIA - Research AI Assistant
Ask RIA