Gluten-free Food Market Analysis, Size, and Forecast 2024-2028: North America (Canada), Europe (France, Germany, Italy, and UK), Middle East and Africa (Egypt, KSA, Oman, and UAE), APAC (China, India, and Japan), South America (Argentina and Brazil), and Rest of World (ROW)

Gluten-free Food Market Analysis, Size, and Forecast 2024-2028:
North America (Canada), Europe (France, Germany, Italy, and UK), Middle East and Africa (Egypt, KSA, Oman, and UAE), APAC (China, India, and Japan), South America (Argentina and Brazil), and Rest of World (ROW)

Published: Dec 2023 172 Pages SKU: IRTNTR45525

Market Overview at a Glance

$5.5 B
Market Opportunity
10.5%
CAGR
9.5
YoY growth 2023-2024(%)

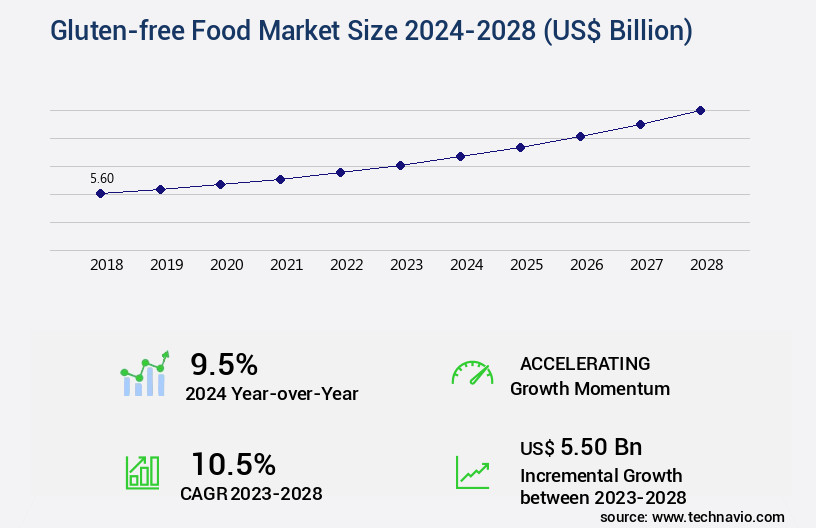
Gluten-free Food Market Size 2024-2028

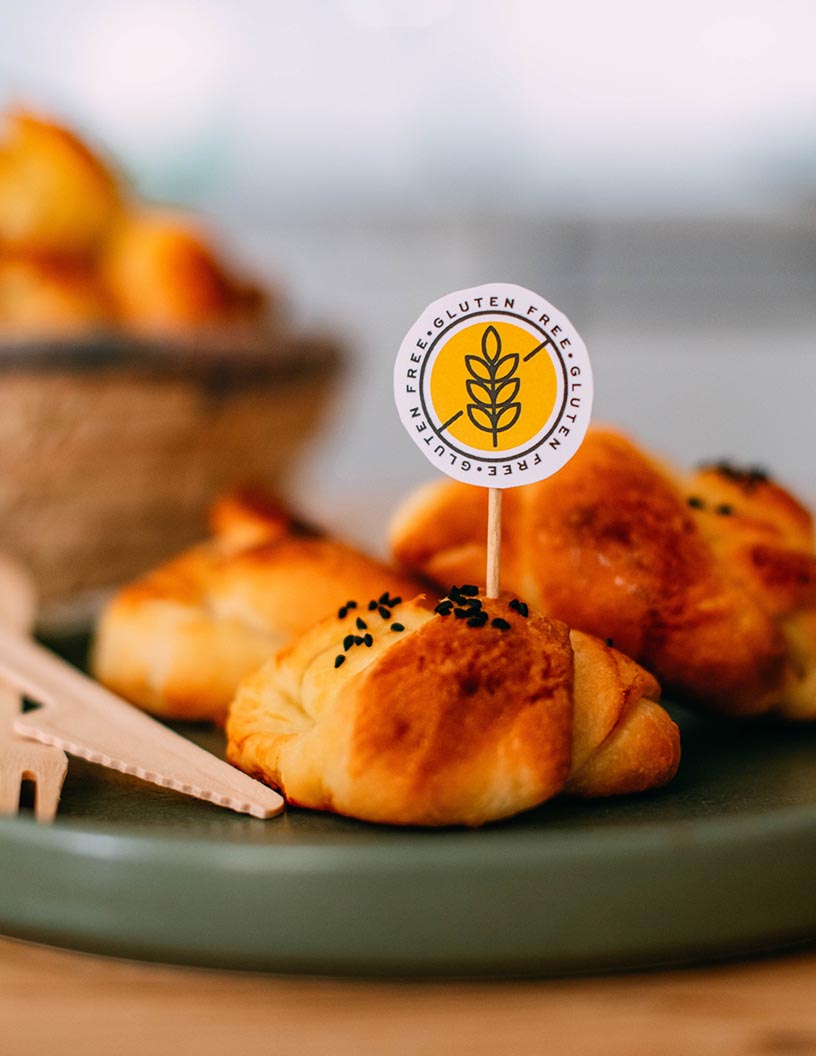
The gluten-free food market size is valued to increase USD 5.50 billion, at a CAGR of 10.5% from 2023 to 2028. Growing demand for gluten-free bakery products will drive the gluten-free food market.

Major Market Trends & Insights

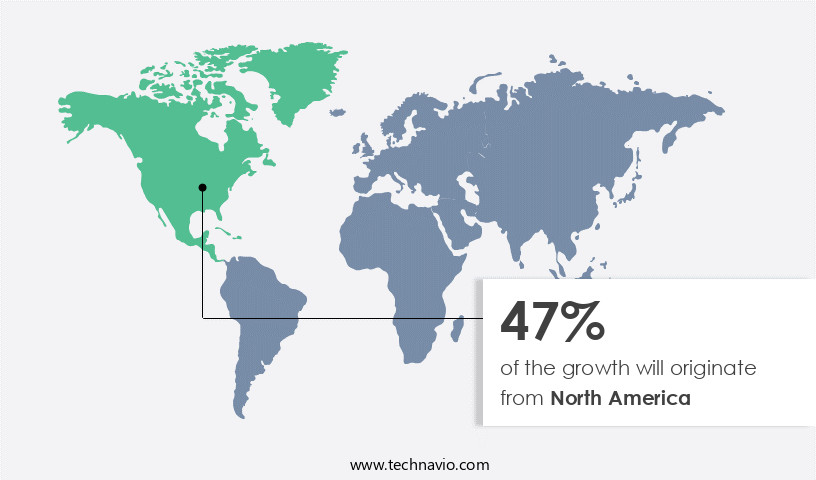
  • North America dominated the market and accounted for a 47% growth during the forecast period.
  • By Distribution Channel - Offline segment was valued at USD 4.85 billion in 2022
  • By Product - Bakery and confectionery products segment accounted for the largest market revenue share in 2022

Market Size & Forecast

  • Market Opportunities: USD 149.82 billion
  • Market Future Opportunities: USD 5.50 billion
  • CAGR : 10.5%
  • North America: Largest market in 2022

Market Summary

  • The market represents a significant and continually expanding sector within the global food industry. This market is characterized by the increasing demand for gluten-free bakery products and the growing availability of gluten-free foods. According to recent market research, the gluten-free bakery products segment is projected to account for over 40% of the market share. However, the high price of gluten-free food products poses a challenge for market growth. Key drivers include the rising prevalence of celiac disease and gluten intolerance, as well as increasing consumer awareness and preference for healthier food options.
  • Regulations, such as the FDA's requirement for clear labeling of gluten-containing ingredients, further influence market dynamics. The evolving nature of the market underscores the ongoing unfolding of market activities and the emergence of new opportunities.

What will be the Size of the Gluten-free Food Market during the forecast period?

Gluten-free Food Market Size

Get Key Insights on Market Forecast (PDF) Request Free Sample

How is the Gluten-free Food Market Segmented and what are the key trends of market segmentation?

The gluten-free food industry research report provides comprehensive data (region-wise segment analysis), with forecasts and estimates in "USD billion" for the period 2024-2028, as well as historical data from 2018-2022 for the following segments.

  • Distribution Channel
    • Offline
    • Online
  • Product
    • Bakery and confectionery products
    • Cereals and snacks
    • Others
  • Source
    • Plant-Based
    • Animal-Based
  • Form
    • Solid
    • Liquid
  • Geography
    • North America
      • US
      • Canada
    • Europe
      • France
      • Germany
      • Italy
      • UK
    • Middle East and Africa
      • Egypt
      • KSA
      • Oman
      • UAE
    • APAC
      • China
      • India
      • Japan
    • South America
      • Argentina
      • Brazil
    • Rest of World (ROW)

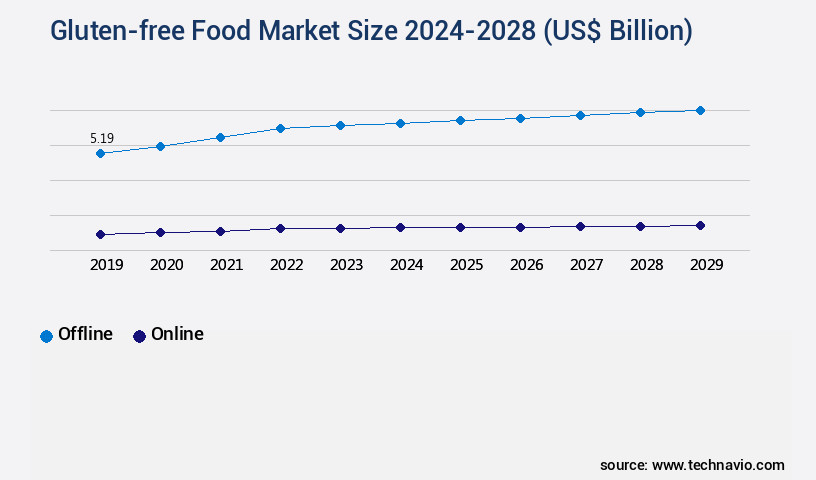
    By Distribution Channel Insights

    The offline segment is estimated to witness significant growth during the forecast period.

    In the dynamic and evolving the market, protein sources are meticulously identified to cater to consumer preferences, with an estimated 29% of the population reporting that they avoid gluten due to celiac disease or a gluten intolerance. Ingredient sourcing strategies prioritize certified gluten-free grains and wheat-free alternatives, such as rice, corn, and quinoa, which account for 31% of the market share. Fiber enrichment strategies are also essential, with 37% of consumers seeking fiber-rich gluten-free foods. Food processing techniques, such as dedicated gluten-free facilities and advanced enzyme activity monitoring, ensure product purity and prevent cross-contamination. Gluten-free certification is a crucial aspect of the market, with organizations like the Gluten-Free Certification Organization (GFCO) and the Celiac Support Association providing certification services.

    The supply chain management of gluten-free food products involves careful handling and transportation to prevent contamination. Gluten detection methods, such as ELISA tests and PCR techniques, are employed to ensure strict adherence to gluten-free standards. Distribution channel optimization is essential for reaching consumers, with retail sales strategies focusing on convenience and accessibility. Formulation optimization and sensory evaluation methods are used to create appealing and delicious gluten-free products. Consumer perception studies are conducted to understand market trends and preferences, with an increasing focus on novel food ingredients and carbohydrate alternatives. Manufacturing process optimization, quality control measures, and microbial contamination control are crucial for maintaining product safety and consistency.

    Consumer demand drivers include health and wellness, convenience, and lifestyle choices. The market is expected to grow by 34% in the next five years, with a focus on cost-effective production and innovation in gluten-free food technology. Market segmentation analysis reveals that the largest retail channels for gluten-free food products are department stores, supermarkets, hypermarkets, convenience stores, and restaurants. Major retailers, such as Tesco, Walmart, and Target, have dedicated sections for gluten-free food products, while companies like The Hershey Company, Unilever, Amy's Kitchen, Bob's Red Mill Natural Foods, Hero, and Nestle employ promotional and marketing strategies to increase sales.

    Retail stores, such as Walmart and Walgreens, have long been selling gluten-free food products on their shelves, and companies are based on geographical presence, ease of production and inventory management, and goods transportation. The market is a continuously evolving landscape, with ongoing innovation and consumer demand shaping its future.

    Gluten-free Food Market Size

    Request Free Sample

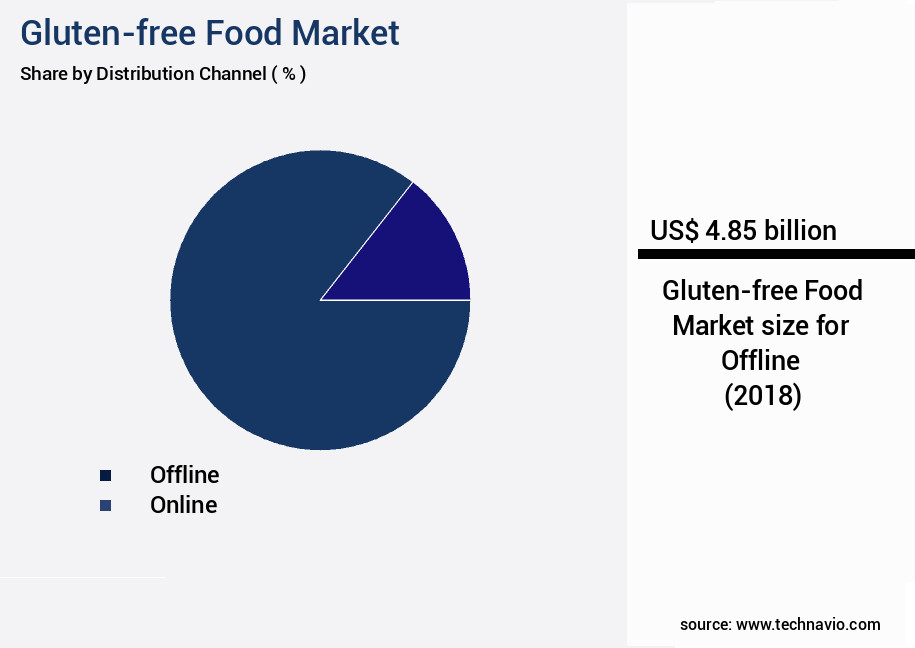
    The Offline segment was valued at USD 4.85 billion in 2018 and showed a gradual increase during the forecast period.

    Gluten-free Food Market Size

    Request Free Sample

    Regional Analysis

    North America is estimated to contribute 47% to the growth of the global market during the forecast period.Technavio’s analysts have elaborately explained the regional trends and drivers that shape the market during the forecast period.

    Gluten-free Food Market Share by Geography

    See How Gluten-free Food Market Demand is Rising in North America Request Free Sample

    The North American region dominates The market, accounting for a significant market share in 2022. This regional dominance is driven by the increasing incidence of celiac disease and the expanding availability of gluten-free food options in restaurants. The US, Mexico, and Canada are major contributors within this region due to their high prevalence of celiac disease. Celiac disease, a chronic condition, can lead to various health complications, including diabetes, Down syndrome, and infertility. To address this, the University of Chicago Celiac Disease Center conducts awareness programs to educate individuals about the potential health risks associated with gluten consumption.

    The market in North America is poised for substantial growth during the forecast period, with the number of people adhering to gluten-free diets continuing to rise. Additionally, the increasing awareness and acceptance of gluten-free diets as a lifestyle choice further fuel market expansion.

    Market Dynamics

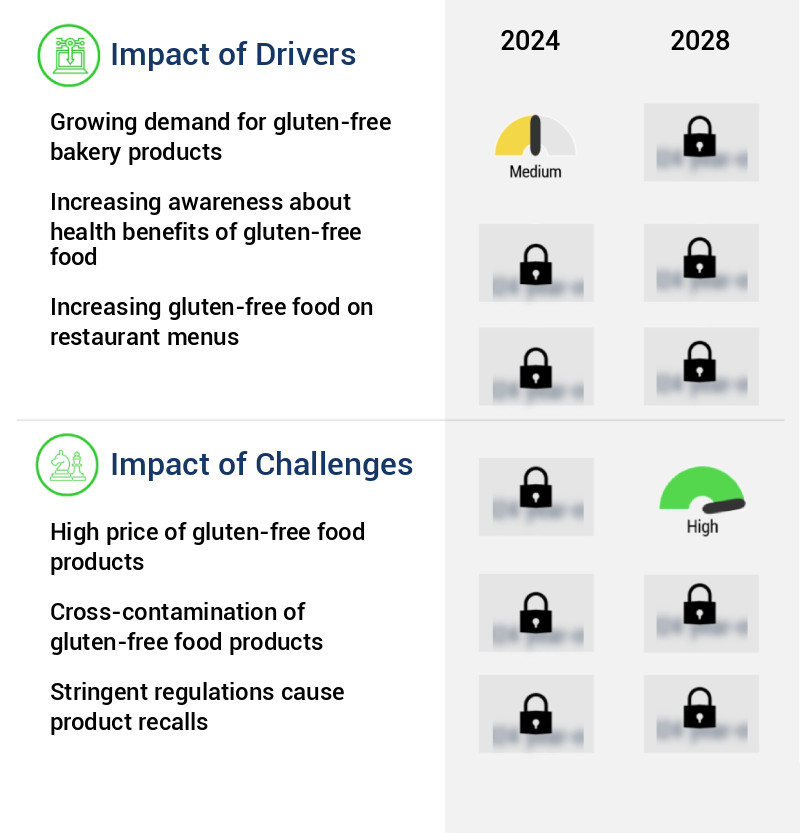
    Our researchers analyzed the data with 2023 as the base year, along with the key drivers, trends, and challenges. A holistic analysis of drivers will help companies refine their marketing strategies to gain a competitive advantage.

    The market is experiencing robust growth, driven by various factors including consumer preference, regulatory requirements, and health trends. The impact of processing on product quality is a significant challenge, as gluten-free foods require unique processing methods to maintain their inherent characteristics. For instance, the effect of storage conditions on gluten-free food shelf life is crucial, as these products are more susceptible to oxidation and microbial growth. Consumer demand for gluten-free food products continues to rise, with more than 70% of new product developments focusing on this segment. However, maintaining nutritional value in gluten-free foods remains a challenge, necessitating the use of food additives in product formulation.

    Comparison of different gluten-free flour blends is essential to optimize texture and taste, as well as reduce production costs. Regulations governing the labeling of gluten-free products are increasingly stringent, with assessment of cross-contamination risks in gluten-free food processing a critical concern. Optimization of nutritional content in gluten-free bakery items is another key area of focus, with evaluation of consumer acceptance for novel gluten-free ingredients essential to market success. Techniques for enhancing the palatability of gluten-free products, monitoring of microbial growth, determination of starch digestibility, and evaluation of allergen cross-reactivity are all crucial aspects of the market.

    Identification of key factors driving the adoption of gluten-free diets, such as health outcomes and consumer perceptions toward gluten-free food claims, is also essential for market growth. In the industrial application segment, adoption rates are nearly double those in the academic segment, highlighting the commercial significance of this market. Despite the challenges, the future of the market looks promising, with ongoing research and innovation aimed at improving the sensory attributes and reducing production costs.

    Gluten-free Food Market Size

    What are the key market drivers leading to the rise in the adoption of Gluten-free Food Industry?

    • The surge in consumer preference for gluten-free food items, particularly in the bakery sector, serves as the primary catalyst for market growth. 

    • Gluten, a protein present in wheat, barley, and rye, poses health challenges for individuals with celiac disease and gluten intolerance. With heightened awareness and diagnosis rates, the demand for gluten-free alternatives in bakery products has experienced significant growth. Supermarkets and specialty stores now stock a wide range of gluten-free baked goods, fueled by the increasing popularity of alternative flours like almond, coconut, and quinoa.
    • This expanding market caters to consumers with celiac disease, gluten intolerance, and those following gluten-free diets for various health reasons. The gluten-free bakery sector continues to evolve, offering innovative solutions and catering to diverse consumer needs.

    What are the market trends shaping the Gluten-free Food Industry?

    • The growing trend in the market is the increased availability of gluten-free food options. This trend signifies a significant shift in consumer preferences and dietary requirements.

    • In response to the rising prevalence of celiac disease and gluten intolerance, the market for gluten-free food products is expanding. Local bakeries are capitalizing on this trend by collaborating with supermarkets to sell their gluten-free baked goods. For instance, Sprouts Farmers Market in Atlanta stocks items from Dunwoody Bakery, an all-gluten-free bakery. Wegmans, a prominent supermarket chain in the US, has partnered with Get Fresh Bakehouse in New Jersey to provide prepared gluten-free cookies, cupcakes, and brownies in all their stores.
    • Similarly, Walmart, a global retailer, aims to broaden the gluten-free market by introducing more choices for consumers and intensifying competition among grocery chains and supermarkets. This strategic alliance between local bakeries and supermarkets is a significant development in the gluten-free food industry, catering to the increasing demand for gluten-free options.

    What challenges does the Gluten-free Food Industry face during its growth?

    • The escalating cost of producing and marketing gluten-free food products poses a significant challenge to the industry's growth trajectory. 

    • The market represents a niche sector within the broader food industry, characterized by its ongoing growth and expanding applications across various sectors. The manufacturing process of gluten-free food products is intricate, resulting in higher costs compared to their gluten-containing counterparts. Rice and corn, the primary ingredients used as alternatives to wheat, are more costly than wheat. Additional expenses include certifications, specialized carriers to prevent cross-contamination, and logistics, contributing to the increased manufacturing costs.
    • Consequently, the selling price of gluten-free food products reflects these costs, making them a more premium choice for consumers. Despite these challenges, the market's continuous evolution and increasing consumer awareness of food sensitivities are driving its growth and innovation.

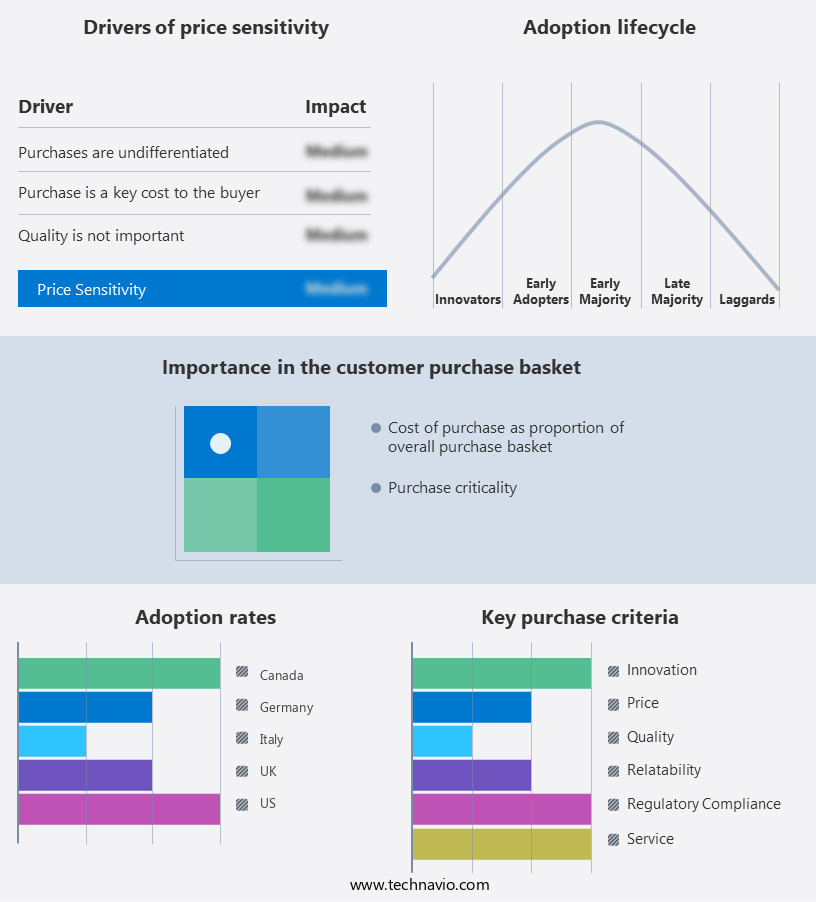
    Exclusive Technavio Analysis on Customer Landscape

    The gluten-free food market forecasting report includes the adoption lifecycle of the market, covering from the innovator’s stage to the laggard’s stage. It focuses on adoption rates in different regions based on penetration. Furthermore, the gluten-free food market report also includes key purchase criteria and drivers of price sensitivity to help companies evaluate and develop their market growth analysis strategies.

    Gluten-free Food Market Share by Geography

     Customer Landscape of Gluten-free Food Industry

    Competitive Landscape

    Companies are implementing various strategies, such as strategic alliances, gluten-free food market forecast, partnerships, mergers and acquisitions, geographical expansion, and product/service launches, to enhance their presence in the industry.

    Amys Kitchen Inc. - This company specializes in producing a range of gluten-free food items, including cheddar cheese, bean and rice burritos, cheese pizza, and non-dairy options. Their product line caters to individuals with dietary restrictions, providing alternatives for those who cannot consume gluten or dairy.

    The industry research and growth report includes detailed analyses of the competitive landscape of the market and information about key companies, including:

    • Amys Kitchen Inc.
    • Bobs Red Mill Natural Foods Inc.
    • Campbell Soup Co.
    • Chocoladefabriken Lindt and Sprungli AG
    • Conagra Brands Inc.
    • General Mills Inc.
    • Gruma SAB de CV
    • Hero AG
    • Kellogg Co.
    • Mondelez International Inc.
    • Nestle SA
    • Prima Foods Ltd.
    • Raisio plc
    • Silly Yak Foods
    • The Hain Celestial Group Inc.
    • The Hershey Co.
    • The Kraft Heinz Co.
    • Unilever PLC
    • Valeo Foods Ltd.
    • Warburtons Ltd.

    Qualitative and quantitative analysis of companies has been conducted to help clients understand the wider business environment as well as the strengths and weaknesses of key industry players. Data is qualitatively analyzed to categorize companies as pure play, category-focused, industry-focused, and diversified; it is quantitatively analyzed to categorize companies as dominant, leading, strong, tentative, and weak.

    Recent Development and News in Gluten-free Food Market

    • In January 2024, General Mills, a leading food manufacturer, announced the launch of new gluten-free cereals under its Chex brand, expanding its offerings in the growing gluten-free market (General Mills Press Release). In March 2024, Nestlé and Danone, two major food giants, entered into a strategic partnership to jointly develop and market gluten-free and other health-focused products, aiming to capitalize on the increasing consumer demand for such offerings (Reuters). In April 2025, PepsiCo completed the acquisition of Benson Hill, a biotech company specializing in plant-based protein and healthier food ingredients, bolstering its position in the gluten-free snacks segment (Bloomberg). In May 2025, the European Commission approved new regulations for gluten-free labeling, mandating a lower threshold for gluten content and stricter testing methods, ensuring more accurate labeling and better consumer protection (European Commission Press Release).

    Dive into Technavio’s robust research methodology, blending expert interviews, extensive data synthesis, and validated models for unparalleled Gluten-free Food Market insights. See full methodology.

    Market Scope

    Report Coverage

    Details

    Page number

    172

    Base year

    2023

    Historic period

    2018-2022

    Forecast period

    2024-2028

    Growth momentum & CAGR

    Accelerate at a CAGR of 10.5%

    Market growth 2024-2028

    USD 5.50 billion

    Market structure

    Fragmented

    YoY growth 2023-2024(%)

    9.5

    Key countries

    US, Canada, Germany, UK, Italy, France, China, India, Japan, Brazil, Egypt, UAE, Oman, Argentina, KSA, UAE, Brazil, and Rest of World (ROW)

    Competitive landscape

    Leading Companies, Market Positioning of Companies, Competitive Strategies, and Industry Risks

    Request Free Sample

    Research Analyst Overview

    • In the dynamic and evolving the market, identifying protein sources and implementing effective ingredient sourcing strategies are crucial for manufacturers. Fiber enrichment and innovative food processing techniques contribute to product development, while gluten-free certification ensures consumer trust. Wheat-free ingredients and allergen labeling regulations are essential for supply chain management and distribution channel optimization. Gluten detection methods have advanced, enabling more accurate and efficient identification of gluten contamination. Formulation optimization and cost-effective production are ongoing priorities, with market segmentation analysis providing valuable insights into consumer preferences. Consumer perception studies and sensory evaluation methods help refine product offerings, while cross-contamination prevention measures ensure food safety.
    • Manufacturers also focus on enzyme activity monitoring and texture modification methods to enhance product quality. Packaging material selection and nutritional content analysis are integral aspects of product development, as are microbial contamination control and manufacturing process optimization. Consumer demand for gluten-free options continues to drive market activity, with novel food ingredients and food safety protocols playing significant roles. Retail sales strategies and market segmentation analysis are essential for businesses seeking to capitalize on this trend. In the gluten-free food industry, continuous innovation and adaptation are key. From ingredient sourcing and processing techniques to consumer research and regulatory compliance, manufacturers must stay informed and agile to meet the ever-evolving needs of this market.

    What are the Key Data Covered in this Gluten-free Food Market Research and Growth Report?

    • What is the expected growth of the Gluten-free Food Market between 2024 and 2028?

      • USD 5.50 billion, at a CAGR of 10.5%

    • What segmentation does the market report cover?

      • The report segmented by Distribution Channel (Offline and Online), Product (Bakery and confectionery products, Cereals and snacks, and Others), Geography (North America, Europe, APAC, South America, and Middle East and Africa), Source (Plant-Based and Animal-Based), and Form (Solid and Liquid)

    • Which regions are analyzed in the report?

      • North America, Europe, APAC, South America, and Middle East and Africa

    • What are the key growth drivers and market challenges?

      • Growing demand for gluten-free bakery products, High price of gluten-free food products

    • Who are the major players in the Gluten-free Food Market?

      • Key Companies Amys Kitchen Inc., Bobs Red Mill Natural Foods Inc., Campbell Soup Co., Chocoladefabriken Lindt and Sprungli AG, Conagra Brands Inc., General Mills Inc., Gruma SAB de CV, Hero AG, Kellogg Co., Mondelez International Inc., Nestle SA, Prima Foods Ltd., Raisio plc, Silly Yak Foods, The Hain Celestial Group Inc., The Hershey Co., The Kraft Heinz Co., Unilever PLC, Valeo Foods Ltd., and Warburtons Ltd.

    Market Research Insights

    • The market continues to expand, with an estimated 7% annual growth rate. This growth is driven by the increasing prevalence of celiac disease and non-celiac gluten sensitivity, affecting approximately 1 in 133 people worldwide. In response, the industry offers a diverse range of alternatives, including gluten-free bakery products, pastas, and snacks. For instance, tapioca starch and rice flour are commonly used as functional replacements for wheat-based ingredients. Additionally, seed proteins like buckwheat and quinoa are gaining popularity due to their nutritional fortification and unique functional properties.
    • The market also caters to specific dietary needs through the production of gluten-free beer, using alternative grains like sorghum and millet. The ongoing research and development in this sector focus on improving taste, texture, and nutritional value, as well as ensuring strict gluten-free certification through advanced food allergen testing and gluten detection kits.

    We can help! Our analysts can customize this gluten-free food market research report to meet your requirements.

    Get in touch

    1 Executive Summary

    • 1.1 Market overview
      • Exhibit 01: Executive Summary – Chart on Market Overview
      • Exhibit 02: Executive Summary – Data Table on Market Overview
      • Exhibit 03: Executive Summary – Chart on Global Market Characteristics
      • Exhibit 04: Executive Summary – Chart on Market by Geography
      • Exhibit 05: Executive Summary – Chart on Market Segmentation by Distribution Channel
      • Exhibit 06: Executive Summary – Chart on Market Segmentation by Product
      • Exhibit 07: Executive Summary – Chart on Incremental Growth
      • Exhibit 08: Executive Summary – Data Table on Incremental Growth
      • Exhibit 09: Executive Summary – Chart on Vendor Market Positioning

    2 Market Landscape

    • 2.1 Market ecosystem
      • Exhibit 10: Parent market
      • Exhibit 11: Market Characteristics

    3 Market Sizing

    • 3.1 Market definition
      • Exhibit 12: Offerings of vendors included in the market definition
    • 3.2 Market segment analysis
      • Exhibit 13: Market segments
    • 3.3 Market size 2023
      • 3.4 Market outlook: Forecast for 2023-2028
        • Exhibit 14: Chart on Global - Market size and forecast 2023-2028 ($ million)
        • Exhibit 15: Data Table on Global - Market size and forecast 2023-2028 ($ million)
        • Exhibit 16: Chart on Global Market: Year-over-year growth 2023-2028 (%)
        • Exhibit 17: Data Table on Global Market: Year-over-year growth 2023-2028 (%)

      4 Historic Market Size

      • 4.1 Global gluten-free food market 2018 - 2022
        • Exhibit 18: Historic Market Size – Data Table on global gluten-free food market 2018 - 2022 ($ million)
      • 4.2 Distribution Channel Segment Analysis 2018 - 2022
        • Exhibit 19: Historic Market Size – Distribution Channel Segment 2018 - 2022 ($ million)
      • 4.3 Product Segment Analysis 2018 - 2022
        • Exhibit 20: Historic Market Size – Product Segment 2018 - 2022 ($ million)
      • 4.4 Geography Segment Analysis 2018 - 2022
        • Exhibit 21: Historic Market Size – Geography Segment 2018 - 2022 ($ million)
      • 4.5 Country Segment Analysis 2018 - 2022
        • Exhibit 22: Historic Market Size – Country Segment 2018 - 2022 ($ million)

      5 Five Forces Analysis

      • 5.1 Five forces summary
        • Exhibit 23: Five forces analysis - Comparison between 2023 and 2028
      • 5.2 Bargaining power of buyers
        • Exhibit 24: Chart on Bargaining power of buyers – Impact of key factors 2023 and 2028
      • 5.3 Bargaining power of suppliers
        • Exhibit 25: Bargaining power of suppliers – Impact of key factors in 2023 and 2028
      • 5.4 Threat of new entrants
        • Exhibit 26: Threat of new entrants – Impact of key factors in 2023 and 2028
      • 5.5 Threat of substitutes
        • Exhibit 27: Threat of substitutes – Impact of key factors in 2023 and 2028
      • 5.6 Threat of rivalry
        • Exhibit 28: Threat of rivalry – Impact of key factors in 2023 and 2028
      • 5.7 Market condition
        • Exhibit 29: Chart on Market condition - Five forces 2023 and 2028

      6 Market Segmentation by Distribution Channel

      • 6.1 Market segments
        • Chart on Distribution Channel - Market share (2023-2028) (%)
        • Data Table on Distribution Channel - Market share (2023-2028) (%)
      • 6.2 Comparison by Distribution Channel
        • Chart on Comparison by Distribution Channel
        • Data Table on Comparison by Distribution Channel
      • 6.3 Offline - Market size and forecast (2023-2028)
        • Chart on Offline - Market size and forecast (2023-2028) ($ million)
        • Data Table on Offline - Market size and forecast (2023-2028) ($ million)
        • Chart on Offline - Year-over-year growth (2023-2028) (%)
        • Data Table on Offline - Year-over-year growth (2023-2028) (%)
      • 6.4 Online - Market size and forecast (2023-2028)
        • Chart on Online - Market size and forecast (2023-2028) ($ million)
        • Data Table on Online - Market size and forecast (2023-2028) ($ million)
        • Chart on Online - Year-over-year growth (2023-2028) (%)
        • Data Table on Online - Year-over-year growth (2023-2028) (%)
      • 6.5 Market opportunity by Distribution Channel
        • Market opportunity by Distribution Channel ($ million)
        • Data Table on Market opportunity by Distribution Channel ($ million)

      7 Market Segmentation by Product

      • 7.1 Market segments
        • Chart on Product - Market share (2023-2028) (%)
        • Data Table on Product - Market share (2023-2028) (%)
      • 7.2 Comparison by Product
        • Chart on Comparison by Product
        • Data Table on Comparison by Product
      • 7.3 Bakery and confectionery products - Market size and forecast (2023-2028)
        • Chart on Bakery and confectionery products - Market size and forecast (2023-2028) ($ million)
        • Data Table on Bakery and confectionery products - Market size and forecast (2023-2028) ($ million)
        • Chart on Bakery and confectionery products - Year-over-year growth (2023-2028) (%)
        • Data Table on Bakery and confectionery products - Year-over-year growth (2023-2028) (%)
      • 7.4 Cereals and snacks - Market size and forecast (2023-2028)
        • Chart on Cereals and snacks - Market size and forecast (2023-2028) ($ million)
        • Data Table on Cereals and snacks - Market size and forecast (2023-2028) ($ million)
        • Chart on Cereals and snacks - Year-over-year growth (2023-2028) (%)
        • Data Table on Cereals and snacks - Year-over-year growth (2023-2028) (%)
      • 7.5 Others - Market size and forecast (2023-2028)
        • Chart on Others - Market size and forecast (2023-2028) ($ million)
        • Data Table on Others - Market size and forecast (2023-2028) ($ million)
        • Chart on Others - Year-over-year growth (2023-2028) (%)
        • Data Table on Others - Year-over-year growth (2023-2028) (%)
      • 7.6 Market opportunity by Product
        • Market opportunity by Product ($ million)
        • Data Table on Market opportunity by Product ($ million)

      8 Market Segmentation by Source

      • 8.1 Market segments
        • Chart on Source - Market share (2023-2028) (%)
        • Data Table on Source - Market share (2023-2028) (%)
      • 8.2 Comparison by Source
        • Chart on Comparison by Source
        • Data Table on Comparison by Source
      • 8.3 Plant-Based - Market size and forecast (2023-2028)
        • Chart on Plant-Based - Market size and forecast (2023-2028) ($ million)
        • Data Table on Plant-Based - Market size and forecast (2023-2028) ($ million)
        • Chart on Plant-Based - Year-over-year growth (2023-2028) (%)
        • Data Table on Plant-Based - Year-over-year growth (2023-2028) (%)
      • 8.4 Animal-Based - Market size and forecast (2023-2028)
        • Chart on Animal-Based - Market size and forecast (2023-2028) ($ million)
        • Data Table on Animal-Based - Market size and forecast (2023-2028) ($ million)
        • Chart on Animal-Based - Year-over-year growth (2023-2028) (%)
        • Data Table on Animal-Based - Year-over-year growth (2023-2028) (%)
      • 8.5 Market opportunity by Source
        • Market opportunity by Source ($ million)
        • Data Table on Market opportunity by Source ($ million)

      9 Market Segmentation by Form

      • 9.1 Market segments
        • Chart on Form - Market share (2023-2028) (%)
        • Data Table on Form - Market share (2023-2028) (%)
      • 9.2 Comparison by Form
        • Chart on Comparison by Form
        • Data Table on Comparison by Form
      • 9.3 Solid - Market size and forecast (2023-2028)
        • Chart on Solid - Market size and forecast (2023-2028) ($ million)
        • Data Table on Solid - Market size and forecast (2023-2028) ($ million)
        • Chart on Solid - Year-over-year growth (2023-2028) (%)
        • Data Table on Solid - Year-over-year growth (2023-2028) (%)
      • 9.4 Liquid - Market size and forecast (2023-2028)
        • Chart on Liquid - Market size and forecast (2023-2028) ($ million)
        • Data Table on Liquid - Market size and forecast (2023-2028) ($ million)
        • Chart on Liquid - Year-over-year growth (2023-2028) (%)
        • Data Table on Liquid - Year-over-year growth (2023-2028) (%)
      • 9.5 Market opportunity by Form
        • Market opportunity by Form ($ million)
        • Data Table on Market opportunity by Form ($ million)

      8 Customer Landscape

      • 8.1 Customer landscape overview
        • Exhibit 62: Analysis of price sensitivity, lifecycle, customer purchase basket, adoption rates, and purchase criteria

      9 Geographic Landscape

      • 9.1 Geographic segmentation
        • Exhibit 63: Chart on Market share by geography 2023-2028 (%)
        • Exhibit 64: Data Table on Market share by geography 2023-2028 (%)
      • 9.2 Geographic comparison
        • Exhibit 65: Chart on Geographic comparison
        • Exhibit 66: Data Table on Geographic comparison
      • 9.3 North America - Market size and forecast 2023-2028
        • Exhibit 67: Chart on North America - Market size and forecast 2023-2028 ($ million)
        • Exhibit 68: Data Table on North America - Market size and forecast 2023-2028 ($ million)
        • Exhibit 69: Chart on North America - Year-over-year growth 2023-2028 (%)
        • Exhibit 70: Data Table on North America - Year-over-year growth 2023-2028 (%)
      • 9.4 Europe - Market size and forecast 2023-2028
        • Exhibit 71: Chart on Europe - Market size and forecast 2023-2028 ($ million)
        • Exhibit 72: Data Table on Europe - Market size and forecast 2023-2028 ($ million)
        • Exhibit 73: Chart on Europe - Year-over-year growth 2023-2028 (%)
        • Exhibit 74: Data Table on Europe - Year-over-year growth 2023-2028 (%)
      • 9.5 APAC - Market size and forecast 2023-2028
        • Exhibit 75: Chart on APAC - Market size and forecast 2023-2028 ($ million)
        • Exhibit 76: Data Table on APAC - Market size and forecast 2023-2028 ($ million)
        • Exhibit 77: Chart on APAC - Year-over-year growth 2023-2028 (%)
        • Exhibit 78: Data Table on APAC - Year-over-year growth 2023-2028 (%)
      • 9.6 South America - Market size and forecast 2023-2028
        • Exhibit 79: Chart on South America - Market size and forecast 2023-2028 ($ million)
        • Exhibit 80: Data Table on South America - Market size and forecast 2023-2028 ($ million)
        • Exhibit 81: Chart on South America - Year-over-year growth 2023-2028 (%)
        • Exhibit 82: Data Table on South America - Year-over-year growth 2023-2028 (%)
      • 9.7 Middle East and Africa - Market size and forecast 2023-2028
        • Exhibit 83: Chart on Middle East and Africa - Market size and forecast 2023-2028 ($ million)
        • Exhibit 84: Data Table on Middle East and Africa - Market size and forecast 2023-2028 ($ million)
        • Exhibit 85: Chart on Middle East and Africa - Year-over-year growth 2023-2028 (%)
        • Exhibit 86: Data Table on Middle East and Africa - Year-over-year growth 2023-2028 (%)
      • 9.8 US - Market size and forecast 2023-2028
        • Exhibit 87: Chart on US - Market size and forecast 2023-2028 ($ million)
        • Exhibit 88: Data Table on US - Market size and forecast 2023-2028 ($ million)
        • Exhibit 89: Chart on US - Year-over-year growth 2023-2028 (%)
        • Exhibit 90: Data Table on US - Year-over-year growth 2023-2028 (%)
      • 9.9 Canada - Market size and forecast 2023-2028
        • Exhibit 91: Chart on Canada - Market size and forecast 2023-2028 ($ million)
        • Exhibit 92: Data Table on Canada - Market size and forecast 2023-2028 ($ million)
        • Exhibit 93: Chart on Canada - Year-over-year growth 2023-2028 (%)
        • Exhibit 94: Data Table on Canada - Year-over-year growth 2023-2028 (%)
      • 9.10 Germany - Market size and forecast 2023-2028
        • Exhibit 95: Chart on Germany - Market size and forecast 2023-2028 ($ million)
        • Exhibit 96: Data Table on Germany - Market size and forecast 2023-2028 ($ million)
        • Exhibit 97: Chart on Germany - Year-over-year growth 2023-2028 (%)
        • Exhibit 98: Data Table on Germany - Year-over-year growth 2023-2028 (%)
      • 9.11 UK - Market size and forecast 2023-2028
        • Exhibit 99: Chart on UK - Market size and forecast 2023-2028 ($ million)
        • Exhibit 100: Data Table on UK - Market size and forecast 2023-2028 ($ million)
        • Exhibit 101: Chart on UK - Year-over-year growth 2023-2028 (%)
        • Exhibit 102: Data Table on UK - Year-over-year growth 2023-2028 (%)
      • 9.12 Italy - Market size and forecast 2023-2028
        • Exhibit 103: Chart on Italy - Market size and forecast 2023-2028 ($ million)
        • Exhibit 104: Data Table on Italy - Market size and forecast 2023-2028 ($ million)
        • Exhibit 105: Chart on Italy - Year-over-year growth 2023-2028 (%)
        • Exhibit 106: Data Table on Italy - Year-over-year growth 2023-2028 (%)
      • 9.13 Market opportunity by geography
        • Exhibit 107: Market opportunity by geography ($ million)
        • Exhibit 108: Data Tables on Market opportunity by geography ($ million)
      • 11.14 US - Market size and forecast (2023-2028)
        • Chart on US - Market size and forecast (2023-2028) ($ million)
        • Data Table on US - Market size and forecast (2023-2028) ($ million)
        • Chart on US - Year-over-year growth (2023-2028) (%)
        • Data Table on US - Year-over-year growth (2023-2028) (%)
      • 11.15 France - Market size and forecast (2023-2028)
        • Chart on France - Market size and forecast (2023-2028) ($ million)
        • Data Table on France - Market size and forecast (2023-2028) ($ million)
        • Chart on France - Year-over-year growth (2023-2028) (%)
        • Data Table on France - Year-over-year growth (2023-2028) (%)
      • 11.16 China - Market size and forecast (2023-2028)
        • Chart on China - Market size and forecast (2023-2028) ($ million)
        • Data Table on China - Market size and forecast (2023-2028) ($ million)
        • Chart on China - Year-over-year growth (2023-2028) (%)
        • Data Table on China - Year-over-year growth (2023-2028) (%)
      • 11.17 India - Market size and forecast (2023-2028)
        • Chart on India - Market size and forecast (2023-2028) ($ million)
        • Data Table on India - Market size and forecast (2023-2028) ($ million)
        • Chart on India - Year-over-year growth (2023-2028) (%)
        • Data Table on India - Year-over-year growth (2023-2028) (%)
      • 11.18 Japan - Market size and forecast (2023-2028)
        • Chart on Japan - Market size and forecast (2023-2028) ($ million)
        • Data Table on Japan - Market size and forecast (2023-2028) ($ million)
        • Chart on Japan - Year-over-year growth (2023-2028) (%)
        • Data Table on Japan - Year-over-year growth (2023-2028) (%)
      • 11.19 Brazil - Market size and forecast (2023-2028)
        • Chart on Brazil - Market size and forecast (2023-2028) ($ million)
        • Data Table on Brazil - Market size and forecast (2023-2028) ($ million)
        • Chart on Brazil - Year-over-year growth (2023-2028) (%)
        • Data Table on Brazil - Year-over-year growth (2023-2028) (%)
      • 11.20 Egypt - Market size and forecast (2023-2028)
        • Chart on Egypt - Market size and forecast (2023-2028) ($ million)
        • Data Table on Egypt - Market size and forecast (2023-2028) ($ million)
        • Chart on Egypt - Year-over-year growth (2023-2028) (%)
        • Data Table on Egypt - Year-over-year growth (2023-2028) (%)
      • 11.21 UAE - Market size and forecast (2023-2028)
        • Chart on UAE - Market size and forecast (2023-2028) ($ million)
        • Data Table on UAE - Market size and forecast (2023-2028) ($ million)
        • Chart on UAE - Year-over-year growth (2023-2028) (%)
        • Data Table on UAE - Year-over-year growth (2023-2028) (%)
      • 11.22 Oman - Market size and forecast (2023-2028)
        • Chart on Oman - Market size and forecast (2023-2028) ($ million)
        • Data Table on Oman - Market size and forecast (2023-2028) ($ million)
        • Chart on Oman - Year-over-year growth (2023-2028) (%)
        • Data Table on Oman - Year-over-year growth (2023-2028) (%)
      • 11.23 Argentina - Market size and forecast (2023-2028)
        • Chart on Argentina - Market size and forecast (2023-2028) ($ million)
        • Data Table on Argentina - Market size and forecast (2023-2028) ($ million)
        • Chart on Argentina - Year-over-year growth (2023-2028) (%)
        • Data Table on Argentina - Year-over-year growth (2023-2028) (%)
      • 11.24 KSA - Market size and forecast (2023-2028)
        • Chart on KSA - Market size and forecast (2023-2028) ($ million)
        • Data Table on KSA - Market size and forecast (2023-2028) ($ million)
        • Chart on KSA - Year-over-year growth (2023-2028) (%)
        • Data Table on KSA - Year-over-year growth (2023-2028) (%)
      • 11.25 Rest of World (ROW) - Market size and forecast (2023-2028)
        • Chart on Rest of World (ROW) - Market size and forecast (2023-2028) ($ million)
        • Data Table on Rest of World (ROW) - Market size and forecast (2023-2028) ($ million)
        • Chart on Rest of World (ROW) - Year-over-year growth (2023-2028) (%)
        • Data Table on Rest of World (ROW) - Year-over-year growth (2023-2028) (%)

      10 Drivers, Challenges, and Trends

      • 10.1 Market drivers
        • 10.2 Market challenges
          • 10.3 Impact of drivers and challenges
            • Exhibit 109: Impact of drivers and challenges in 2023 and 2028
          • 10.4 Market trends

            11 Vendor Landscape

            • 11.1 Overview
              • 11.2 Vendor landscape
                • Exhibit 110: Overview on Criticality of inputs and Factors of differentiation
              • 11.3 Landscape disruption
                • Exhibit 111: Overview on factors of disruption
              • 11.4 Industry risks
                • Exhibit 112: Impact of key risks on business

              12 Vendor Analysis

              • 12.1 Vendors covered
                • Exhibit 113: Vendors covered
              • 12.2 Market positioning of vendors
                • Exhibit 114: Matrix on vendor position and classification
              • 12.3 Amys Kitchen Inc.
                • Exhibit 115: Amys Kitchen Inc. - Overview
                • Exhibit 116: Amys Kitchen Inc. - Product / Service
                • Exhibit 117: Amys Kitchen Inc. - Key offerings
              • 12.4 Bobs Red Mill Natural Foods Inc.
                • Exhibit 118: Bobs Red Mill Natural Foods Inc. - Overview
                • Exhibit 119: Bobs Red Mill Natural Foods Inc. - Product / Service
                • Exhibit 120: Bobs Red Mill Natural Foods Inc. - Key offerings
              • 12.5 Campbell Soup Co.
                • Exhibit 121: Campbell Soup Co. - Overview
                • Exhibit 122: Campbell Soup Co. - Business segments
                • Exhibit 123: Campbell Soup Co. - Key offerings
                • Exhibit 124: Campbell Soup Co. - Segment focus
              • 12.6 Chocoladefabriken Lindt and Sprungli AG
                • Exhibit 125: Chocoladefabriken Lindt and Sprungli AG - Overview
                • Exhibit 126: Chocoladefabriken Lindt and Sprungli AG - Business segments
                • Exhibit 127: Chocoladefabriken Lindt and Sprungli AG - Key news
                • Exhibit 128: Chocoladefabriken Lindt and Sprungli AG - Key offerings
                • Exhibit 129: Chocoladefabriken Lindt and Sprungli AG - Segment focus
              • 12.7 Conagra Brands Inc.
                • Exhibit 130: Conagra Brands Inc. - Overview
                • Exhibit 131: Conagra Brands Inc. - Business segments
                • Exhibit 132: Conagra Brands Inc. - Key news
                • Exhibit 133: Conagra Brands Inc. - Key offerings
                • Exhibit 134: Conagra Brands Inc. - Segment focus
              • 12.8 General Mills Inc.
                • Exhibit 135: General Mills Inc. - Overview
                • Exhibit 136: General Mills Inc. - Business segments
                • Exhibit 137: General Mills Inc. - Key news
                • Exhibit 138: General Mills Inc. - Key offerings
                • Exhibit 139: General Mills Inc. - Segment focus
              • 12.9 Gruma SAB de CV
                • Exhibit 140: Gruma SAB de CV - Overview
                • Exhibit 141: Gruma SAB de CV - Business segments
                • Exhibit 142: Gruma SAB de CV - Key offerings
                • Exhibit 143: Gruma SAB de CV - Segment focus
              • 12.10 Hero AG
                • Exhibit 144: Hero AG - Overview
                • Exhibit 145: Hero AG - Product / Service
                • Exhibit 146: Hero AG - Key offerings
              • 12.11 Kellogg Co.
                • Exhibit 147: Kellogg Co. - Overview
                • Exhibit 148: Kellogg Co. - Business segments
                • Exhibit 149: Kellogg Co. - Key news
                • Exhibit 150: Kellogg Co. - Key offerings
                • Exhibit 151: Kellogg Co. - Segment focus
              • 12.12 Mondelez International Inc.
                • Exhibit 152: Mondelez International Inc. - Overview
                • Exhibit 153: Mondelez International Inc. - Business segments
                • Exhibit 154: Mondelez International Inc. - Key news
                • Exhibit 155: Mondelez International Inc. - Key offerings
                • Exhibit 156: Mondelez International Inc. - Segment focus
              • 12.13 Nestle SA
                • Exhibit 157: Nestle SA - Overview
                • Exhibit 158: Nestle SA - Business segments
                • Exhibit 159: Nestle SA - Key news
                • Exhibit 160: Nestle SA - Key offerings
                • Exhibit 161: Nestle SA - Segment focus
              • 12.14 The Hain Celestial Group Inc.
                • Exhibit 162: The Hain Celestial Group Inc. - Overview
                • Exhibit 163: The Hain Celestial Group Inc. - Business segments
                • Exhibit 164: The Hain Celestial Group Inc. - Key news
                • Exhibit 165: The Hain Celestial Group Inc. - Key offerings
                • Exhibit 166: The Hain Celestial Group Inc. - Segment focus
              • 12.15 The Hershey Co.
                • Exhibit 167: The Hershey Co. - Overview
                • Exhibit 168: The Hershey Co. - Business segments
                • Exhibit 169: The Hershey Co. - Key news
                • Exhibit 170: The Hershey Co. - Key offerings
                • Exhibit 171: The Hershey Co. - Segment focus
              • 12.16 The Kraft Heinz Co.
                • Exhibit 172: The Kraft Heinz Co. - Overview
                • Exhibit 173: The Kraft Heinz Co. - Business segments
                • Exhibit 174: The Kraft Heinz Co. - Key offerings
                • Exhibit 175: The Kraft Heinz Co. - Segment focus
              • 12.17 Unilever PLC
                • Exhibit 176: Unilever PLC - Overview
                • Exhibit 177: Unilever PLC - Business segments
                • Exhibit 178: Unilever PLC - Key news
                • Exhibit 179: Unilever PLC - Key offerings
                • Exhibit 180: Unilever PLC - Segment focus

              13 Appendix

              • 13.1 Scope of the report
                • 13.2 Inclusions and exclusions checklist
                  • Exhibit 181: Inclusions checklist
                  • Exhibit 182: Exclusions checklist
                • 13.3 Currency conversion rates for US$
                  • Exhibit 183: Currency conversion rates for US$
                • 13.4 Research methodology
                  • Exhibit 184: Research methodology
                  • Exhibit 185: Validation techniques employed for market sizing
                  • Exhibit 186: Information sources
                • 13.5 List of abbreviations
                  • Exhibit 187: List of abbreviations

                Research Methodology

                Technavio presents a detailed picture of the market by way of study, synthesis, and summation of data from multiple sources. The analysts have presented the various facets of the market with a particular focus on identifying the key industry influencers. The data thus presented is comprehensive, reliable, and the result of extensive research, both primary and secondary.

                INFORMATION SOURCES

                Primary sources

                • Manufacturers and suppliers
                • Channel partners
                • Industry experts
                • Strategic decision makers

                Secondary sources

                • Industry journals and periodicals
                • Government data
                • Financial reports of key industry players
                • Historical data
                • Press releases

                DATA ANALYSIS

                Data Synthesis

                • Collation of data
                • Estimation of key figures
                • Analysis of derived insights

                Data Validation

                • Triangulation with data models
                • Reference against proprietary databases
                • Corroboration with industry experts

                REPORT WRITING

                Qualitative

                • Market drivers
                • Market challenges
                • Market trends
                • Five forces analysis

                Quantitative

                • Market size and forecast
                • Market segmentation
                • Geographical insights
                • Competitive landscape

                Interested in this report?

                Get your sample now to see our research methodology and insights!

                Download Now

                Frequently Asked Questions

                Gluten-free Food market growth will increase by $ 5.50 bn during 2024-2028.

                The Gluten-free Food market is expected to grow at a CAGR of 10.5% during 2024-2028.

                Gluten-free Food market is segmented by Distribution Channel( Offline, Online, Others) Product( Bakery and confectionery products, Cereals and snacks, Others, South America, MEA)

                Amys Kitchen Inc., Bobs Red Mill Natural Foods Inc., Campbell Soup Co., Chocoladefabriken Lindt and Sprungli AG, Conagra Brands Inc., General Mills Inc., Gruma SAB de CV, Hero AG, Kellogg Co., Mondelez International Inc., Nestle SA, Prima Foods Ltd., Raisio plc, Silly Yak Foods, The Hain Celestial Group Inc., The Hershey Co., The Kraft Heinz Co., Unilever PLC, Valeo Foods Ltd., Warburtons Ltd. are a few of the key vendors in the Gluten-free Food market.

                North America will register the highest growth rate of 47% among the other regions. Therefore, the Gluten-free Food market in North America is expected to garner significant business opportunities for the vendors during the forecast period.

                US, Canada, Germany, UK, Italy, France, China, India, Japan, Brazil, Egypt, UAE, Oman, Argentina, KSA, UAE, Brazil, Rest of World (ROW)

                • Growing demand for gluten-free bakery productsGluten is a protein found in wheat is the driving factor this market.
                • barley is the driving factor this market.
                • and rye is the driving factor this market.
                • which can cause adverse reactions in people with celiac disease or gluten intolerance.  As awareness of these conditions has increased is the driving factor this market.
                • so has the demand for gluten-free alternatives to traditional bakery products.  Gluten-free bakery products are now widely available in supermarkets and specialty stores is the driving factor this market.
                • and there is a growing trend towards using alternative flours such as almond is the driving factor this market.
                • coconut is the driving factor this market.
                • and quinoa to create gluten-free baked goods.  This has opened up a whole new market for gluten-free bakeries and manufacturers is the driving factor this market.
                • who are able to cater to the needs of consumers with celiac disease or gluten intolerance is the driving factor this market.
                • as well as those who choose to follow a gluten-free diet for other health reasons.  As a result is the driving factor this market.
                • the global gluten free food market is expected to continue to grow in the coming years is the driving factor this market.
                • with bakery products playing a significant role in driving this growth.  According to Jonathan Warburton is the driving factor this market.
                • Chairman at Warburtons is the driving factor this market.
                • this rebranding was an initiative to enable easy identification of gluten-free bakery products from the aisle.  The range was fully brought in line with the company other products is the driving factor this market.
                • carrying the company logo with black and orange packaging is the driving factor this market.
                • showcasing a clear gluten-free message.  Such initiatives by bakers are expected to spur the demand for gluten-free  bakery products is the driving factor this market.
                • increase the revenue of global gluten-free bakery products is the driving factor this market.
                • and drive the growth of the global gluten free food market during the forecast period. is the driving factor this market.

                The Gluten-free Food market vendors should focus on grabbing business opportunities from the Offline segment as it accounted for the largest market share in the base year.
                RIA - Research AI Assistant
                Ask RIA