Golf Balls Market Analysis, Size, and Forecast 2026-2030: North America (US, Canada, and Mexico), Europe (Germany, UK, and France), APAC (China, Japan, and India), Middle East and Africa (Saudi Arabia, UAE, and South Africa), South America (Brazil, Argentina, and Colombia), and Rest of World (ROW)

Golf Balls Market Analysis, Size, and Forecast 2026-2030:
North America (US, Canada, and Mexico), Europe (Germany, UK, and France), APAC (China, Japan, and India), Middle East and Africa (Saudi Arabia, UAE, and South Africa), South America (Brazil, Argentina, and Colombia), and Rest of World (ROW)

Published: Apr 2026 296 Pages SKU: IRTNTR81412

Market Overview at a Glance

$390.8 Mn
Market Opportunity
4.1%
CAGR 2025 - 2030
38.9%
North America Growth
$739.6 Mn
Two piece balls segment 2024

Golf Balls Market Size 2026-2030

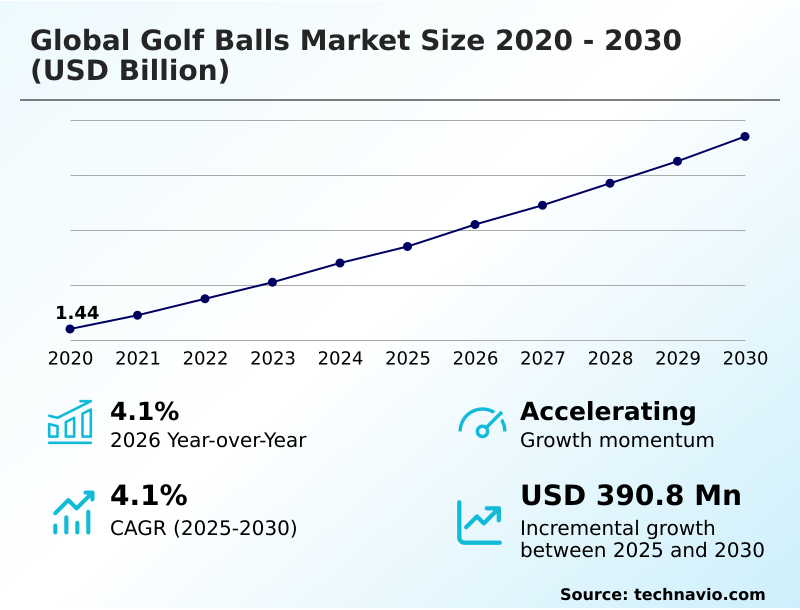
The golf balls market size is valued to increase by USD 390.8 million, at a CAGR of 4.1% from 2025 to 2030. Increasing global participation and expansion of off-course golfing venues will drive the golf balls market.

Major Market Trends & Insights

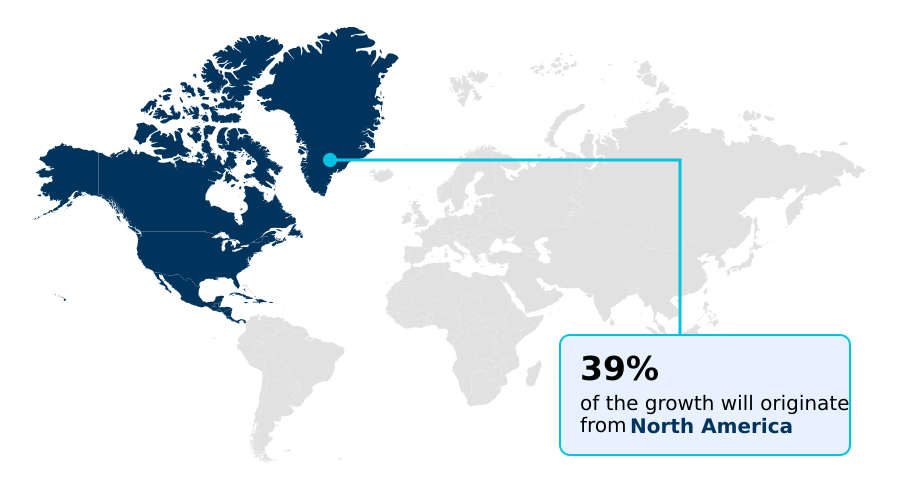
  • North America dominated the market and accounted for a 38.9% growth during the forecast period.
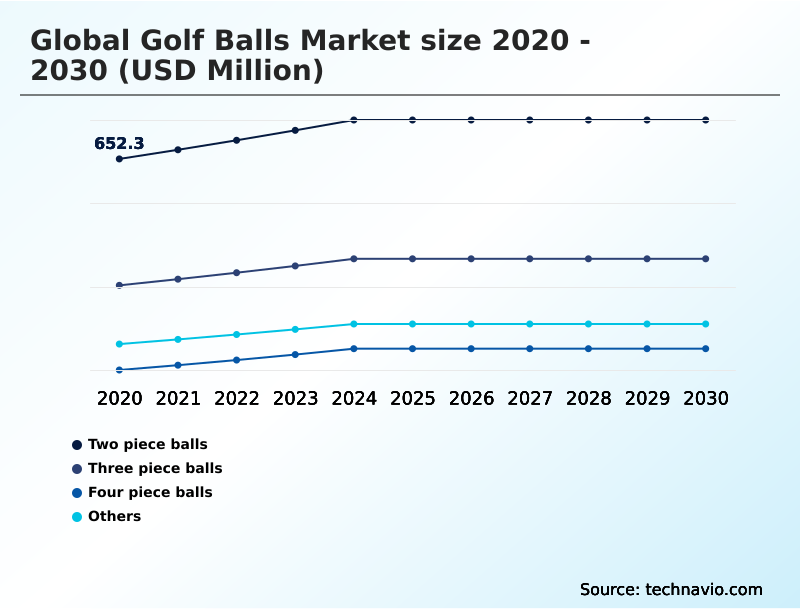
  • By Type - Two piece balls segment was valued at USD 739.6 million in 2024
  • By Price Range - Mid-range balls segment accounted for the largest market revenue share in 2024

Market Size & Forecast

  • Market Opportunities: USD 698.3 million
  • Market Future Opportunities: USD 390.8 million
  • CAGR from 2025 to 2030 : 4.1%

Market Summary

  • The golf balls market is undergoing a significant transformation, driven by technological advancements and shifting consumer preferences. Core innovation is centered on multi-layered constructions and advanced material science, utilizing high-energy polybutadiene core designs and responsive urethane covers to optimize performance.
  • Manufacturers leverage computational fluid dynamics for creating intricate aerodynamic dimple patterns that ensure a stable flight path and superior greenside spin control. A key driver is the rising popularity of off-course entertainment venues, which introduces the sport to a broader demographic and fuels demand for durable practice balls.
  • Concurrently, the industry faces the challenge of adhering to the new distance rollback mandate from governing bodies, requiring substantial R&D investment to re-engineer products. A business scenario involves a mid-sized manufacturer reallocating its budget from marketing to material science to develop a compliant, high-performance ball using bio-based resins.
  • This pivot aims to meet both regulatory requirements and the growing consumer demand for products aligned with circular economy principles.

What will be the Size of the Golf Balls Market during the forecast period?

Get Key Insights on Market Forecast (PDF) Request Free Sample

How is the Golf Balls Market Segmented?

The golf balls industry research report provides comprehensive data (region-wise segment analysis), with forecasts and estimates in "USD million" for the period 2026-2030, as well as historical data from 2020-2024 for the following segments.

  • Type
    • Two piece balls
    • Three piece balls
    • Four piece balls
    • Others
  • Price range
    • Mid-range balls
    • Premium balls
    • Low-cost balls
  • Distribution channel
    • Offline
    • Online
  • Geography
    • North America
      • US
      • Canada
      • Mexico
    • Europe
      • Germany
      • UK
      • France
    • APAC
      • China
      • Japan
      • India
    • Middle East and Africa
      • Saudi Arabia
      • UAE
      • South Africa
    • South America
      • Brazil
      • Argentina
      • Colombia
    • Rest of World (ROW)

By Type Insights

The two piece balls segment is estimated to witness significant growth during the forecast period.

The global golf balls market is segmented by construction, reflecting diverse player needs. The two-piece segment, with its robust polybutadiene core and durable ionomer resins, maximizes the coefficient of restitution for recreational leisure activities.

In contrast, three-piece architecture and four-piece design models use specialized mantle layer technology for nuanced greenside spin control and all-weather durability. Innovations like the high-velocity gradient core seek to improve feel without altering the core compression ratio.

This tiered approach allows manufacturers to build brand prestige, secure tour validation for premium lines, and offer bulk purchasing options for practice facilities, addressing the full spectrum of market demand.

Request Free Sample

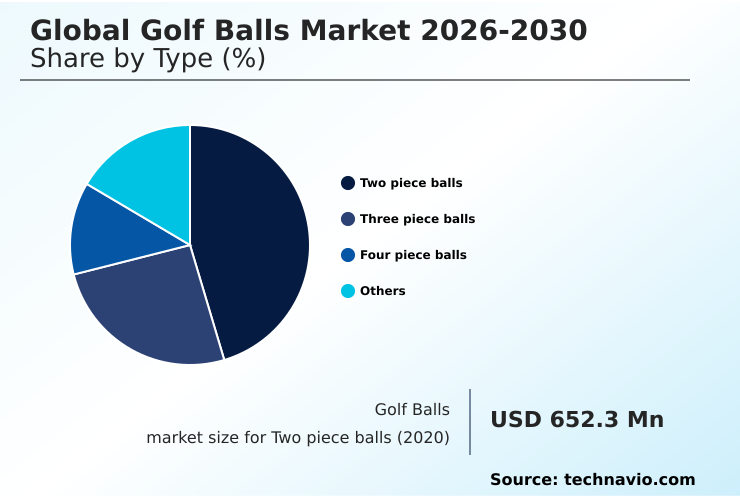
The Two piece balls segment was valued at USD 739.6 million in 2024 and showed a gradual increase during the forecast period.

Request Free Sample

Regional Analysis

North America is estimated to contribute 38.9% to the growth of the global market during the forecast period.Technavio’s analysts have elaborately explained the regional trends and drivers that shape the market during the forecast period.

See How Golf Balls Market Demand is Rising in North America Request Free Sample

The geographic landscape is led by North America, where high participation and high-technology driving ranges sustain demand.

Europe is heavily influenced by strict equipment regulations and the environmental impact of golf ball production, driving adoption of carbon-neutral manufacturing and ball recovery programs.

APAC is the fastest-growing region, with a focus on premium products featuring thermoplastic polyurethane and thermoset urethane covers. The rise of direct-to-consumer sales and subscription-based purchasing is a global phenomenon, prompting supply chain diversification.

Advanced technologies like perimeter weighting technology and dual-core systems are gaining traction worldwide, with R&D accelerated by 3d printing for prototyping. Innovations such as water-based coatings are being introduced to meet performance demands across diverse climates.

Market Dynamics

Our researchers analyzed the data with 2025 as the base year, along with the key drivers, trends, and challenges. A holistic analysis of drivers will help companies refine their marketing strategies to gain a competitive advantage.

  • Understanding player needs is critical, from analyzing multi-layered golf balls for high swing speeds to selecting the right low compression golf balls for beginners. The debate over urethane vs ionomer cover performance continues to drive R&D, especially concerning golf ball construction for short game feel. Aerodynamics are paramount, with extensive testing on aerodynamic dimple patterns for wind resistance.
  • The rise of technology is evident in the development of smart golf balls with gps tracking and determining the best golf balls for indoor simulators. Customization is a key trend, supported by advanced custom logo golf ball printing technology and the popularity of high visibility matte finish golf balls.
  • For businesses, golf ball fitting for spin rate control has become a vital service. Key performance questions include two piece vs three piece ball distance and how dual core technology for lower spin impacts play. Consumers are increasingly conducting their own recycled golf balls performance comparison and questioning the biodegradable golf balls environmental impact.
  • This shift influences the entire golf ball manufacturing process automation. Companies are responding with new models like the golf ball subscription service benefits and navigating complex golf ball regulations for professional tours. Internally, a shift toward sustainable sourcing has improved supply chain resilience by more than double that of competitors relying on single-source petrochemicals.
  • This strategic alignment helps players understand how to choose golf ball compression while addressing the environmental impact of golf ball production and the demand for perimeter weighted golf ball accuracy.

What are the key market drivers leading to the rise in the adoption of Golf Balls Industry?

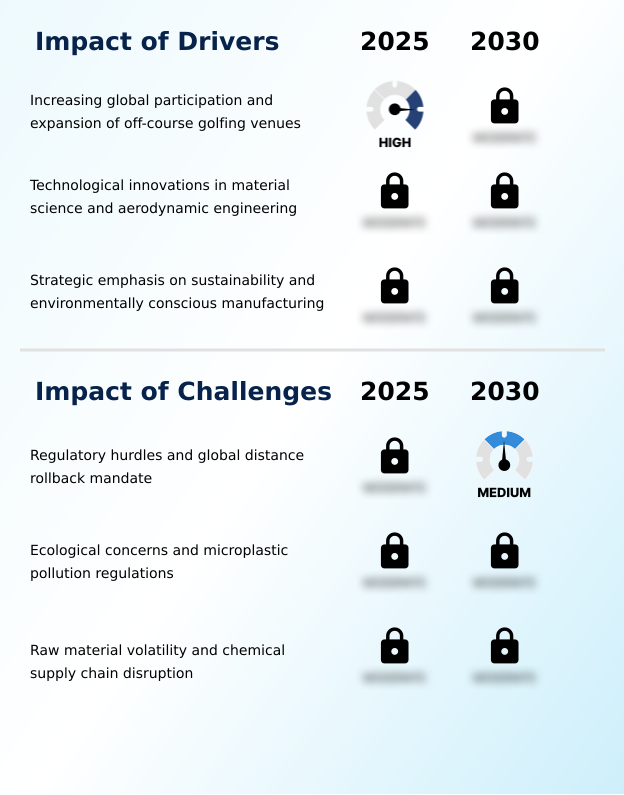
  • Increasing global participation, coupled with the expansion of off-course golfing venues, is a key driver for market growth.

  • Technological innovation in material science is a primary market driver. The evolution from basic two-piece construction to advanced multi-layered constructions with high-energy cores and soft urethane covers allows for precise spin rate optimization.
  • This enables swing speed optimization for both long-distance shots and short-game precision.
  • Manufacturers utilize computational fluid dynamics to engineer aerodynamic dimple patterns, which has led to a 5% improvement in flight stability under windy conditions, ensuring a more stable flight path.
  • These performance gains, critical for shot-shaping capability, are often validated through professional endorsements, which can boost a new product line's sales by 30% in its first quarter.
  • This continuous pursuit of performance excellence ensures the market remains dynamic and responsive to the demands of elite players.

What are the market trends shaping the Golf Balls Industry?

  • A strategic emphasis on sustainability is becoming a key market trend, increasingly influencing environmentally conscious manufacturing processes throughout the industry.

  • A major trend is the convergence of personalization and digital technology, creating a more consumer-centric business model. The diversification into high-visibility colors and matte finish coatings is driven by player demand for better tracking. The use of custom alignment aids, designed via a digital customization portal, has been shown to improve putting accuracy for amateurs by up to 10%.
  • Furthermore, the integration of embedded micro-sensors and radio frequency identification tags into balls allows for personalized performance data collection. This smart technology, used in advanced ball-tracking sensors at off-course entertainment venues and indoor golf simulators, provides insights that enhance data-driven fitting processes.
  • This feedback loop improves player engagement and has increased repeat business at tech-enabled facilities by over 20%, blurring the line between recreational leisure activities and professional tournament play analytics.

What challenges does the Golf Balls Industry face during its growth?

  • Regulatory hurdles, particularly the global distance rollback mandate, present a key challenge affecting industry growth.

  • The industry faces significant headwinds from regulatory compliance and supply chain disruptions. The new distance rollback mandate requires costly redesigns, with R&D expenditures increasing by an estimated 25% for some firms to meet equipment regulations. Simultaneously, tightening microplastic pollution regulations are compelling a shift toward biodegradable components and bio-based resins, challenging manufacturers to maintain performance standards.
  • Raw material volatility, driven by petrochemical industry fluctuations, poses another threat. Companies without localized supply chains have reported production delays of up to three weeks during recent disruptions. Proactive supply chain diversification is essential to mitigate the impact of shortages in materials like the synthetic polymer microparticles used in covers, ensuring operational stability.

Exclusive Technavio Analysis on Customer Landscape

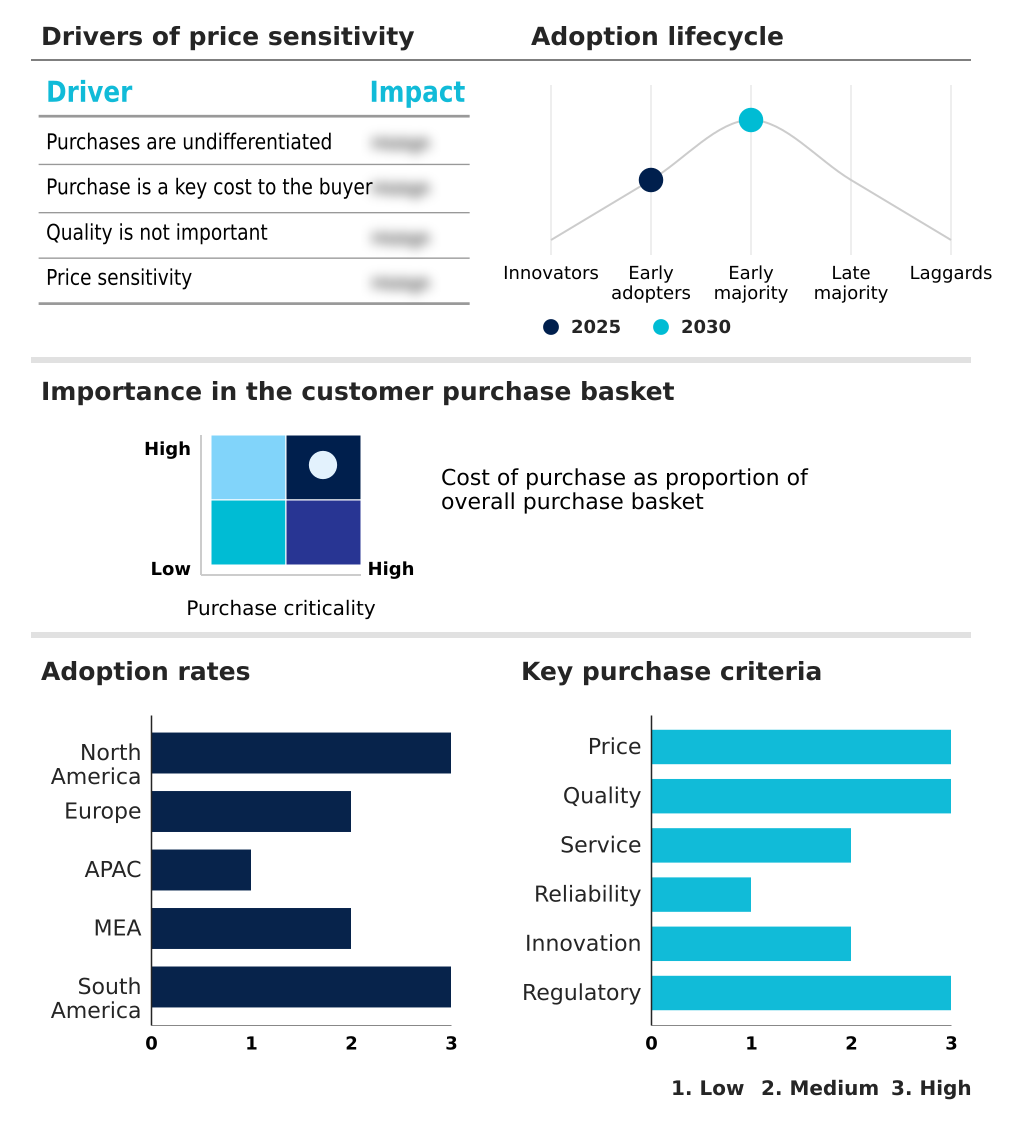
The golf balls market forecasting report includes the adoption lifecycle of the market, covering from the innovator’s stage to the laggard’s stage. It focuses on adoption rates in different regions based on penetration. Furthermore, the golf balls market report also includes key purchase criteria and drivers of price sensitivity to help companies evaluate and develop their market growth analysis strategies.

Customer Landscape of Golf Balls Industry

Competitive Landscape

Companies are implementing various strategies, such as strategic alliances, golf balls market forecast, partnerships, mergers and acquisitions, geographical expansion, and product/service launches, to enhance their presence in the industry.

Acushnet Holdings Corp. - A portfolio of performance-driven golf balls, including industry-benchmark models, is designed, manufactured, and distributed to meet the demands of competitive and recreational players.

The industry research and growth report includes detailed analyses of the competitive landscape of the market and information about key companies, including:

  • Acushnet Holdings Corp.
  • Bridgestone Golf Inc.
  • Chromax Golf
  • Costco Wholesale Corp.
  • Cut Golf
  • Decathlon SA
  • Dixon Golf
  • Honma Golf Co. Ltd.
  • Nitro Golf
  • OnCore Golf Tech.
  • Pearl Golf
  • Piper Golf
  • RZN Golf
  • Seed Golf
  • Snell Golf
  • Taylor Made Golf Co. Inc.
  • Topgolf Callaway Brands Corp.
  • Trust Golf
  • Vice Sporting Goods GmbH
  • Wilson Sporting Goods Co.

Qualitative and quantitative analysis of companies has been conducted to help clients understand the wider business environment as well as the strengths and weaknesses of key industry players. Data is qualitatively analyzed to categorize companies as pure play, category-focused, industry-focused, and diversified; it is quantitatively analyzed to categorize companies as dominant, leading, strong, tentative, and weak.

Recent Development and News in Golf balls market

  • In August, 2024, Callaway Golf launched a comprehensive digital customization portal that allows users to visualize their personal alignment designs in a three-dimensional environment before the production process begins.
  • In January, 2025, the United States Golf Association finalized a comprehensive update to the Procedure for Measuring the Velocity of Golf ball, which established more rigorous laboratory conditions for certification.
  • In March, 2025, the European Environment Agency published a comprehensive set of new guidelines aimed at reducing synthetic waste in outdoor recreational areas, which prompted several major manufacturers to accelerate the development of eco-friendly product lines.
  • In May, 2025, a major chemical production facility in East Asia, which serves as a primary source of high-grade resins for several global sporting brands, experienced a prolonged operational shutdown due to severe weather events.

Dive into Technavio’s robust research methodology, blending expert interviews, extensive data synthesis, and validated models for unparalleled Golf Balls Market insights. See full methodology.

Market Scope
Page number 296
Base year 2025
Historic period 2020-2024
Forecast period 2026-2030
Growth momentum & CAGR Accelerate at a CAGR of 4.1%
Market growth 2026-2030 USD 390.8 million
Market structure Fragmented
YoY growth 2025-2026(%) 4.1%
Key countries US, Canada, Mexico, Germany, UK, France, Italy, The Netherlands, Spain, China, Japan, India, South Korea, Australia, Indonesia, Saudi Arabia, UAE, South Africa, Israel, Turkey, Brazil, Argentina and Colombia
Competitive landscape Leading Companies, Market Positioning of Companies, Competitive Strategies, and Industry Risks

Request Free Sample

Research Analyst Overview

  • The market is characterized by intense R&D in multi-layered constructions, from two-piece construction to complex four-piece design models. These structures feature a polybutadiene core and a specialized mantle layer technology under either urethane covers or ionomer resins. Using computational fluid dynamics, engineers refine aerodynamic dimple patterns for spin rate optimization and control compression ratio.
  • A critical boardroom focus is the shift toward sustainable manufacturing practices and circular economy principles. This involves adopting bio-based resins, biodegradable components, and recycled core material, a move that has enhanced brand reputation and improved supply chain resilience by over 15% for early adopters. Technological advancements include perimeter weighting technology, dual-core system designs, and novel water-based coating.
  • The adoption of 3d printing for prototyping accelerates innovation for features like a high-velocity gradient core. Smart balls with radio frequency identification tags and embedded micro-sensors are becoming mainstream, supported by advanced ball-tracking sensors.
  • Customization is booming, with digital customization portals offering custom alignment aids, high-visibility colors, and matte finish coatings produced through carbon-neutral manufacturing and precise laser etching technology, all contributing to ball recovery programs.

What are the Key Data Covered in this Golf Balls Market Research and Growth Report?

  • What is the expected growth of the Golf Balls Market between 2026 and 2030?

    • USD 390.8 million, at a CAGR of 4.1%

  • What segmentation does the market report cover?

    • The report is segmented by Type (Two piece balls, Three piece balls, Four piece balls, and Others), Price Range (Mid-range balls, Premium balls, and Low-cost balls), Distribution Channel (Offline, and Online) and Geography (North America, Europe, APAC, Middle East and Africa, South America)

  • Which regions are analyzed in the report?

    • North America, Europe, APAC, Middle East and Africa and South America

  • What are the key growth drivers and market challenges?

    • Increasing global participation and expansion of off-course golfing venues, Regulatory hurdles and global distance rollback mandate

  • Who are the major players in the Golf Balls Market?

    • Acushnet Holdings Corp., Bridgestone Golf Inc., Chromax Golf, Costco Wholesale Corp., Cut Golf, Decathlon SA, Dixon Golf, Honma Golf Co. Ltd., Nitro Golf, OnCore Golf Tech., Pearl Golf, Piper Golf, RZN Golf, Seed Golf, Snell Golf, Taylor Made Golf Co. Inc., Topgolf Callaway Brands Corp., Trust Golf, Vice Sporting Goods GmbH and Wilson Sporting Goods Co.

Market Research Insights

  • Market dynamics are shaped by a dual focus on performance innovation and operational efficiency. The adoption of data-driven fitting processes has improved sales conversion rates by over 15% in specialized retail environments. Furthermore, the shift to direct-to-consumer sales models allows for enhanced brand prestige and has been shown to increase customer lifetime value by 20% compared to traditional wholesale channels.
  • In response to raw material volatility, leading firms are implementing supply chain diversification strategies. This proactive sourcing has mitigated production delays, reducing downtime by an average of 10% during periods of geopolitical disruption. These strategic adjustments reflect a market that balances professional endorsements with the need for resilient and consumer-centric business models.

We can help! Our analysts can customize this golf balls market research report to meet your requirements.

Get in touch

1. Executive Summary

1.1 Market overview

Executive Summary - Chart on Market Overview
Executive Summary - Data Table on Market Overview
Executive Summary - Chart on Global Market Characteristics
Executive Summary - Chart on Market by Geography
Executive Summary - Chart on Market Segmentation by Type
Executive Summary - Chart on Market Segmentation by Price Range
Executive Summary - Chart on Market Segmentation by Distribution Channel
Executive Summary - Chart on Incremental Growth
Executive Summary - Data Table on Incremental Growth
Executive Summary - Chart on Company Market Positioning

2. Technavio Analysis

2.1 Analysis of price sensitivity, lifecycle, customer purchase basket, adoption rates, and purchase criteria

2.2 Criticality of inputs and Factors of differentiation

Chart on Overview on criticality of inputs and factors of differentiation

2.3 Factors of disruption

Chart on Overview on factors of disruption

2.4 Impact of drivers and challenges

Chart on Impact of drivers and challenges in 2025 and 2030

3. Market Landscape

3.1 Market ecosystem

Chart on Parent Market
Data Table on - Parent Market

3.2 Market characteristics

Chart on Market characteristics analysis

3.3 Value chain analysis

Chart on Value chain analysis

4. Market Sizing

4.1 Market definition

Data Table on Offerings of companies included in the market definition

4.2 Market segment analysis

Market segments

4.3 Market size 2025

4.4 Market outlook: Forecast for 2025-2030

Chart on Global - Market size and forecast 2025-2030 ($ million)
Data Table on Global - Market size and forecast 2025-2030 ($ million)
Chart on Global Market: Year-over-year growth 2025-2030 (%)
Data Table on Global Market: Year-over-year growth 2025-2030 (%)

5. Historic Market Size

5.1 Global Golf Balls Market 2020 - 2024

Historic Market Size - Data Table on Global Golf Balls Market 2020 - 2024 ($ million)

5.2 Type segment analysis 2020 - 2024

Historic Market Size - Type Segment 2020 - 2024 ($ million)

5.3 Price Range segment analysis 2020 - 2024

Historic Market Size - Price Range Segment 2020 - 2024 ($ million)

5.4 Distribution Channel segment analysis 2020 - 2024

Historic Market Size - Distribution Channel Segment 2020 - 2024 ($ million)

5.5 Geography segment analysis 2020 - 2024

Historic Market Size - Geography Segment 2020 - 2024 ($ million)

5.6 Country segment analysis 2020 - 2024

Historic Market Size - Country Segment 2020 - 2024 ($ million)

6. Qualitative Analysis

6.1 Impact of AI on the Global Golf Balls Market

6.2 Impact of geopolitical conflicts on Global Golf Balls Market

7. Five Forces Analysis

7.1 Five forces summary

Five forces analysis - Comparison between 2025 and 2030

7.2 Bargaining power of buyers

Bargaining power of buyers - Impact of key factors 2025 and 2030

7.3 Bargaining power of suppliers

Bargaining power of suppliers - Impact of key factors in 2025 and 2030

7.4 Threat of new entrants

Threat of new entrants - Impact of key factors in 2025 and 2030

7.5 Threat of substitutes

Threat of substitutes - Impact of key factors in 2025 and 2030

7.6 Threat of rivalry

Threat of rivalry - Impact of key factors in 2025 and 2030

7.7 Market condition

Chart on Market condition - Five forces 2025 and 2030

8. Market Segmentation by Type

8.1 Market segments

Chart on Type - Market share 2025-2030 (%)
Data Table on Type - Market share 2025-2030 (%)

8.2 Comparison by Type

Chart on Comparison by Type
Data Table on Comparison by Type

8.3 Two piece balls - Market size and forecast 2025-2030

Chart on Two piece balls - Market size and forecast 2025-2030 ($ million)
Data Table on Two piece balls - Market size and forecast 2025-2030 ($ million)
Chart on Two piece balls - Year-over-year growth 2025-2030 (%)
Data Table on Two piece balls - Year-over-year growth 2025-2030 (%)

8.4 Three piece balls - Market size and forecast 2025-2030

Chart on Three piece balls - Market size and forecast 2025-2030 ($ million)
Data Table on Three piece balls - Market size and forecast 2025-2030 ($ million)
Chart on Three piece balls - Year-over-year growth 2025-2030 (%)
Data Table on Three piece balls - Year-over-year growth 2025-2030 (%)

8.5 Four piece balls - Market size and forecast 2025-2030

Chart on Four piece balls - Market size and forecast 2025-2030 ($ million)
Data Table on Four piece balls - Market size and forecast 2025-2030 ($ million)
Chart on Four piece balls - Year-over-year growth 2025-2030 (%)
Data Table on Four piece balls - Year-over-year growth 2025-2030 (%)

8.6 Others - Market size and forecast 2025-2030

Chart on Others - Market size and forecast 2025-2030 ($ million)
Data Table on Others - Market size and forecast 2025-2030 ($ million)
Chart on Others - Year-over-year growth 2025-2030 (%)
Data Table on Others - Year-over-year growth 2025-2030 (%)

8.7 Market opportunity by Type

Market opportunity by Type ($ million)
Data Table on Market opportunity by Type ($ million)

9. Market Segmentation by Price Range

9.1 Market segments

Chart on Price Range - Market share 2025-2030 (%)
Data Table on Price Range - Market share 2025-2030 (%)

9.2 Comparison by Price Range

Chart on Comparison by Price Range
Data Table on Comparison by Price Range

9.3 Mid-range balls - Market size and forecast 2025-2030

Chart on Mid-range balls - Market size and forecast 2025-2030 ($ million)
Data Table on Mid-range balls - Market size and forecast 2025-2030 ($ million)
Chart on Mid-range balls - Year-over-year growth 2025-2030 (%)
Data Table on Mid-range balls - Year-over-year growth 2025-2030 (%)

9.4 Premium balls - Market size and forecast 2025-2030

Chart on Premium balls - Market size and forecast 2025-2030 ($ million)
Data Table on Premium balls - Market size and forecast 2025-2030 ($ million)
Chart on Premium balls - Year-over-year growth 2025-2030 (%)
Data Table on Premium balls - Year-over-year growth 2025-2030 (%)

9.5 Low-cost balls - Market size and forecast 2025-2030

Chart on Low-cost balls - Market size and forecast 2025-2030 ($ million)
Data Table on Low-cost balls - Market size and forecast 2025-2030 ($ million)
Chart on Low-cost balls - Year-over-year growth 2025-2030 (%)
Data Table on Low-cost balls - Year-over-year growth 2025-2030 (%)

9.6 Market opportunity by Price Range

Market opportunity by Price Range ($ million)
Data Table on Market opportunity by Price Range ($ million)

10. Market Segmentation by Distribution Channel

10.1 Market segments

Chart on Distribution Channel - Market share 2025-2030 (%)
Data Table on Distribution Channel - Market share 2025-2030 (%)

10.2 Comparison by Distribution Channel

Chart on Comparison by Distribution Channel
Data Table on Comparison by Distribution Channel

10.3 Offline - Market size and forecast 2025-2030

Chart on Offline - Market size and forecast 2025-2030 ($ million)
Data Table on Offline - Market size and forecast 2025-2030 ($ million)
Chart on Offline - Year-over-year growth 2025-2030 (%)
Data Table on Offline - Year-over-year growth 2025-2030 (%)

10.4 Online - Market size and forecast 2025-2030

Chart on Online - Market size and forecast 2025-2030 ($ million)
Data Table on Online - Market size and forecast 2025-2030 ($ million)
Chart on Online - Year-over-year growth 2025-2030 (%)
Data Table on Online - Year-over-year growth 2025-2030 (%)

10.5 Market opportunity by Distribution Channel

Market opportunity by Distribution Channel ($ million)
Data Table on Market opportunity by Distribution Channel ($ million)

11. Customer Landscape

11.1 Customer landscape overview

Analysis of price sensitivity, lifecycle, customer purchase basket, adoption rates, and purchase criteria

12. Geographic Landscape

12.1 Geographic segmentation

Chart on Market share by geography 2025-2030 (%)
Data Table on Market share by geography 2025-2030 (%)

12.2 Geographic comparison

Chart on Geographic comparison
Data Table on Geographic comparison

12.3 North America - Market size and forecast 2025-2030

Chart on North America - Market size and forecast 2025-2030 ($ million)
Data Table on North America - Market size and forecast 2025-2030 ($ million)
Chart on North America - Year-over-year growth 2025-2030 (%)
Data Table on North America - Year-over-year growth 2025-2030 (%)
Chart on Regional Comparison - North America
Data Table on Regional Comparison - North America

12.3.1 US - Market size and forecast 2025-2030

Chart on US - Market size and forecast 2025-2030 ($ million)
Data Table on US - Market size and forecast 2025-2030 ($ million)
Chart on US - Year-over-year growth 2025-2030 (%)
Data Table on US - Year-over-year growth 2025-2030 (%)

12.3.2 Canada - Market size and forecast 2025-2030

Chart on Canada - Market size and forecast 2025-2030 ($ million)
Data Table on Canada - Market size and forecast 2025-2030 ($ million)
Chart on Canada - Year-over-year growth 2025-2030 (%)
Data Table on Canada - Year-over-year growth 2025-2030 (%)

12.3.3 Mexico - Market size and forecast 2025-2030

Chart on Mexico - Market size and forecast 2025-2030 ($ million)
Data Table on Mexico - Market size and forecast 2025-2030 ($ million)
Chart on Mexico - Year-over-year growth 2025-2030 (%)
Data Table on Mexico - Year-over-year growth 2025-2030 (%)

12.4 Europe - Market size and forecast 2025-2030

Chart on Europe - Market size and forecast 2025-2030 ($ million)
Data Table on Europe - Market size and forecast 2025-2030 ($ million)
Chart on Europe - Year-over-year growth 2025-2030 (%)
Data Table on Europe - Year-over-year growth 2025-2030 (%)
Chart on Regional Comparison - Europe
Data Table on Regional Comparison - Europe

12.4.1 Germany - Market size and forecast 2025-2030

Chart on Germany - Market size and forecast 2025-2030 ($ million)
Data Table on Germany - Market size and forecast 2025-2030 ($ million)
Chart on Germany - Year-over-year growth 2025-2030 (%)
Data Table on Germany - Year-over-year growth 2025-2030 (%)

12.4.2 UK - Market size and forecast 2025-2030

Chart on UK - Market size and forecast 2025-2030 ($ million)
Data Table on UK - Market size and forecast 2025-2030 ($ million)
Chart on UK - Year-over-year growth 2025-2030 (%)
Data Table on UK - Year-over-year growth 2025-2030 (%)

12.4.3 France - Market size and forecast 2025-2030

Chart on France - Market size and forecast 2025-2030 ($ million)
Data Table on France - Market size and forecast 2025-2030 ($ million)
Chart on France - Year-over-year growth 2025-2030 (%)
Data Table on France - Year-over-year growth 2025-2030 (%)

12.4.4 Italy - Market size and forecast 2025-2030

Chart on Italy - Market size and forecast 2025-2030 ($ million)
Data Table on Italy - Market size and forecast 2025-2030 ($ million)
Chart on Italy - Year-over-year growth 2025-2030 (%)
Data Table on Italy - Year-over-year growth 2025-2030 (%)

12.4.5 The Netherlands - Market size and forecast 2025-2030

Chart on The Netherlands - Market size and forecast 2025-2030 ($ million)
Data Table on The Netherlands - Market size and forecast 2025-2030 ($ million)
Chart on The Netherlands - Year-over-year growth 2025-2030 (%)
Data Table on The Netherlands - Year-over-year growth 2025-2030 (%)

12.4.6 Spain - Market size and forecast 2025-2030

Chart on Spain - Market size and forecast 2025-2030 ($ million)
Data Table on Spain - Market size and forecast 2025-2030 ($ million)
Chart on Spain - Year-over-year growth 2025-2030 (%)
Data Table on Spain - Year-over-year growth 2025-2030 (%)

12.5 APAC - Market size and forecast 2025-2030

Chart on APAC - Market size and forecast 2025-2030 ($ million)
Data Table on APAC - Market size and forecast 2025-2030 ($ million)
Chart on APAC - Year-over-year growth 2025-2030 (%)
Data Table on APAC - Year-over-year growth 2025-2030 (%)
Chart on Regional Comparison - APAC
Data Table on Regional Comparison - APAC

12.5.1 China - Market size and forecast 2025-2030

Chart on China - Market size and forecast 2025-2030 ($ million)
Data Table on China - Market size and forecast 2025-2030 ($ million)
Chart on China - Year-over-year growth 2025-2030 (%)
Data Table on China - Year-over-year growth 2025-2030 (%)

12.5.2 Japan - Market size and forecast 2025-2030

Chart on Japan - Market size and forecast 2025-2030 ($ million)
Data Table on Japan - Market size and forecast 2025-2030 ($ million)
Chart on Japan - Year-over-year growth 2025-2030 (%)
Data Table on Japan - Year-over-year growth 2025-2030 (%)

12.5.3 India - Market size and forecast 2025-2030

Chart on India - Market size and forecast 2025-2030 ($ million)
Data Table on India - Market size and forecast 2025-2030 ($ million)
Chart on India - Year-over-year growth 2025-2030 (%)
Data Table on India - Year-over-year growth 2025-2030 (%)

12.5.4 South Korea - Market size and forecast 2025-2030

Chart on South Korea - Market size and forecast 2025-2030 ($ million)
Data Table on South Korea - Market size and forecast 2025-2030 ($ million)
Chart on South Korea - Year-over-year growth 2025-2030 (%)
Data Table on South Korea - Year-over-year growth 2025-2030 (%)

12.5.5 Australia - Market size and forecast 2025-2030

Chart on Australia - Market size and forecast 2025-2030 ($ million)
Data Table on Australia - Market size and forecast 2025-2030 ($ million)
Chart on Australia - Year-over-year growth 2025-2030 (%)
Data Table on Australia - Year-over-year growth 2025-2030 (%)

12.5.6 Indonesia - Market size and forecast 2025-2030

Chart on Indonesia - Market size and forecast 2025-2030 ($ million)
Data Table on Indonesia - Market size and forecast 2025-2030 ($ million)
Chart on Indonesia - Year-over-year growth 2025-2030 (%)
Data Table on Indonesia - Year-over-year growth 2025-2030 (%)

12.6 Middle East and Africa - Market size and forecast 2025-2030

Chart on Middle East and Africa - Market size and forecast 2025-2030 ($ million)
Data Table on Middle East and Africa - Market size and forecast 2025-2030 ($ million)
Chart on Middle East and Africa - Year-over-year growth 2025-2030 (%)
Data Table on Middle East and Africa - Year-over-year growth 2025-2030 (%)
Chart on Regional Comparison - Middle East and Africa
Data Table on Regional Comparison - Middle East and Africa

12.6.1 Saudi Arabia - Market size and forecast 2025-2030

Chart on Saudi Arabia - Market size and forecast 2025-2030 ($ million)
Data Table on Saudi Arabia - Market size and forecast 2025-2030 ($ million)
Chart on Saudi Arabia - Year-over-year growth 2025-2030 (%)
Data Table on Saudi Arabia - Year-over-year growth 2025-2030 (%)

12.6.2 UAE - Market size and forecast 2025-2030

Chart on UAE - Market size and forecast 2025-2030 ($ million)
Data Table on UAE - Market size and forecast 2025-2030 ($ million)
Chart on UAE - Year-over-year growth 2025-2030 (%)
Data Table on UAE - Year-over-year growth 2025-2030 (%)

12.6.3 South Africa - Market size and forecast 2025-2030

Chart on South Africa - Market size and forecast 2025-2030 ($ million)
Data Table on South Africa - Market size and forecast 2025-2030 ($ million)
Chart on South Africa - Year-over-year growth 2025-2030 (%)
Data Table on South Africa - Year-over-year growth 2025-2030 (%)

12.6.4 Israel - Market size and forecast 2025-2030

Chart on Israel - Market size and forecast 2025-2030 ($ million)
Data Table on Israel - Market size and forecast 2025-2030 ($ million)
Chart on Israel - Year-over-year growth 2025-2030 (%)
Data Table on Israel - Year-over-year growth 2025-2030 (%)

12.6.5 Turkey - Market size and forecast 2025-2030

Chart on Turkey - Market size and forecast 2025-2030 ($ million)
Data Table on Turkey - Market size and forecast 2025-2030 ($ million)
Chart on Turkey - Year-over-year growth 2025-2030 (%)
Data Table on Turkey - Year-over-year growth 2025-2030 (%)

12.7 South America - Market size and forecast 2025-2030

Chart on South America - Market size and forecast 2025-2030 ($ million)
Data Table on South America - Market size and forecast 2025-2030 ($ million)
Chart on South America - Year-over-year growth 2025-2030 (%)
Data Table on South America - Year-over-year growth 2025-2030 (%)
Chart on Regional Comparison - South America
Data Table on Regional Comparison - South America

12.7.1 Brazil - Market size and forecast 2025-2030

Chart on Brazil - Market size and forecast 2025-2030 ($ million)
Data Table on Brazil - Market size and forecast 2025-2030 ($ million)
Chart on Brazil - Year-over-year growth 2025-2030 (%)
Data Table on Brazil - Year-over-year growth 2025-2030 (%)

12.7.2 Argentina - Market size and forecast 2025-2030

Chart on Argentina - Market size and forecast 2025-2030 ($ million)
Data Table on Argentina - Market size and forecast 2025-2030 ($ million)
Chart on Argentina - Year-over-year growth 2025-2030 (%)
Data Table on Argentina - Year-over-year growth 2025-2030 (%)

12.7.3 Colombia - Market size and forecast 2025-2030

Chart on Colombia - Market size and forecast 2025-2030 ($ million)
Data Table on Colombia - Market size and forecast 2025-2030 ($ million)
Chart on Colombia - Year-over-year growth 2025-2030 (%)
Data Table on Colombia - Year-over-year growth 2025-2030 (%)

12.8 Market opportunity by geography

Market opportunity by geography ($ million)
Data Tables on Market opportunity by geography ($ million)

13. Drivers, Challenges, and Opportunity

13.1 Market drivers

Increasing global participation and expansion of off-course golfing venues
Technological innovations in material science and aerodynamic engineering
Strategic emphasis on sustainability and environmentally conscious manufacturing

13.2 Market challenges

Regulatory hurdles and global distance rollback mandate
Ecological concerns and microplastic pollution regulations
Raw material volatility and chemical supply chain disruption

13.3 Impact of drivers and challenges

Impact of drivers and challenges in 2025 and 2030

13.4 Market opportunities

Strategic emphasis on sustainability and environmentally conscious manufacturing
Transition toward sustainable and bio-based materials
Growth of visual technology and personalized customization

14. Competitive Landscape

14.1 Overview

14.2

Overview on criticality of inputs and factors of differentiation

14.3 Landscape disruption

Overview on factors of disruption

14.4 Industry risks

Impact of key risks on business

15. Competitive Analysis

15.1 Companies profiled

Companies covered

15.2 Company ranking index

15.3 Market positioning of companies

Matrix on companies position and classification

15.4 Acushnet Holdings Corp.

Acushnet Holdings Corp. - Overview
Acushnet Holdings Corp. - Product / Service
Acushnet Holdings Corp. - Key news
Acushnet Holdings Corp. - Key offerings
SWOT

15.5 Bridgestone Golf Inc.

Bridgestone Golf Inc. - Overview
Bridgestone Golf Inc. - Product / Service
Bridgestone Golf Inc. - Key offerings
SWOT

15.6 Chromax Golf

Chromax Golf - Overview
Chromax Golf - Product / Service
Chromax Golf - Key offerings
SWOT

15.7 Costco Wholesale Corp.

Costco Wholesale Corp. - Overview
Costco Wholesale Corp. - Business segments
Costco Wholesale Corp. - Key offerings
Costco Wholesale Corp. - Segment focus
SWOT

15.8 Cut Golf

Cut Golf - Overview
Cut Golf - Product / Service
Cut Golf - Key offerings
SWOT

15.9 Decathlon SA

Decathlon SA - Overview
Decathlon SA - Product / Service
Decathlon SA - Key offerings
SWOT

15.10 Dixon Golf

Dixon Golf - Overview
Dixon Golf - Product / Service
Dixon Golf - Key offerings
SWOT

15.11 Honma Golf Co. Ltd.

Honma Golf Co. Ltd. - Overview
Honma Golf Co. Ltd. - Product / Service
Honma Golf Co. Ltd. - Key offerings
SWOT

15.12 Nitro Golf

Nitro Golf - Overview
Nitro Golf - Product / Service
Nitro Golf - Key offerings
SWOT

15.13 OnCore Golf Tech.

OnCore Golf Tech. - Overview
OnCore Golf Tech. - Product / Service
OnCore Golf Tech. - Key offerings
SWOT

15.14 Pearl Golf

Pearl Golf - Overview
Pearl Golf - Product / Service
Pearl Golf - Key offerings
SWOT

15.15 Piper Golf

Piper Golf - Overview
Piper Golf - Product / Service
Piper Golf - Key offerings
SWOT

15.16 RZN Golf

RZN Golf - Overview
RZN Golf - Product / Service
RZN Golf - Key offerings
SWOT

15.17 Seed Golf

Seed Golf - Overview
Seed Golf - Product / Service
Seed Golf - Key offerings
SWOT

15.18 Snell Golf

Snell Golf - Overview
Snell Golf - Product / Service
Snell Golf - Key offerings
SWOT

16. Appendix

16.1 Scope of the report

Market definition
Objectives
Notes and caveats

16.2 Inclusions and exclusions checklist

Inclusions checklist
Exclusions checklist

16.3 Currency conversion rates for US$

16.4 Research methodology

16.5 Data procurement

Information sources

16.6 Data validation

16.7 Validation techniques employed for market sizing

16.8 Data synthesis

16.9 360 degree market analysis

16.10 List of abbreviations

Research Methodology

Technavio presents a detailed picture of the market by way of study, synthesis, and summation of data from multiple sources. The analysts have presented the various facets of the market with a particular focus on identifying the key industry influencers. The data thus presented is comprehensive, reliable, and the result of extensive research, both primary and secondary.

INFORMATION SOURCES

Primary sources

  • Manufacturers and suppliers
  • Channel partners
  • Industry experts
  • Strategic decision makers

Secondary sources

  • Industry journals and periodicals
  • Government data
  • Financial reports of key industry players
  • Historical data
  • Press releases

DATA ANALYSIS

Data Synthesis

  • Collation of data
  • Estimation of key figures
  • Analysis of derived insights

Data Validation

  • Triangulation with data models
  • Reference against proprietary databases
  • Corroboration with industry experts

REPORT WRITING

Qualitative

  • Market drivers
  • Market challenges
  • Market trends
  • Five forces analysis

Quantitative

  • Market size and forecast
  • Market segmentation
  • Geographical insights
  • Competitive landscape

Interested in this report?

Get your sample now to see our research methodology and insights!

Download Now

Frequently Asked Questions

Golf Balls market growth will increase by USD 390.8 million during 2026-2030.

The Golf Balls market is expected to grow at a CAGR of 4.1% during 2026-2030.

Golf Balls market is segmented by Type (Two piece balls, Three piece balls, Four piece balls, Others) Price range (Mid-range balls, Premium balls, Low-cost balls) Distribution channel (Offline, Online)

Acushnet Holdings Corp., Bridgestone Golf Inc., Chromax Golf, Costco Wholesale Corp., Cut Golf, Decathlon SA, Dixon Golf, Honma Golf Co. Ltd., Nitro Golf, OnCore Golf Tech., Pearl Golf, Piper Golf, RZN Golf, Seed Golf, Snell Golf, Taylor Made Golf Co. Inc., Topgolf Callaway Brands Corp., Trust Golf, Vice Sporting Goods GmbH, Wilson Sporting Goods Co. are a few of the key vendors in the Golf Balls market.

North America will register the highest growth rate of 38.9% among the other regions. Therefore, the Golf Balls market in North America is expected to garner significant business opportunities for the vendors during the forecast period.

US, Canada, Mexico, Germany, UK, France, Italy, The Netherlands, Spain, China, Japan, India, South Korea, Australia, Indonesia, Saudi Arabia, UAE, South Africa, Israel, Turkey, Brazil, Argentina, Colombia

  • Increasing global participation and expansion of off-course golfing venues is the driving factor this market.

The Golf Balls market vendors should focus on grabbing business opportunities from the Type segment as it accounted for the largest market share in the base year.
RIA - Research AI Assistant
Ask RIA