
Bio-Based Resins Market Size 2025-2029
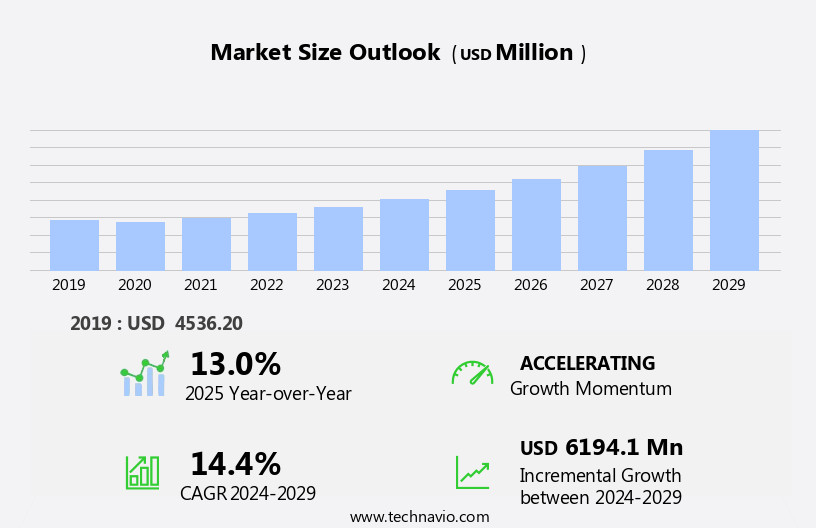
The bio-based resins market size is forecast to increase by USD 6.19 billion, at a CAGR of 14.4% between 2024 and 2029.
- The market is experiencing significant growth due to several key factors. Firstly, increasing environmental concerns have led to a greater demand for eco-friendly alternatives to conventional petroleum-based resins. Secondly, the introduction of new bio-based resin products continues to expand the market, offering improved performance and sustainability. Lastly, the cost-effectiveness of bio-based resins compared to their conventional counterparts is a major driving force for their adoption. These trends are expected to continue shaping the market in the coming years. Bio-based resins, derived from plants, sugar cane, soybean, whey, lignocellulose, algae, and other natural sources, offer a viable alternative to oil-based resins. Despite these opportunities, challenges remain, including the need for large-scale production and consistent quality to meet growing demand.
What will be the Size of the Market During the Forecast Period?
- The market is experiencing significant growth due to increasing demand for eco-friendly and sustainable materials in various industries. This trend is driven by the global shift towards green manufacturing and the circular economy, which prioritizes the use of renewable resources in material production. Bio-based resins, sourced from plants, sugar cane, soybeans, whey, lignocellulose, algae, and other natural materials, provide a sustainable alternative to oil-based resins. These plant-based materials are finding applications in diverse sectors, including automotive design for lightweight and aerodynamic components, renewable packaging, biopolymer applications, and biodegradable packaging.
- Sustainable product development is a key focus area for companies, leading to the emergence of compostable packaging, eco-friendly vehicle components, and plant-based plastics. Renewable resource utilization, such as potato starch and natural fibers, is also gaining traction in materials for construction and composites for automotive. Certification and sustainability reports are essential for companies to demonstrate their commitment to sustainability and transparency in production processes. Bio-based epoxys and bio-based acrylics are also emerging as promising alternatives to their oil-based counterparts. Overall, the market is poised for continued growth as industries seek to reduce their carbon footprint and promote sustainable manufacturing practices.
How is this Bio-Based Resins Industry segmented and which is the largest segment?
The industry research report provides comprehensive data (region-wise segment analysis), with forecasts and estimates in "USD billion" for the period 2025-2029, as well as historical data from 2019-2023 for the following segments.
- Type
- Non-biodegradable
- Biodegradable
- Application
- Consumer goods
- Automotive
- Packaging
- Others
- Geography
- Europe
- Germany
- UK
- France
- Italy
- APAC
- China
- India
- Japan
- South Korea
- North America
- US
- South America
- Brazil
- Middle East and Africa
- Europe
By Type Insights
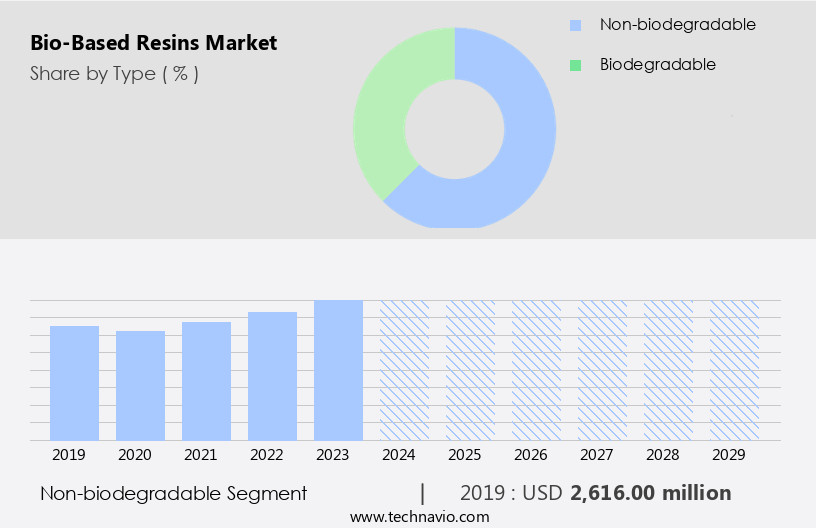
- The non-biodegradable segment is estimated to witness significant growth during the forecast period.
The market encompasses a notable segment of non-biodegradable resins, derived from renewable resources, delivering the same performance characteristics as conventional resins while maintaining durability and strength over extended periods. Bio-based Polyethylene (PE) and Polypropylene (PP) are prime examples, extensively utilized in sectors such as packaging, agriculture, automotive, and textiles. Bio-PE offers enhanced sustainability in packaging applications, while bio-PP is integral to the production of high-performance composites and automotive parts. Renewable plant materials, including corn, sugar beet, and soybean, serve as feedstocks for these bio-derived components.
The adoption of bio-based resins is fueled by environmental sustainability, consumer awareness, and technological advancements, which contribute to reduced carbon emissions, eco-friendly materials, and improved thermal stability. Bio-PET, polylactic acid, and starch blends are other significant bio-based resins, offering competitive alternatives to traditional counterparts. The integration of bio-based feedstocks into resin production not only reduces the ecological footprint but also minimizes environmental pollution and contributes to sustainable solutions.
Get a glance at the Industry report of share of various segments Request Free Sample
The non-biodegradable segment was valued at USD 2.62 billion in 2019 and showed a gradual increase during the forecast period.
Regional Analysis
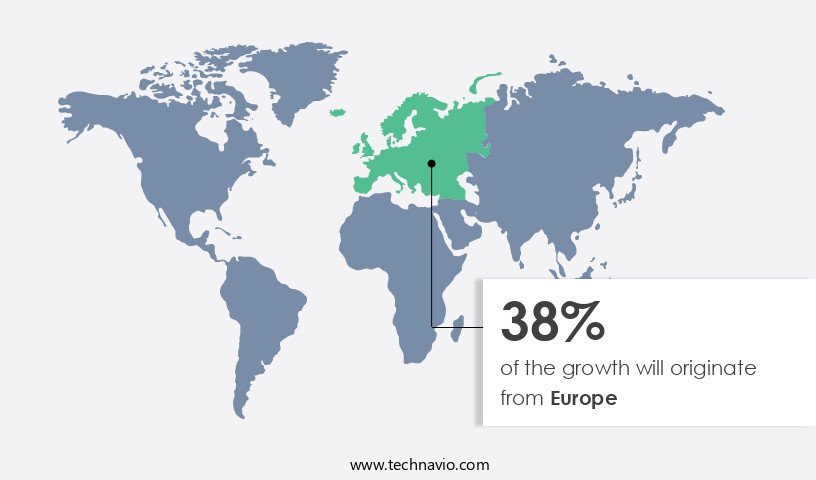
- Europe is estimated to contribute 38% to the growth of the global market during the forecast period.
Technavio's analysts have elaborately explained the regional trends and drivers that shape the market during the forecast period.
For more insights on the market share of various regions, Request Free Sample
The European market is experiencing significant growth due to increasing environmental regulations and consumer preference for sustainable solutions. Countries like Germany, France, and Italy are at the forefront of this trend, integrating eco-friendly materials into various sectors, including packaging, automotive, and construction. In 2023, the European construction sector accounted for 4-7% of the region's GDP. Government initiatives have surged to promote lightweight and sustainable construction materials, with the European Green Deal (EGD) being a key driver. This ambitious plan aims to make Europe climate-neutral by 2050. Bio-based resins derived from renewable plant materials, such as algae, corn, sugar beet, and soybean, are increasingly used in high-performance composites, vehicle parts, and packaging applications. These materials offer improved durability, thermal stability, and reduced ecological footprints. Sustainable practices, such as the use of bio-derived components, have gained traction due to their environmental benefits and potential for carbon emissions reduction. Technological advancements in biotechnology and chemical sustainability continue to fuel innovation In the market.
Market Dynamics
Our market researchers analyzed the data with 2024 as the base year, along with the key drivers, trends, and challenges. A holistic analysis of drivers will help companies refine their marketing strategies to gain a competitive advantage.
What are the key market drivers leading to the rise In the adoption of Bio-Based Resins Industry?
Growing environmental concerns is the key driver of the market.
- The market is experiencing significant growth due to increasing environmental concerns and the need for sustainable alternatives to traditional fossil-based resins. Plastic pollution, which contributes an estimated 19-23 million tonnes to aquatic ecosystems annually, is a major issue driving this demand. This pollution disrupts habitats, hinders climate adaptation efforts, and poses threats to livelihoods, food production, and social well-being. To address these concerns, there is a growing emphasis on eco-friendly materials, such as bio-based resins, which are derived from renewable plant materials like algae, sugar beet, corn, soybean, and lignocellulose. These resins offer improved environmental sustainability, as they have lower carbon emissions, reduced ecological footprints, and are biodegradable.
- They are used in various applications, including clamshells, buckets, vehicle parts, seat fillers, trays, jars, bottles, and composites. High-performance composites made from bio-based feedstocks, such as polylactic acid, offer enhanced mechanical properties and thermal stability. The use of bio-derived components in eco-friendly materials is also contributing to the reduction of landfill waste and environmental pollution. Technological advancements in biotechnology and the availability of subsidies for sustainable practices are further boosting the market growth. Consumer awareness and the demand for sustainable solutions are also increasing, making bio-based resins a preferred choice for industries seeking to reduce their carbon footprint and improve their overall sustainability.
What are the market trends shaping the Bio-Based Resins Industry?
The introduction of new products is the upcoming market trend.
- The market is experiencing notable growth as companies introduce eco-friendly alternatives to traditional fossil-based resins. These new bio-based resins, such as those derived from algae, corn, sugar beet, soybean, and lignocellulose, offer comparable performance to their fossil-counterparts while reducing environmental impact. For instance, on August 17, 2023, SABIC launched bio-based versions of its NORYL resin grades In the US, utilizing polyphenylene ether (PPE) feedstocks certified under the International Sustainability and Carbon Certification (ISCC) PLUS. These resins provide similar properties to conventional grades, broadening the range of sustainable NORYL resins. This trend is driven by increasing consumer awareness and the need for sustainable practices in various industries, including automotive, packaging, and consumer goods.
- Bio-based resins derived from renewable plant materials, such as polylactic acid, bio-polyethylene terephthalate, and starch blends, offer improved thermal stability, durability, and carbon emissions reduction. Government subsidies and technological advancements in biotechnology further fuel the market's growth. These are used in various applications, such as clamshells, buckets, trays, vehicle parts, seat fillers, jars, bottles, composites, and high-performance composites. The use of eco-friendly materials In these industries not only reduces their ecological footprints but also enhances their overall sustainability and fuel efficiency.
What challenges does the Bio-Based Resins Industry face during its growth?
The cost-effectiveness of conventional resins is a key challenge affecting the industry growth.
- The market is experiencing significant growth due to the increasing demand for eco-friendly and sustainable materials in various industries. Bio-based resins, derived from renewable plant materials such as algae, sugar beet, corn, and soybean, offer several advantages over conventional resins. These include improved environmental sustainability, reduced carbon emissions, and lower ecological footprints. However, the market faces challenges, including the relatively higher cost of bio-based resins compared to conventional resins. This price disparity is primarily due to the lack of advanced technology and the limited availability of feedstocks, which drive up the prices of bio-based materials. For instance, corn, a common feedstock for bioplastics, has seen rising prices due to increased demand for food and biofuels.
- As a result, the cost of producing bio-based resins is significantly higher than that of conventional resins. Nevertheless, technological advancements and subsidies for the production of bio-based resins are expected to mitigate these challenges and make bio-based resins more competitive In the market. The use of bio-based resins in various applications, including clamshells, buckets, vehicle parts, seat fillers, trays, jars, bottles, composites, and high-performance composites, is on the rise due to their superior performance, durability, and environmental sustainability. Bio-based resins offer excellent thermal stability and mechanical properties, making them suitable for use in a wide range of industries. The increasing consumer awareness and preference for eco-friendly materials are also driving the demand for bio-based resins.
Exclusive Customer Landscape
The market forecasting report includes the adoption lifecycle of the market, covering from the innovator's stage to the laggard's stage. It focuses on adoption rates in different regions based on penetration. Furthermore, the market report also includes key purchase criteria and drivers of price sensitivity to help companies evaluate and develop their market growth analysis strategies.

Customer Landscape
Key Companies & Market Insights
Companies are implementing various strategies, such as strategic alliances, market forecast, partnerships, mergers and acquisitions, geographical expansion, and product/service launches, to enhance their presence In the industry.
Archer Daniels Midland Co. - The company offers bio-based resins such as propylene glycol, a versatile bio-based product that can be used across various markets in place of traditional petroleum-based products.
The industry research and growth report includes detailed analyses of the competitive landscape of the market and information about key companies, including:
- Arkema
- Ashland Inc.
- BASF SE
- Biotec GmbH Co. and KG
- Braskem SA
- Corbion nv
- Covestro AG
- Danimer Scientific Inc.
- DuPont de Nemours Inc.
- Exel Composites
- Futerro SA
- Huntsman Corp.
- Lamberti SpA
- Minima Technology Co. Ltd.
- NatureWorks LLC
- Nexeo Plastics LLC
- Novamont S.p.A.
- Saudi Basic Industries Corp.
- Trinseo PLC
- Yield10 Bioscience Inc.
Qualitative and quantitative analysis of companies has been conducted to help clients understand the wider business environment as well as the strengths and weaknesses of key industry players. Data is qualitatively analyzed to categorize companies as pure play, category-focused, industry-focused, and diversified; it is quantitatively analyzed to categorize companies as dominant, leading, strong, tentative, and weak.
Research Analyst Overview
The market represents a significant shift In the plastics industry, as demand for eco-friendly and sustainable alternatives to traditional fossil fuel-derived resins continues to grow. This market encompasses a diverse range of products derived from renewable plant materials, including polylactic acid (PLA), polyhydroxyalkanoate (PHA), and starch blends, among others. Bio-based resins offer several advantages over their fossil fuel counterparts. They are derived from renewable resources, reducing reliance on non-renewable feedstocks and contributing to a more sustainable production process. Additionally, the use of bio-based resins can lead to reduced carbon emissions and a smaller ecological footprint. The market dynamics driving the growth of bio-based resins are diverse.
In addition, consumer awareness and demand for eco-friendly and sustainable products are key factors, as are subsidies and incentives for the use of renewable resources. Technological advancements In the production and processing of bio-based resins have also played a significant role in driving market growth. The mechanical properties of bio-based resins are comparable to those of traditional resins, making them suitable for use in various applications. For instance, they can be used to produce high-performance composites for use in vehicle parts and body panels. Additionally, they can be used to produce eco-friendly alternatives to traditional plastic products, such as bottles, jars, and trays.
Further, the production of bio-based resins involves the use of various feedstocks, including corn, sugar beet, soybeans, and lignocellulose. These feedstocks are converted into bio-derived components through biotechnological processes, resulting in resins with desirable properties. Despite the advantages of bio-based resins, there are challenges to their widespread adoption. These include the higher cost of production compared to traditional fossil fuel-derived resins and the need for sustainable and efficient production processes. However, as technological advancements continue to drive down production costs and improve efficiency, the market for bio-based resins is expected to continue to grow. The use of bio-based resins also presents opportunities for reducing environmental impact and pollution.
|
Market Scope |
|
|
Report Coverage |
Details |
|
Page number |
217 |
|
Base year |
2024 |
|
Historic period |
2019-2023 |
|
Forecast period |
2025-2029 |
|
Growth momentum & CAGR |
Accelerate at a CAGR of 14.4% |
|
Market Growth 2025-2029 |
USD 6.19 billion |
|
Market structure |
Fragmented |
|
YoY growth 2024-2025(%) |
13.0 |
|
Key countries |
US, Germany, China, France, Japan, South Korea, Italy, UK, Brazil, and India |
|
Competitive landscape |
Leading Companies, Market Positioning of Companies, Competitive Strategies, and Industry Risks |
What are the Key Data Covered in this Market Research and Growth Report?
- CAGR of the Bio-Based Resins industry during the forecast period
- Detailed information on factors that will drive the market growth and forecasting between 2025 and 2029
- Precise estimation of the size of the market and its contribution of the industry in focus to the parent market
- Accurate predictions about upcoming growth and trends and changes in consumer behaviour
- Growth of the market across Europe, APAC, North America, South America, and Middle East and Africa
- Thorough analysis of the market's competitive landscape and detailed information about companies
- Comprehensive analysis of factors that will challenge the market growth of industry companies
We can help! Our analysts can customize this market research report to meet your requirements.
 RIA -
RIA - 
