Grain Processing Equipment Market Size and Growth Forecast 2026-2030
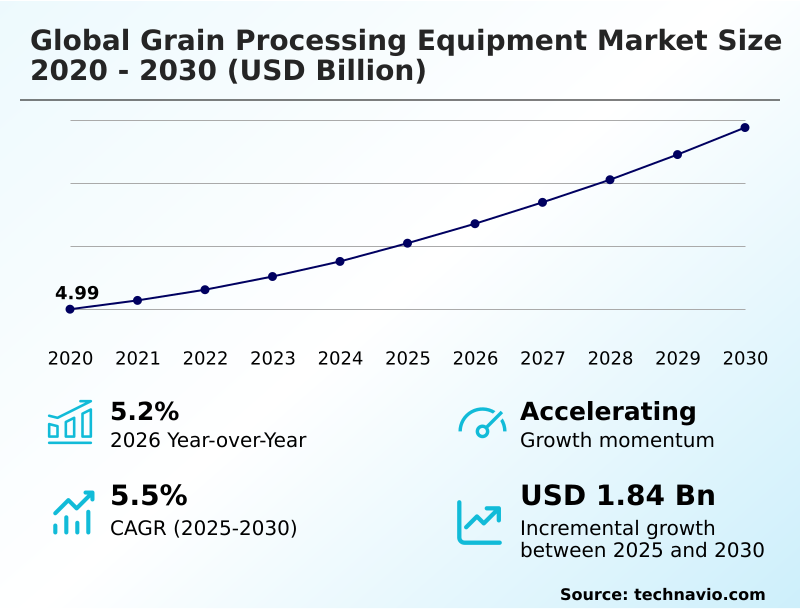
The Grain Processing Equipment Market size was valued at USD 6.04 billion in 2025 growing at a CAGR of 5.5% during the forecast period 2026-2030.
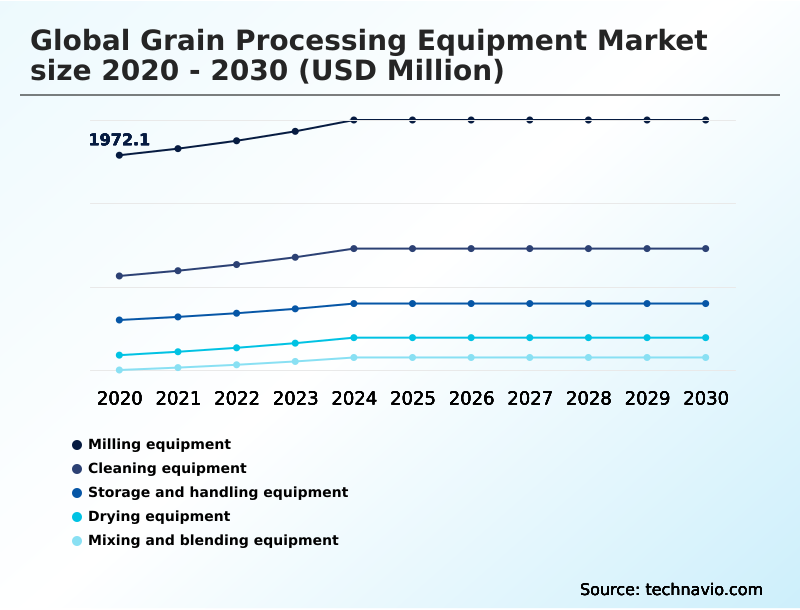
APAC accounts for 44.3% of incremental growth during the forecast period. The Milling equipment segment by Product was valued at USD 2.22 billion in 2024, while the Food processing companies segment holds the largest revenue share by End-user.
The market is projected to grow by USD 2.89 billion from 2020 to 2030, with USD 1.84 billion of the growth expected during the forecast period of 2025 to 2030.
Get Key Insights on Market Forecast (PDF) Request Free Sample
Grain Processing Equipment Market Overview
The grain processing equipment market is expanding, with a year-over-year growth of 5.2%, fueled by the dual pressures of ensuring global food security and maximizing operational efficiency. Processors are increasingly investing in sophisticated machinery to transform raw agricultural outputs into safe, shelf-stable products. This includes high-efficiency grain dryers to prevent mycotoxin formation and advanced seed and grain cleaners to meet stringent purity standards. A typical large-scale feed manufacturing facility, for instance, integrates heavy-duty pellet mills with automated grain conditioning systems and high-precision destoners to remove foreign materials before processing. By deploying gravity separators to classify grains by density, such a plant can improve its final feed conversion ratio by up to 5%, directly enhancing livestock performance and operational profitability, all while complying with feed safety regulations like the EU's Regulation (EC) No 183/2005.
Drivers, Trends, and Challenges in the Grain Processing Equipment Market
The strategic direction for capital investment planning for grain facility upgrades is increasingly shaped by the need for advanced digital oversight. The total cost of ownership for high-capacity silos, for example, is no longer just about steel and concrete but includes sophisticated systems for advanced aeration control for grain storage.
For procurement teams, the cost-benefit analysis of modular processing units often reveals a faster path to market for niche products compared to traditional turnkey solutions for flour mill construction.
A primary concern is achieving compliance with food safety modernization act, which drives the implementation of clean-in-place systems in feed mills and spurs projects for upgrading legacy grain handling systems for traceability. A facility focusing on optimizing energy consumption in continuous flow dryers can reduce its energy costs by over 20% compared to older cross-flow models.
In terms of processing, the challenges of flexible multi-grain processing lines are being addressed through machines incorporating sanitary design principles for grain processing machinery. Best practices for dust explosion mitigation, guided by NFPA 61 standards, are now integral to plant design.
The quest for quality involves reducing grain breakage in pneumatic conveying systems and achieving uniform particle size distribution in milling. On the digital front, the focus is on integrating ai in grain optical sorting and developing automation strategies for small-scale grain mills. This digital shift, however, brings cybersecurity risks in interconnected milling plants, a top concern for operational continuity.
The impact of raw material volatility on equipment procurement remains a constant pressure, making the roi on automated grain packaging lines and the adoption of predictive maintenance for industrial milling equipment critical metrics for financial justification.
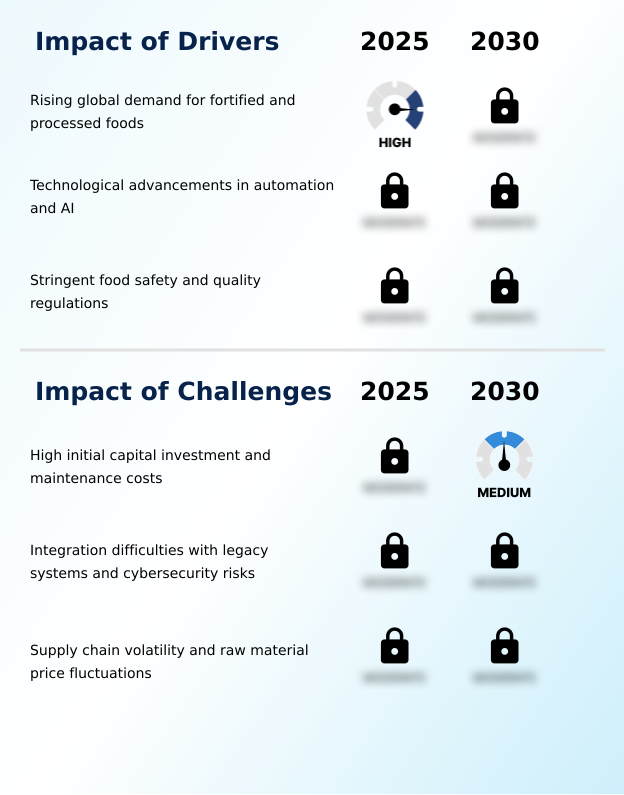
Primary Growth Driver: The rising global demand for fortified and processed foods, driven by urbanization and health consciousness, is a primary driver for the market.
A major driver is the global enforcement of stringent food fortification standards, compelling processors to invest in equipment that can guarantee nutritional value.
This necessitates machinery with advanced sanitary equipment design to prevent contamination and comply with regulations like the Food Safety Modernization Act (FSMA).
To meet fortification mandates, facilities are adopting high-precision automated dosing systems and comprehensive solutions for traceability in grain processing.
Demand from food processing companies, the largest end-user segment, is also pushing the adoption of high-speed optical sorters equipped with AI to enhance purity and yield. This technological uptake is critical for maintaining consumer trust and market access.
Emerging Market Trend: A notable trend is the shift toward energy-efficient and sustainable processing machinery, driven by both regulatory pressures and operational cost-saving objectives.
A key trend is the adoption of modular processing units, offering flexibility for decentralized agriculture and reducing post-harvest losses. This shift supports the growing demand for multi-grain processing capabilities to handle diverse crops like quinoa and millet.
Simultaneously, there's a strong push for energy-efficient milling solutions and advanced fluidized bed dryers to lower operational costs and meet sustainability mandates under frameworks like the EU's Ecodesign Directive. These smart systems often incorporate predictive maintenance for mills, using sensor data to prevent downtime.
This trend is particularly pronounced in APAC, which shows a significant growth rate of 6.4%, as operators seek to balance scalability with efficiency.
Key Industry Challenge: High initial capital investment and subsequent maintenance costs for advanced machinery present a significant challenge to market growth, particularly for smaller enterprises.
Significant challenges restrain market growth, led by the complexities of capital investment planning for grain facility upgrades, where high upfront costs deter many small-to-medium enterprises. The impact of raw material volatility on equipment procurement further complicates financial forecasting, making long-term investment risky. For existing facilities, the process of upgrading legacy grain handling systems is fraught with integration difficulties.
Moreover, the shift toward interconnected digital platforms introduces significant cybersecurity risks in interconnected milling plants, which requires substantial investment in defense mechanisms compliant with standards like IEC 62443. These financial and technical hurdles collectively slow the adoption rate of modern, efficient processing technologies.
Explore Full Market Dynamics Analysis Request Free Sample
Grain Processing Equipment Market Segmentation
The grain processing equipment industry research report provides comprehensive data including region-wise segment analysis, with forecasts and analysis for the period 2026-2030, as well as historical data from 2020-2024 for the following segments.
Product Segment Analysis
The milling equipment segment is estimated to witness significant growth during the forecast period.
The Milling equipment segment, representing the largest market share, is foundational to transforming raw grains into consumable products. The operational efficiency of core components, including precision-engineered roller mills and high-impact hammer mills, directly dictates extraction rates and profitability.
These systems work in concert with advanced plansifters to separate bran and germ, ensuring uniform particle size distribution crucial for downstream baking performance. Integrated grain conditioning systems optimize moisture content prior to grinding, enhancing consistency.
The entire process relies on sophisticated pneumatic conveying systems to move materials hygienically, adhering to food safety management standards such as ISO 22000, while minimizing grain breakage and cross-contamination within the facility.
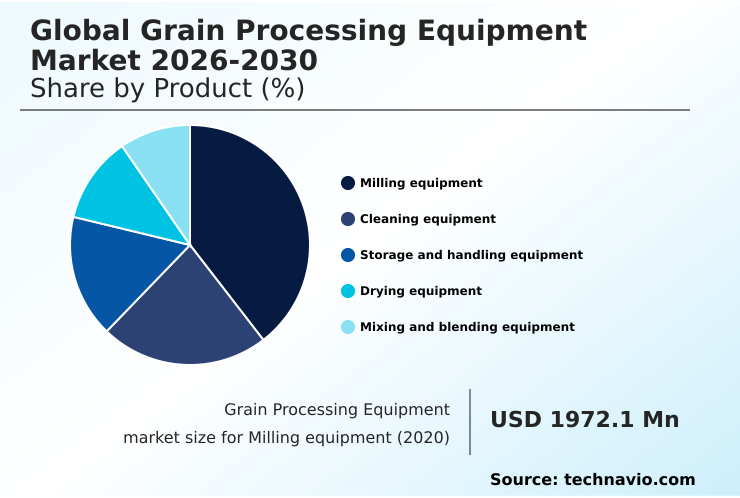
The Milling equipment segment was valued at USD 2.22 billion in 2024 and showed a gradual increase during the forecast period.
Grain Processing Equipment Market by Region: APAC Leads with 44.3% Growth Share
APAC is estimated to contribute 44.3% to the growth of the global market during the forecast period.
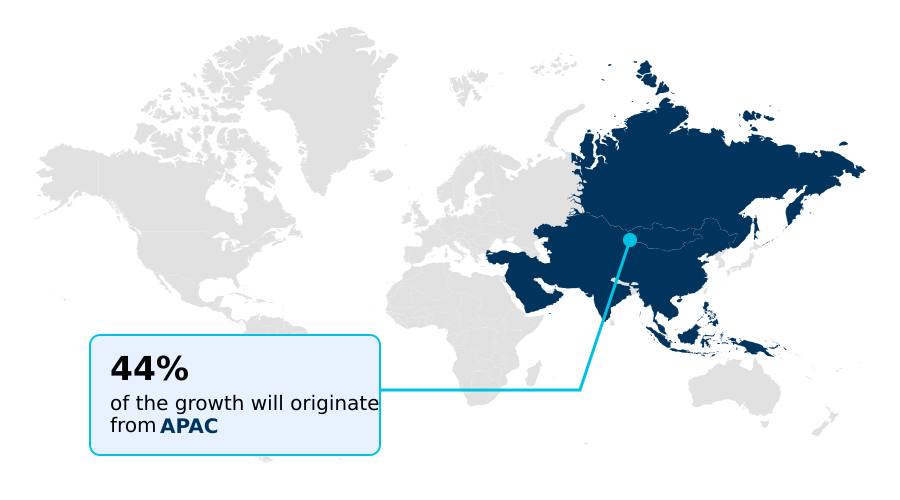
The geographic landscape is dominated by APAC, which is projected to contribute 44.3% of the market's incremental growth.
This expansion is driven by the need to secure food supplies for vast populations, necessitating massive investments in infrastructure, including high-capacity storage silos and advanced aeration systems to reduce post-harvest losses.
In contrast, North America's mature market focuses on upgrading existing facilities with automated belt conveyors and high-efficiency grain augers to improve logistical throughput.
In the Middle East, a reliance on imports fuels demand for large-scale portside handling equipment at strategic maritime hubs.
Across all regions, equipment must meet local operational health and safety standards, such as those set by OSHA in the US, governing machinery guarding and dust control.
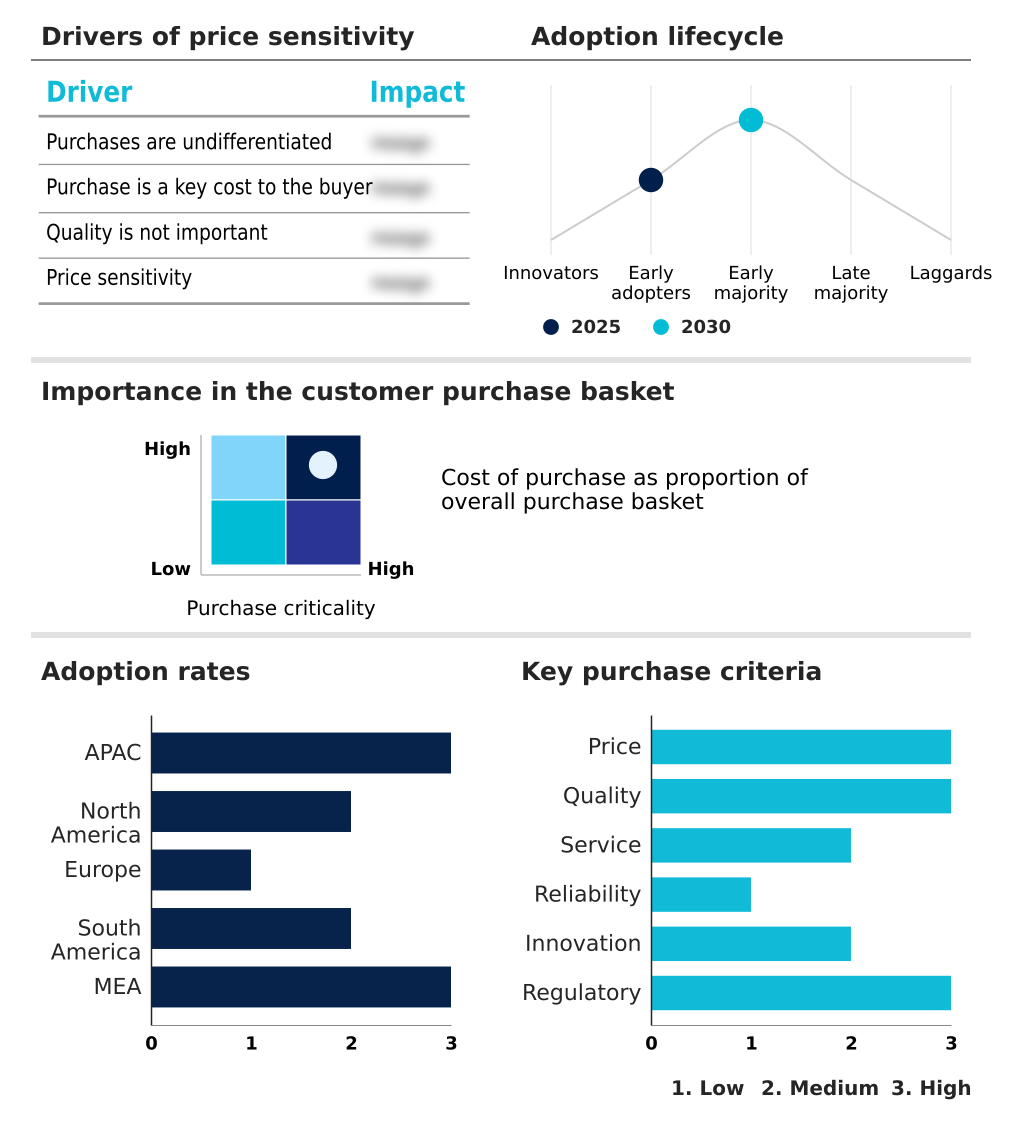
Customer Landscape Analysis for the Grain Processing Equipment Market
The grain processing equipment market forecasting report includes the adoption lifecycle of the market, covering from the innovator’s stage to the laggard’s stage. It focuses on adoption rates in different regions based on penetration. Furthermore, the grain processing equipment market report also includes key purchase criteria and drivers of price sensitivity to help companies evaluate and develop their market growth analysis strategies.
Competitive Landscape of the Grain Processing Equipment Market
Companies are implementing various strategies, such as strategic alliances, partnerships, mergers and acquisitions, geographical expansion, and product/service launches, to enhance their presence in the grain processing equipment market industry.
Ag Growth International Inc. - A portfolio of integrated equipment spans farm-to-commercial applications, offering comprehensive solutions for grain storage, handling, and processing needs.
The industry research and growth report includes detailed analyses of the competitive landscape of the market and information about key companies, including:
- Ag Growth International Inc.
- AGCO Corp.
- Alvan Blanch Development Co.
- Behlen Mfg Co.
- Bratney
- BROCK GRAIN SYSTEMS.
- Buhler AG
- Chief Agri Industrial Group
- Cimbria
- Duravant LLC
- Forsbergs Inc.
- GEA Group AG
- Golfetto Sangati S.r.l.
- Ocrim S.p.A
- Ottevanger
- PETKUS Technologie GmbH
- Pfeuffer GmbH
- Prater Industries Inc.
- Sangati Berga S.A.
- Satake Corp.
Qualitative and quantitative analysis of companies has been conducted to help clients understand the wider business environment as well as the strengths and weaknesses of key industry players. Data is qualitatively analyzed to categorize companies as pure play, category-focused, industry-focused, and diversified; it is quantitatively analyzed to categorize companies as dominant, leading, strong, tentative, and weak.
Recent Developments in the Grain Processing Equipment Market
- In January 2025, AGCO Corp. announced an investment of approximately $95 million to establish a new parts distribution center in France, enhancing its service and support infrastructure for agricultural machinery in Europe.
- In November 2024, Fourth Milling Co. initiated construction on its new facility in Al-Kharj, following a civil works contract valued at approximately $70.7 million, to build a large-scale flour mill and feed production plant.
- In September 2024, Bartlett, a subsidiary of Savage, completed its acquisition of Ceres Global Ag Corp., a Minnesota-based company, expanding its agricultural supply chain solutions across the U.S. Northern Plains and Canada.
- In April 2025, Bunge finalized its merger with Viterra Limited, creating a premier global agribusiness solutions provider to serve the food, feed, and fuel sectors with enhanced vertical integration.
Research Analyst Overview: Grain Processing Equipment Market
The operational focus is shifting from throughput alone to a balance of efficiency, hygiene, and traceability, compelling boardroom-level reviews of capital expenditure strategies. While milling equipment remains the largest market segment, driven by the need for advanced roller mills and hammer mills, the supporting infrastructure is where key innovations are occurring.
The integration of AI-powered optical sorters and efficient aspiration channels is becoming a vendor qualification criterion, not a luxury. In North America, where the market is growing steadily at 4.7%, facilities are retrofitting legacy bucket elevators and pneumatic conveying systems to reduce grain damage and energy use.
The decision to invest in automated clean-in-place systems is now directly tied to mitigating recall risks and ensuring compliance with the Food Safety Modernization Act (FSMA), transforming it from a maintenance cost to a critical risk management tool.
Dive into Technavio’s robust research methodology, blending expert interviews, extensive data synthesis, and validated models for unparalleled Grain Processing Equipment Market insights. See full methodology.
| Market Scope | |
|---|---|
| Page number | 307 |
| Base year | 2025 |
| Historic period | 2020-2024 |
| Forecast period | 2026-2030 |
| Growth momentum & CAGR | Accelerate at a CAGR of 5.5% |
| Market growth 2026-2030 | USD 1838.4 million |
| Market structure | Fragmented |
| YoY growth 2025-2026(%) | 5.2% |
| Key countries | China, India, Japan, Australia, South Korea, Indonesia, US, Canada, Mexico, Germany, France, UK, Italy, Spain, The Netherlands, Brazil, Argentina, Colombia, South Africa, Turkey, Saudi Arabia, UAE and Israel |
| Competitive landscape | Leading Companies, Market Positioning of Companies, Competitive Strategies, and Industry Risks |
Grain Processing Equipment Market: Key Questions Answered in This Report
-
What is the expected growth of the Grain Processing Equipment Market between 2026 and 2030?
-
The Grain Processing Equipment Market is expected to grow by USD 1.84 billion during 2026-2030, registering a CAGR of 5.5%. Year-over-year growth in 2026 is estimated at 5.2%%. This acceleration is shaped by rising global demand for fortified and processed foods, which is intensifying demand across multiple end-use verticals covered in the report.
-
-
What segmentation does the market report cover?
-
The report is segmented by Product (Milling equipment, Cleaning equipment, Storage and handling equipment, Drying equipment, and Mixing and blending equipment), End-user (Food processing companies, Flour mills, Feed manufacturers, Grain mills, and Ethanol producers), Type (Automatic, and Semi-automatic) and Geography (APAC, North America, Europe, South America, Middle East and Africa). Among these, the Milling equipment segment is estimated to witness significant growth during the forecast period, driven by rising adoption across key application areas. Each segment includes detailed qualitative and quantitative analysis, along with historical data from 2020-2024 and forecasts through 2030 with year-over-year growth rates.
-
-
Which regions are analyzed in the report?
-
The report covers APAC, North America, Europe, South America and Middle East and Africa. APAC is estimated to contribute 44.3% to market growth during the forecast period. Country-level analysis includes China, India, Japan, Australia, South Korea, Indonesia, US, Canada, Mexico, Germany, France, UK, Italy, Spain, The Netherlands, Brazil, Argentina, Colombia, South Africa, Turkey, Saudi Arabia, UAE and Israel, with dedicated market size tables and year-over-year growth for each.
-
-
What are the key growth drivers and market challenges?
-
The primary driver is rising global demand for fortified and processed foods, which is accelerating investment and industry demand. The main challenge is high initial capital investment and maintenance costs, creating operational barriers for key market participants. The report quantifies the impact of each driver and challenge across 2026 and 2030 with comparative analysis.
-
-
Who are the major players in the Grain Processing Equipment Market?
-
Key vendors include Ag Growth International Inc., AGCO Corp., Alvan Blanch Development Co., Behlen Mfg Co., Bratney, BROCK GRAIN SYSTEMS., Buhler AG, Chief Agri Industrial Group, Cimbria, Duravant LLC, Forsbergs Inc., GEA Group AG, Golfetto Sangati S.r.l., Ocrim S.p.A, Ottevanger, PETKUS Technologie GmbH, Pfeuffer GmbH, Prater Industries Inc., Sangati Berga S.A. and Satake Corp.. The report provides qualitative and quantitative analysis categorizing companies as dominant, leading, strong, tentative, and weak based on their market positioning. Company profiles include business segment analysis, SWOT assessment, key offerings, and recent strategic developments.
-
Grain Processing Equipment Market Research Insights
Market dynamics are heavily influenced by the global imperative for post-harvest loss reduction, driving investment in technologies for superior bulk material handling and storage. Facilities are deploying advanced grain quality monitoring sensors to optimize conditions and prevent spoilage, a key focus under frameworks like the FAO's Save Food Initiative.
The operational shift toward automation is evident in the adoption of high-speed automated packaging systems, which enhance throughput while reducing labor dependency. This trend is most prominent in APAC, which accounts for over 44% of incremental growth, significantly outpacing North America's contribution of around 21.5%.
Concurrently, stringent safety mandates like ATEX directives in Europe compel the integration of certified equipment for dust explosion prevention in all new and upgraded facilities.
We can help! Our analysts can customize this grain processing equipment market research report to meet your requirements.
 RIA -
RIA - 
