
Green Building Materials Market Size 2025-2029
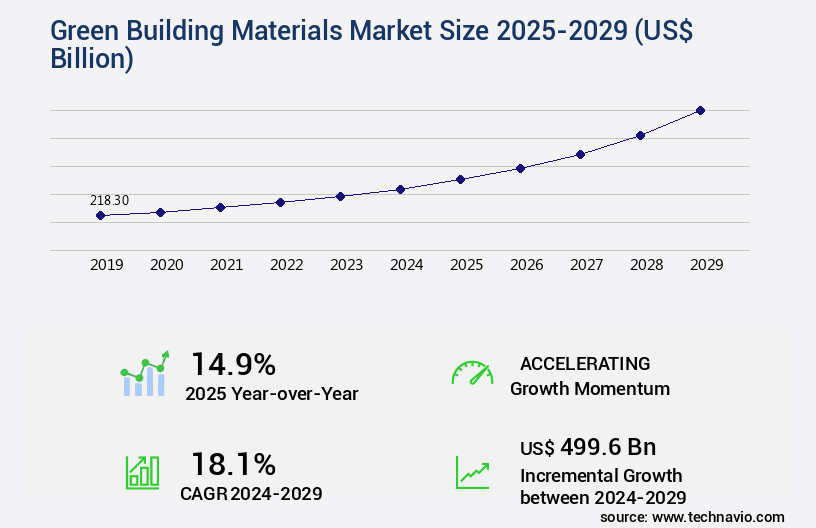
The green building materials market size is valued to increase by USD 499.6 billion, at a CAGR of 18.1% from 2024 to 2029. Rising need for energy-efficient green buildings will drive the green building materials market.
Major Market Trends & Insights
- APAC dominated the market and accounted for a 34% growth during the forecast period.
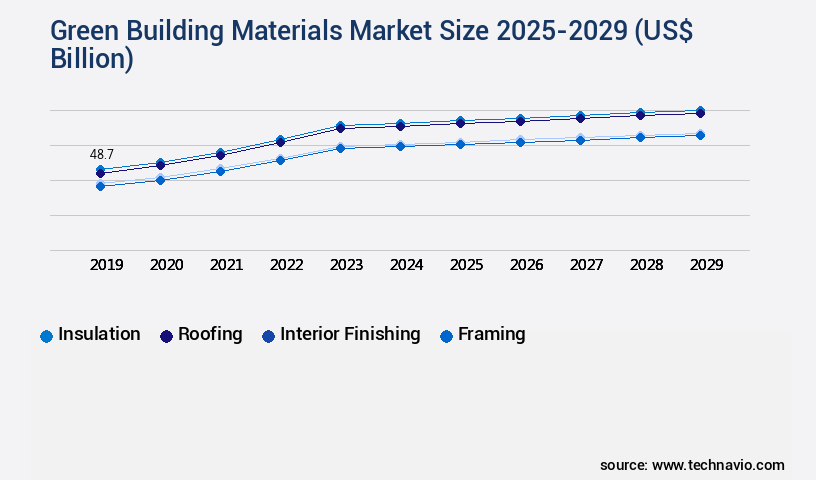
- By Application - Insulation segment was valued at USD 48.70 billion in 2023
- By End-user - Residential segment accounted for the largest market revenue share in 2023
Market Size & Forecast
- Market Opportunities: USD 305.54 billion
- Market Future Opportunities: USD 499.60 billion
- CAGR from 2024 to 2029 : 18.1%
Market Summary
- The market is experiencing significant growth due to the increasing awareness and demand for energy-efficient structures. According to recent studies, the energy savings from green buildings can range from 20% to 30% compared to traditional buildings, making it a worthwhile investment for businesses and organizations. This trend is driven by various factors, including stringent energy regulations, increasing environmental concerns, and the desire for operational efficiency. Advancements in insulation materials, such as spray foam insulation and insulated concrete forms, have played a crucial role in the growth of the market. These materials offer superior insulation properties, reducing energy consumption and improving indoor air quality.
- However, the high initial cost of green buildings remains a challenge for many businesses. For instance, a large construction firm may face higher upfront costs when building a green office complex. However, the long-term benefits, such as reduced energy bills, tax incentives, and improved employee productivity, can outweigh the initial investment. A study conducted by the U.S. Department of Energy found that green buildings have 11% higher asset value and 35% lower operating costs than traditional buildings. This demonstrates the potential for significant cost savings and operational efficiency gains for businesses that invest in green building materials.
What will be the Size of the Green Building Materials Market during the forecast period?
Get Key Insights on Market Forecast (PDF) Request Free Sample
How is the Green Building Materials Market Segmented ?
The green building materials industry research report provides comprehensive data (region-wise segment analysis), with forecasts and estimates in "USD billion" for the period 2025-2029, as well as historical data from 2019-2023 for the following segments.
- Application
- Insulation
- Roofing
- Interior finishing
- Framing
- Others
- End-user
- Residential
- Non-residential
- Product Type
- Interior
- Exterior
- Building systems
- Solar
- Geography
- North America
- US
- Canada
- Europe
- France
- Germany
- Italy
- UK
- Middle East and Africa
- Egypt
- KSA
- Oman
- UAE
- APAC
- China
- India
- Japan
- South America
- Argentina
- Brazil
- Rest of World (ROW)
- North America
By Application Insights
The insulation segment is estimated to witness significant growth during the forecast period.
Green building materials continue to gain traction in the construction industry, with insulation leading the charge in energy savings, comfort, and noise reduction. Properly installed insulation made from eco-friendly materials, such as cellulose, spray foam, rock wool, and fiberglass, contributes significantly to meeting the energy efficiency requirements of various green building rating systems, including Northwest ENERGY STAR Homes, Built Green, and LEED for homes. This segment's growth is further fueled by the numerous benefits of green insulation, including financial savings, improved comfort, and reduced carbon footprint. For instance, insulated concrete forms, hempcrete construction, and straw bale construction offer impressive thermal performance, while geothermal heating and solar panel integration harness renewable energy sources.
Additionally, materials like reclaimed wood, bamboo flooring, and low-VOC paints prioritize sustainability and minimize material toxicity. The market for green building materials is expected to grow at a robust rate during the forecast period, with a focus on reducing embodied carbon, improving acoustic performance, and implementing daylighting strategies.
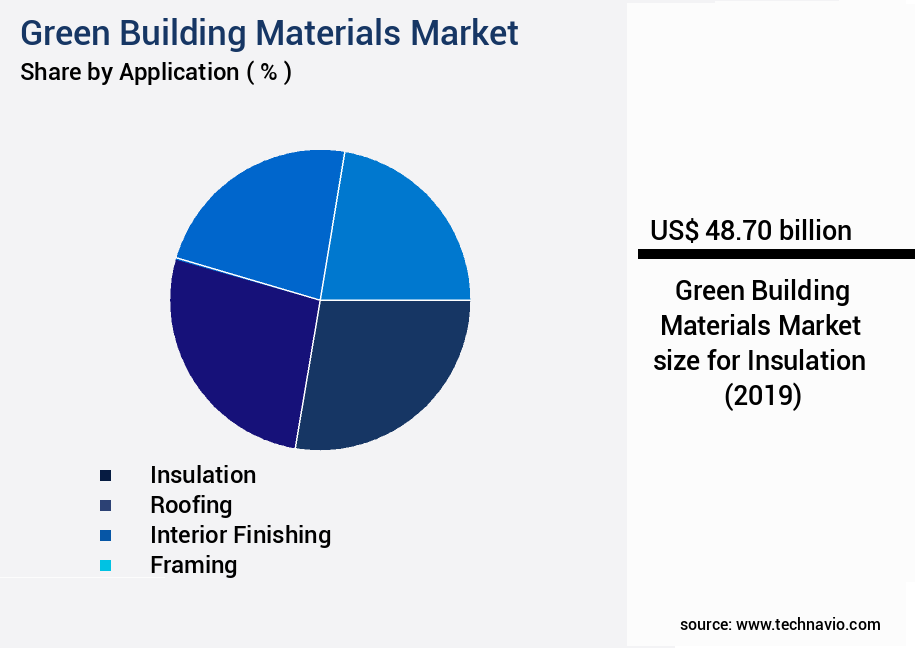
The Insulation segment was valued at USD 48.70 billion in 2019 and showed a gradual increase during the forecast period.
Regional Analysis
APAC is estimated to contribute 34% to the growth of the global market during the forecast period.Technavio's analysts have elaborately explained the regional trends and drivers that shape the market during the forecast period.

See How Green Building Materials Market Demand is Rising in APAC Request Free Sample
Europe is a leading player in The market, driven by a strong commitment to sustainability and eco-friendly practices. The region's emphasis on energy efficiency is a significant factor fueling market growth. Europe aims to reduce energy consumption and greenhouse gas emissions, making sustainable building materials a priority. The European Union has set ambitious targets to cut energy use by at least 20% by 2020 compared to 1990 levels. Green building materials offer an effective solution, contributing to energy savings and reduced carbon footprints. The European the market encompasses a diverse range of products, including insulation, roofing, and flooring.
For instance, the insulation segment is expected to account for over 40% of the market share due to its energy-saving properties. Meanwhile, the roofing segment is projected to grow at a robust rate due to the increasing adoption of green roofs. The use of these materials not only enhances operational efficiency but also ensures regulatory compliance with stringent environmental regulations.
Market Dynamics
Our researchers analyzed the data with 2024 as the base year, along with the key drivers, trends, and challenges. A holistic analysis of drivers will help companies refine their marketing strategies to gain a competitive advantage.
The market is experiencing significant growth as the construction industry shifts towards more sustainable and eco-friendly practices. One key area of focus is the use of insulated concrete forms (ICFs) for thermal performance, which offer energy efficiency and reduced carbon emissions during the building's lifecycle. Another area of interest is the life cycle assessment (LCA) of recycled aggregates, which can help reduce the embodied carbon in mass timber construction. Low-voc paints are essential in minimizing volatile organic compound (VOC) emissions, contributing to healthier indoor environments. Durability testing of plant-based materials is crucial to ensure their long-term viability in green building projects. Acoustic performance is another critical factor, with green building materials offering sound absorption properties to reduce noise pollution. Water efficiency is another essential aspect of green building design, with green roofs being an effective solution for rainwater collection and reuse. Energy modeling for passive house design plays a vital role in optimizing energy usage and reducing carbon emissions. Green building codes and sustainable design practices are increasingly being adopted worldwide, driving the demand for sustainable material sourcing for lumber. Construction waste management strategies are essential to minimize waste and reduce the carbon footprint of building projects. Building material life cycle assessment methodologies help architects and builders make informed decisions about the environmental impact of various materials. Thermal bridging can significantly impact building envelope performance, making it essential to consider insulation and other energy-efficient solutions. Renewable energy sources, such as solar panels and wind turbines, are increasingly being integrated into building design to reduce reliance on non-renewable energy sources. Prefabricated components in modular construction offer numerous benefits, including reduced construction time, lower embodied carbon, and improved material utilization. Recycled content in green concrete is another trend gaining popularity, reducing the need for virgin materials and minimizing waste. Building performance simulation tools help architects and builders optimize energy usage and minimize environmental impact. Natural ventilation strategies and daylighting designs are essential for reducing energy consumption and improving indoor air quality. Greywater recycling systems are also becoming increasingly common, offering significant water savings and reducing the demand for freshwater resources.
What are the key market drivers leading to the rise in the adoption of Green Building Materials Industry?
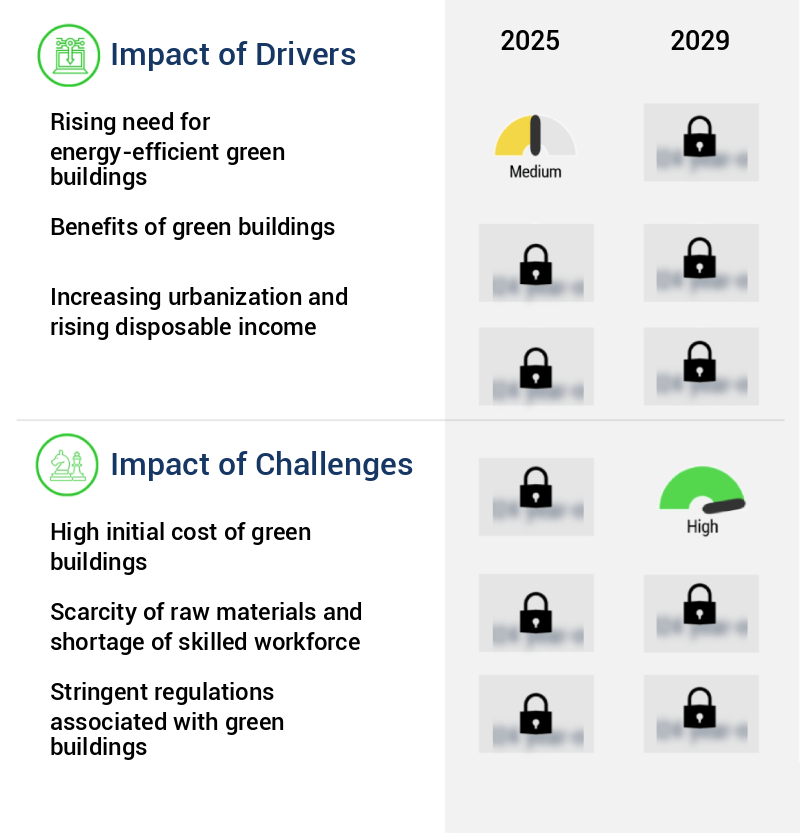
- The increasing demand for energy-efficient and eco-friendly buildings is the primary market driver, as sustainability becomes a priority in both commercial and residential construction.
- The global market for Green Building Materials is experiencing significant growth due to the increasing demand for energy-efficient structures. With the expanding urban population and rapid industrialization, the need for energy-efficient buildings has become imperative, as they account for a substantial portion of global energy consumption. Energy efficiency is a crucial factor in green buildings, offering substantial cost savings for businesses, facility managers, and homeowners alike. Many countries are implementing energy efficiency as a mandatory requirement in their building codes, recognizing its importance in addressing the depletion of non-renewable energy sources.
- The adoption of green building materials is not only environmentally responsible but also offers tangible business benefits, such as reduced downtime and improved decision-making through enhanced accuracy in forecasting energy usage.
What are the market trends shaping the Green Building Materials Industry?
- Advancements in insulation materials are currently shaping market trends. The use of innovative insulation materials is gaining significant traction in the industry.
- Green building materials have seen significant advancements in recent years, with Styrofoam board and spray foam emerging as popular insulation options. Manufacturers are increasingly focusing on producing low-emission blowing agents for spray foam and extruded polystyrene (XPS) foam insulation. However, the environmental concerns surrounding foam insulation, particularly the gases used to expand the foam beads, have led to the development of lower emission alternatives.
- These advancements contribute to the reduction of downtime and improved forecast accuracy for construction projects, allowing for faster product rollouts and regulatory compliance. The market continues to evolve, prioritizing sustainability and environmental responsibility.
What challenges does the Green Building Materials Industry face during its growth?
- The high initial cost of constructing and implementing green building technologies poses a significant challenge to the industry's growth trajectory.
- The market: A Global Overview Green buildings, characterized by their energy efficiency and sustainable practices, represent a significant and evolving segment of the construction industry. The adoption of green building materials and technologies has gained momentum due to increasing environmental consciousness and stringent regulatory requirements. According to recent estimates, The market is projected to expand substantially, driven by key applications such as commercial and residential sectors. The high initial investment in green buildings is a primary challenge for both small and large-scale construction projects. Green buildings utilize advanced, energy-efficient materials and technologies, which can significantly increase the cost of procurement and installation.
- Additionally, the extended architectural and engineering design time, modeling costs, and integration of sustainable practices contribute to the elevated expenses. Despite these challenges, the long-term benefits of green buildings, including improved energy efficiency, enhanced regulatory compliance, and optimized costs, make them a worthwhile investment.
Exclusive Technavio Analysis on Customer Landscape
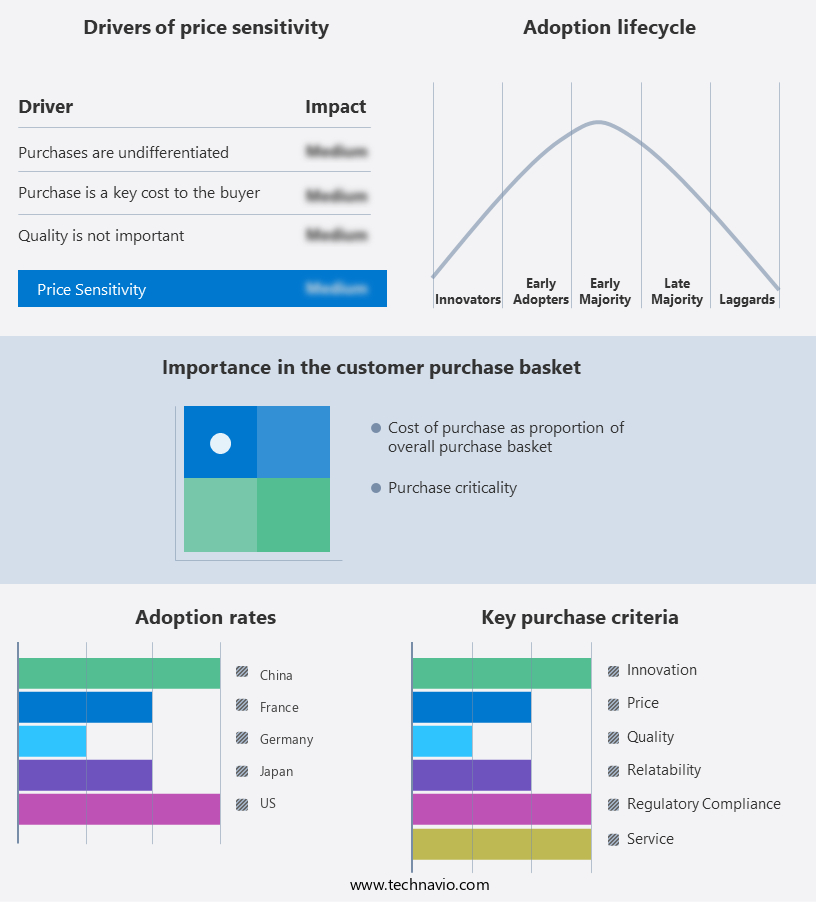
The green building materials market forecasting report includes the adoption lifecycle of the market, covering from the innovator's stage to the laggard's stage. It focuses on adoption rates in different regions based on penetration. Furthermore, the green building materials market report also includes key purchase criteria and drivers of price sensitivity to help companies evaluate and develop their market growth analysis strategies.
Customer Landscape of Green Building Materials Industry
Competitive Landscape
Companies are implementing various strategies, such as strategic alliances, green building materials market forecast, partnerships, mergers and acquisitions, geographical expansion, and product/service launches, to enhance their presence in the industry.
Alumasc Group Plc - This company specializes in eco-friendly building envelope solutions, providing innovative products like Alumasc Green Roof systems, Derbigum sustainable roofing membranes, and Hydrotech MM6125 waterproofing. These green building materials contribute significantly to energy efficiency and reduced carbon footprint in construction projects.
The industry research and growth report includes detailed analyses of the competitive landscape of the market and information about key companies, including:
- Alumasc Group Plc
- Amvic Inc.
- Armstrong World Industries, Inc.
- BASF SE
- Bauder Limited
- Binderholz GmbH
- CEMEX S.A.B. de C.V.
- CertainTeed Corporation
- DowDuPont, Inc.
- Forbo International SA
- Heidelberg Materials
- Holcim
- Interface Inc.
- Kingspan Group plc
- Lafarge
- National Fiber
- Owens Corning
- PPG Industries, Inc.
- RedBuilt, LLC
- Saint-Gobain
Qualitative and quantitative analysis of companies has been conducted to help clients understand the wider business environment as well as the strengths and weaknesses of key industry players. Data is qualitatively analyzed to categorize companies as pure play, category-focused, industry-focused, and diversified; it is quantitatively analyzed to categorize companies as dominant, leading, strong, tentative, and weak.
Recent Development and News in Green Building Materials Market
- In August 2024, global construction materials company, LafargeHolcim, announced the launch of its new line of eco-friendly concrete, "Eco-Concrete," which reduces carbon emissions by 30% compared to traditional concrete. This innovation was showcased at the World Green Building Congress in Amsterdam (LafargeHolcim press release, August 2024).
- In November 2024, BASF and Siemens Energy entered into a strategic partnership to develop and produce green hydrogen for the production of advanced green building materials. The collaboration aims to reduce the carbon footprint of the construction industry by using renewable energy sources for the production process (BASF press release, November 2024).
- In February 2025, Saint-Gobain, a leading player in the market, acquired a majority stake in a US-based insulation company, GreenTech Insulation, to expand its presence in the North American market. The financial details of the acquisition were not disclosed (Saint-Gobain press release, February 2025).
- In May 2025, the European Union passed the new Green Deal II, which includes a significant investment in the green building sector. The €300 billion package will fund research, development, and deployment of innovative green building materials and technologies (European Commission press release, May 2025).
Dive into Technavio's robust research methodology, blending expert interviews, extensive data synthesis, and validated models for unparalleled Green Building Materials Market insights. See full methodology.
|
Market Scope |
|
|
Report Coverage |
Details |
|
Page number |
232 |
|
Base year |
2024 |
|
Historic period |
2019-2023 |
|
Forecast period |
2025-2029 |
|
Growth momentum & CAGR |
Accelerate at a CAGR of 18.1% |
|
Market growth 2025-2029 |
USD 499.6 billion |
|
Market structure |
Fragmented |
|
YoY growth 2024-2025(%) |
14.9 |
|
Key countries |
US, Canada, Germany, UK, Italy, France, China, India, Japan, Brazil, Egypt, UAE, Oman, Argentina, KSA, UAE, Brazil, and Rest of World (ROW) |
|
Competitive landscape |
Leading Companies, Market Positioning of Companies, Competitive Strategies, and Industry Risks |
Research Analyst Overview
- The market continues to evolve, driven by the increasing demand for sustainable and energy-efficient solutions across various sectors. Renewable energy sources, such as geothermal heating and solar panel integration, are gaining traction as key components in reducing carbon footprint and enhancing thermal performance. For instance, a recent project in the US saw a 30% reduction in energy consumption through the integration of geothermal heating and energy-efficient windows. This shift towards sustainable building practices is further emphasized by the growing popularity of LEED certification and passive house design. Insulated concrete forms, hempcrete construction, and mass timber systems are some of the innovative solutions that offer superior thermal performance and contribute to an airtight building envelope.
- Additionally, the use of materials like bamboo flooring, reclaimed wood, and low-VOC paints helps minimize material toxicity and improve acoustic performance. The industry is expected to grow at a robust pace, with estimates suggesting a 10% annual increase in demand for green building materials. This growth is fueled by the ongoing unfolding of market activities, with trends like water harvesting systems, greywater recycling, and natural ventilation gaining momentum. Moreover, the integration of recycled content and recycled metal in construction materials is a significant step towards reducing embodied carbon and promoting circular economy principles.
- Vertical gardens, green roofs, and earthbag construction are other innovative approaches that offer multiple benefits, including improved air quality and enhanced aesthetics. In conclusion, the market is a dynamic and evolving space, with a diverse range of applications and innovative solutions that cater to the growing demand for sustainable and energy-efficient buildings. From geothermal heating and renewable energy sources to insulated concrete forms and passive house design, the industry is continuously pushing the boundaries of what's possible in the realm of sustainable construction.
What are the Key Data Covered in this Green Building Materials Market Research and Growth Report?
-
What is the expected growth of the Green Building Materials Market between 2025 and 2029?
-
USD 499.6 billion, at a CAGR of 18.1%
-
-
What segmentation does the market report cover?
-
The report is segmented by Application (Insulation, Roofing, Interior finishing, Framing, and Others), End-user (Residential and Non-residential), Product Type (Interior, Exterior, Building systems, and Solar), and Geography (Europe, North America, APAC, Middle East and Africa, and South America)
-
-
Which regions are analyzed in the report?
-
Europe, North America, APAC, Middle East and Africa, and South America
-
-
What are the key growth drivers and market challenges?
-
Rising need for energy-efficient green buildings, High initial cost of green buildings
-
-
Who are the major players in the Green Building Materials Market?
-
Alumasc Group Plc, Amvic Inc., Armstrong World Industries, Inc., BASF SE, Bauder Limited, Binderholz GmbH, CEMEX S.A.B. de C.V., CertainTeed Corporation, DowDuPont, Inc., Forbo International SA, Heidelberg Materials, Holcim, Interface Inc., Kingspan Group plc, Lafarge, National Fiber, Owens Corning, PPG Industries, Inc., RedBuilt, LLC, and Saint-Gobain
-
Market Research Insights
- The market for green building materials continues to evolve, driven by the increasing demand for sustainable construction practices. Two notable trends include the growing use of recycled aggregates and the integration of durability testing into the material selection process. For instance, the adoption of recycled aggregates in concrete production has led to a significant reduction in construction waste, amounting to approximately 10% of the total waste generated by the industry. Furthermore, industry experts anticipate that the market will expand by over 12% annually in the coming years, fueled by the increasing popularity of sustainable design and the adoption of stricter green building codes.
- This growth is expected to lead to increased demand for energy modeling, prefabricated components, mineral wool insulation, recycled glass, and other eco-friendly materials. The focus on waste reduction, energy efficiency, and renewable building materials is transforming the construction industry, with mycelium composites, bio-based materials, and plant-based insulation emerging as promising alternatives to traditional building materials. The integration of life cycle costing and material sourcing into the decision-making process is also becoming increasingly important, as stakeholders seek to minimize the environmental impact of their projects while maximizing long-term cost savings. Off-site construction, building performance simulation, indoor air quality, and water efficiency are other key areas of innovation in the market.
We can help! Our analysts can customize this green building materials market research report to meet your requirements.
 RIA -
RIA - 
