Ground Penetrating Radar Market Analysis, Size, and Forecast 2025-2029: North America (US, Canada, and Mexico), Europe (UK, Germany, and France), APAC (China, Japan, and India), Middle East and Africa (UAE, Saudi Arabia, and South Africa), South America (Brazil, Argentina, and Colombia), and Rest of World (ROW)

Ground Penetrating Radar Market Analysis, Size, and Forecast 2025-2029:
North America (US, Canada, and Mexico), Europe (UK, Germany, and France), APAC (China, Japan, and India), Middle East and Africa (UAE, Saudi Arabia, and South Africa), South America (Brazil, Argentina, and Colombia), and Rest of World (ROW)

Published: Dec 2025 291 Pages SKU: IRTNTR73472

Market Overview at a Glance

$175.9 Mn
Market Opportunity
6.5%
CAGR 2024 - 2029
39.5%
North America Growth
$145.3 Mn
Transport and road inspection segment 2023

Ground Penetrating Radar Market Size 2025-2029

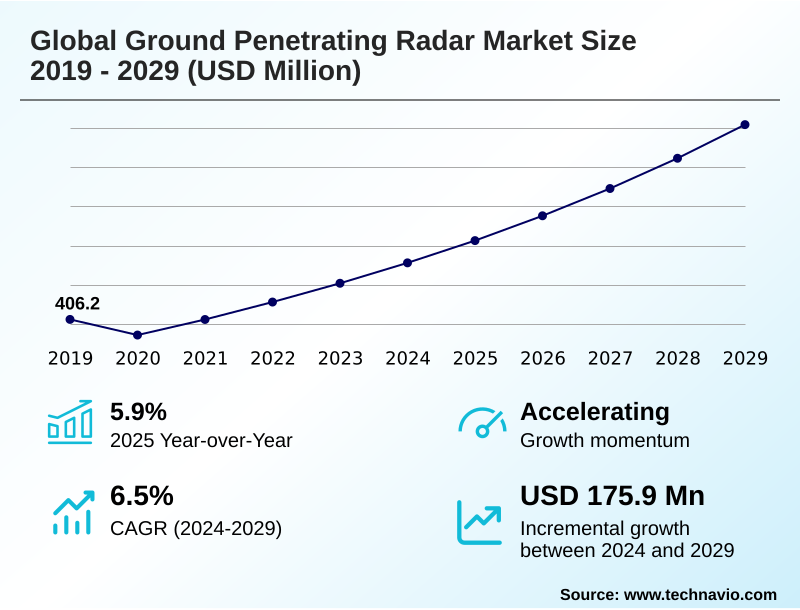
The ground penetrating radar market size is valued to increase by USD 175.9 million, at a CAGR of 6.5% from 2024 to 2029. Rise in concerns related to safety and protection of underground utilities will drive the ground penetrating radar market.

Major Market Trends & Insights

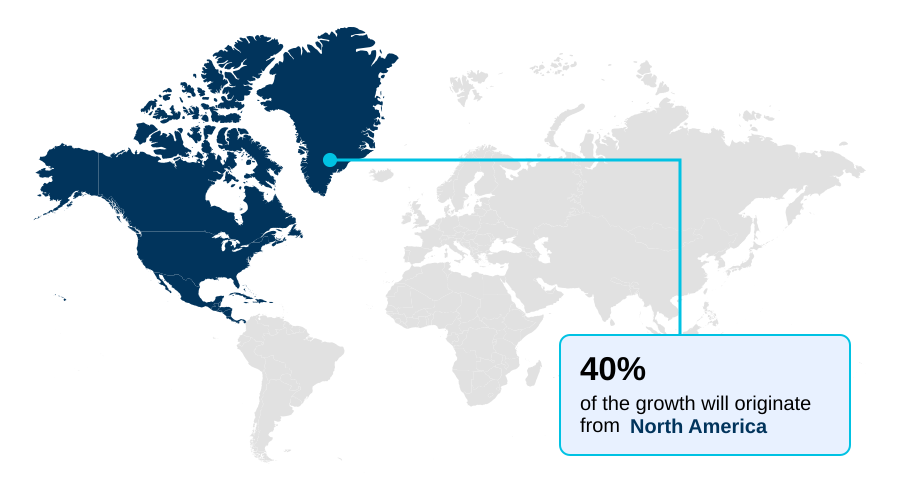
  • North America dominated the market and accounted for a 39.5% growth during the forecast period.
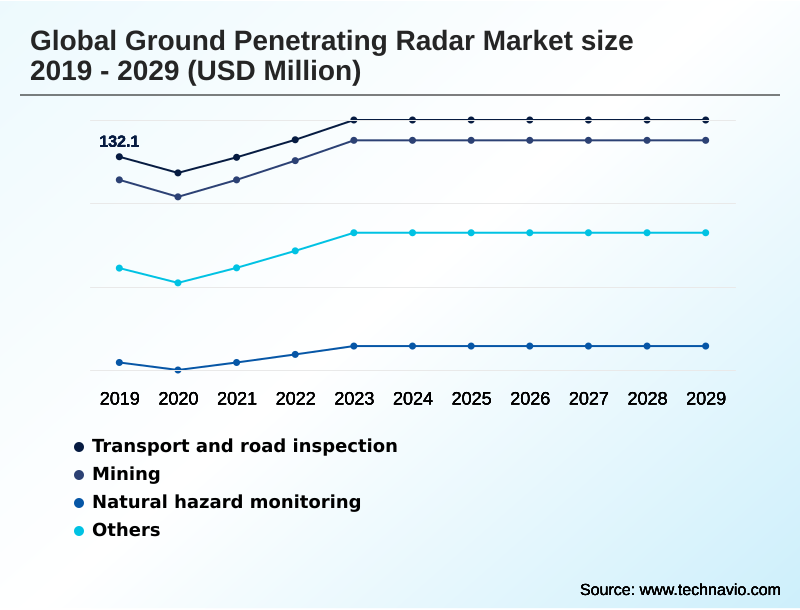
  • By Application - Transport and road inspection segment was valued at USD 145.3 million in 2023
  • By Type - Cart-based systems segment accounted for the largest market revenue share in 2023

Market Size & Forecast

  • Market Opportunities: USD 247.9 million
  • Market Future Opportunities: USD 175.9 million
  • CAGR from 2024 to 2029 : 6.5%

Market Summary

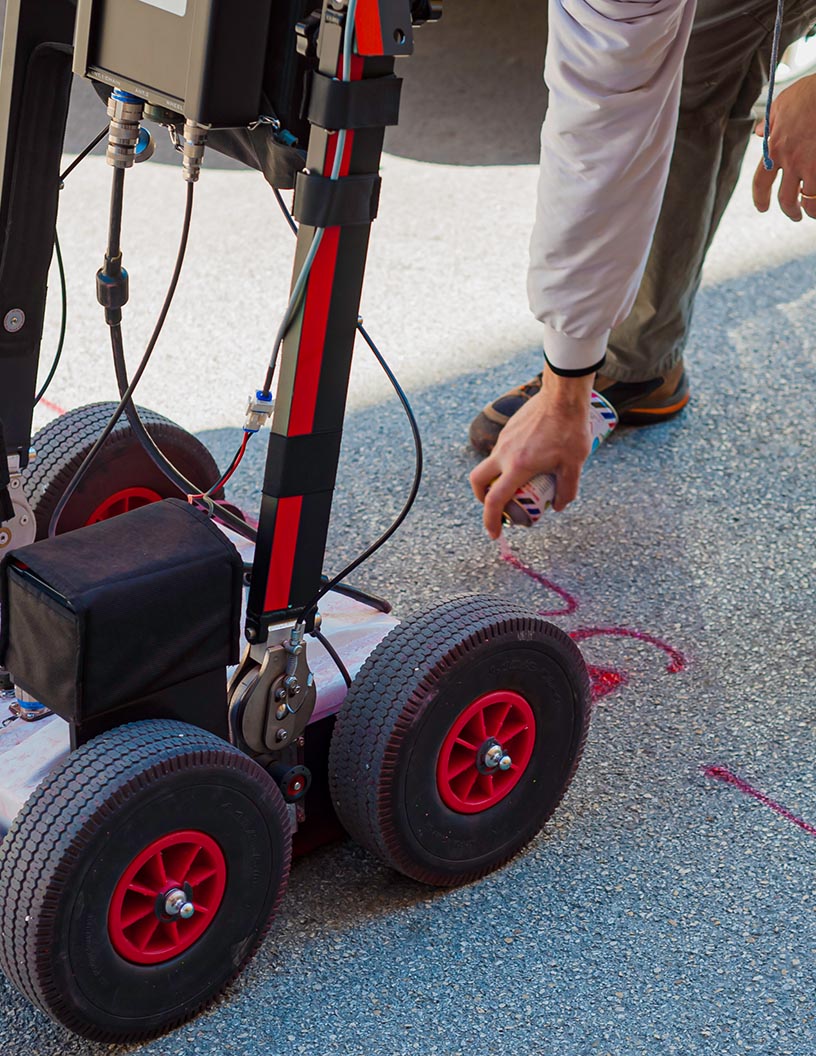
  • The ground penetrating radar market is defined by its critical role in non-invasive subsurface imaging, a capability essential for modern infrastructure development and management. Growth is fueled by stringent safety regulations and the high cost of accidental utility strikes, pushing industries toward proactive detection methods.
  • In construction, for instance, deploying GPR for concrete scanning and utility detection is standard practice to prevent project delays and ensure worker safety, mitigating risks that could otherwise halt operations for weeks.
  • Key trends include the integration of AI and machine learning into GPR software platforms for automated data analysis, which reduces the reliance on highly specialized operators and accelerates decision-making. Concurrently, hardware innovations are leading to more portable and powerful systems, such as drone-mounted GPR, expanding applications into previously inaccessible environments.
  • However, the market is constrained by the high capital cost of equipment and the persistent need for skilled technicians to interpret complex data, a factor that influences purchasing decisions, particularly for smaller enterprises. The technology's application in geotechnical surveys and environmental assessments further underscores its value in risk management and compliance.

What will be the Size of the Ground Penetrating Radar Market during the forecast period?

Get Key Insights on Market Forecast (PDF) Request Free Sample

How is the Ground Penetrating Radar Market Segmented?

The ground penetrating radar industry research report provides comprehensive data (region-wise segment analysis), with forecasts and estimates in "USD million" for the period 2025-2029, as well as historical data from 2019-2023 for the following segments.

  • Application
    • Transport and road inspection
    • Mining
    • Natural hazard monitoring
    • Others
  • Type
    • Cart-based systems
    • Handheld systems
    • Vehicle-mounted systems
  • Component
    • Hardware
    • Services
    • Software
  • Geography
    • North America
      • US
      • Canada
      • Mexico
    • Europe
      • UK
      • Germany
      • France
    • APAC
      • China
      • Japan
      • India
    • Middle East and Africa
      • UAE
      • Saudi Arabia
      • South Africa
    • South America
      • Brazil
      • Argentina
      • Colombia
    • Rest of World (ROW)

By Application Insights

The transport and road inspection segment is estimated to witness significant growth during the forecast period.

The transport and road inspection segment is critical, driven by the need for non-destructive testing to ensure infrastructure safety and longevity.

Effective structural health monitoring of transportation networks relies on technologies like GPR for precise pavement analysis and bridge deck assessment. This approach is instrumental in identifying subsurface issues such as void detection, delamination detection, and moisture intrusion before they escalate.

Integrating gpr data interpretation with infrastructure management workflows improves defect identification accuracy by over 15% compared to visual inspection alone.

This use of subsurface mapping is vital for proactive maintenance scheduling, enhancing public safety, and optimizing asset integrity, thereby reducing long-term repair costs and extending the lifecycle of critical transportation assets through advanced condition assessment.

Request Free Sample

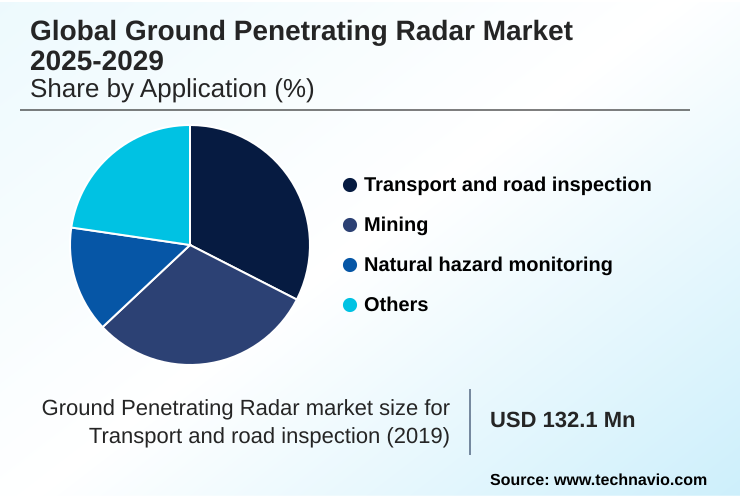
The Transport and road inspection segment was valued at USD 145.3 million in 2023 and showed a gradual increase during the forecast period.

Request Free Sample

Regional Analysis

North America is estimated to contribute 39.5% to the growth of the global market during the forecast period.Technavio’s analysts have elaborately explained the regional trends and drivers that shape the market during the forecast period.

See How Ground Penetrating Radar Market Demand is Rising in North America Request Free Sample

North America commands the largest market portion, accounting for nearly 40% of the geographic opportunity, with Europe following at approximately 27%. This dominance is sustained by robust government mandates for infrastructure safety and significant investment in underground asset management.

In the US, projects leveraging subsurface utility engineering with GPR report up to a 20% reduction in planning delays. APAC is an emerging region, where rapid urbanization fuels demand for utility detection and geotechnical surveys.

The application of step-frequency radar and real-time data visualization is becoming more common in these developing markets, supporting complex construction and infrastructure projects and enhancing operational efficiency through superior subsurface diagnostics.

Market Dynamics

Our researchers analyzed the data with 2024 as the base year, along with the key drivers, trends, and challenges. A holistic analysis of drivers will help companies refine their marketing strategies to gain a competitive advantage.

  • The versatility of ground penetrating radar is evident in its wide array of specialized applications, each demanding distinct technological approaches. For instance, GPR for concrete structure inspection relies on high-frequency antennas for detailed rebar and void detection, whereas GPR applications in mining safety utilize lower frequencies for greater depth penetration to identify geological hazards.
  • The debate over comparing GPR and electromagnetic locators continues, though many professionals now favor a combined approach for comprehensive subsurface utility mapping standards. A key differentiator is the multi-frequency GPR antenna benefits, which allow a single system to adapt to various targets, from deep geological strata to shallow utilities like those found with locating plastic pipes with GPR.
  • The processing of this complex data is critical; advanced software for GPR data analysis can reduce interpretation time by over 50% compared to manual methods, a vital efficiency gain in large-scale projects like utility mapping with GPR and GIS. For specific tasks, specialized hardware like handheld GPR systems for tight spaces and vehicle-mounted GPR for large-scale surveys offer tailored solutions.
  • Innovations in GPR signal processing for noise reduction and automated target recognition in GPR data are making systems more accessible. This is also seen in niche uses such as GPR for railway ballast inspection, assessing bridge deck deterioration with GPR, and using drone-based GPR for hazardous areas.
  • Whether detecting voids beneath concrete slabs, conducting non-destructive pavement layer analysis, or exploring GPR techniques for archaeological sites, the technology continues to evolve, with real-time 3D GPR imaging systems setting new standards for subsurface visualization and soil moisture content measurement using GPR opening new environmental applications.

What are the key market drivers leading to the rise in the adoption of Ground Penetrating Radar Industry?

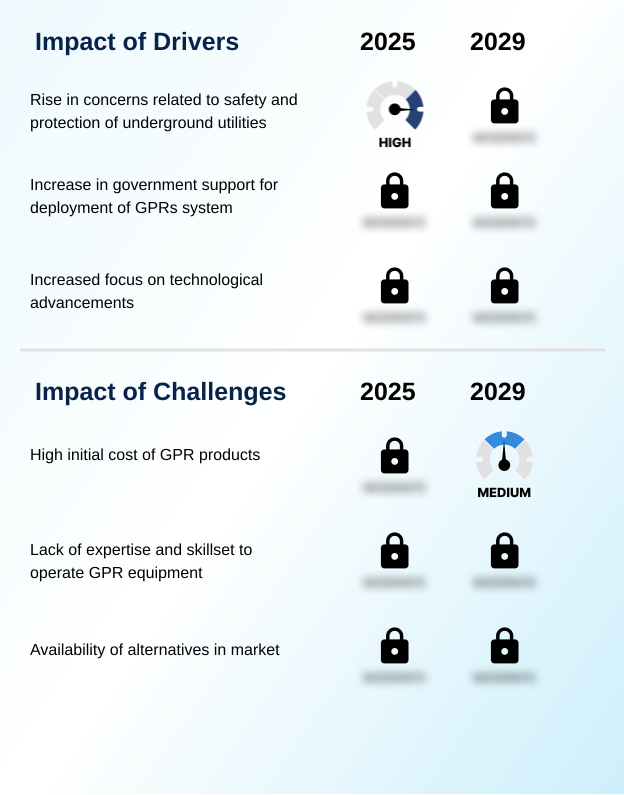
  • Heightened concerns regarding the safety and protection of underground utilities serve as a primary market driver, necessitating accurate subsurface detection to prevent damage during excavation activities.

  • A primary market driver is the intensified focus on utility strike prevention and managing underground asset management. Regulations mandating subsurface utility engineering before excavation have spurred the adoption of non-destructive testing tools.
  • The deployment of vehicle-mounted GPR arrays for large-scale urban mapping projects has increased efficiency by 30% compared to traditional cart-based survey systems. This proactive approach to subsurface inspection services, using techniques like time-domain impulse radar, helps create accurate digital records.
  • Integrating this data into digital twin integration frameworks provides a comprehensive view of underground infrastructure, reducing accidental damages and associated service disruptions. This reliance on non-invasive exploration ensures compliance and enhances public safety.

What are the market trends shaping the Ground Penetrating Radar Industry?

  • Growing demand within the oil and gas sector for precise subsurface mapping and infrastructure integrity assessment is a notable market trend. It reflects a wider industry shift toward non-destructive methods to improve operational safety and efficiency.

  • A significant trend is the expansion of GPR systems in environmental monitoring and geological mapping. The use of drone-mounted GPR systems facilitates rapid surveys over large or inaccessible areas, with adoption rates in this niche growing by nearly 25% year-over-year. This remote sensing technology enables more efficient condition assessment for applications like landfill characterization and contamination plume tracking.
  • The integration of advanced signal processing and GIS mapping allows for high-resolution 3D mapping of subsurface geology. This capability improves resource exploration efficiency by providing clearer subsurface diagnostics, a significant advancement over traditional survey methods that improves data accuracy by up to 20%.

What challenges does the Ground Penetrating Radar Industry face during its growth?

  • The substantial initial investment required for ground penetrating radar products poses a key challenge, restricting adoption among smaller organizations or for single-use applications.

  • A key challenge is the need for specialized expertise in GPR data interpretation, which can limit broader adoption despite hardware advancements in handheld GPR scanners. The complexity of signal attenuation and subsurface anomaly detection requires significant training, presenting a barrier for organizations without dedicated geophysical survey teams.
  • While GPR software platforms are evolving with automated feature recognition, effective deployment still relies on skilled operators. The investment in training can be substantial, with firms reporting that it takes up to six months for an operator to become proficient.
  • This skills gap is particularly evident in applications requiring nuanced analysis, such as archaeological investigation or forensic investigation, impacting the return on investment for the equipment.

Exclusive Technavio Analysis on Customer Landscape

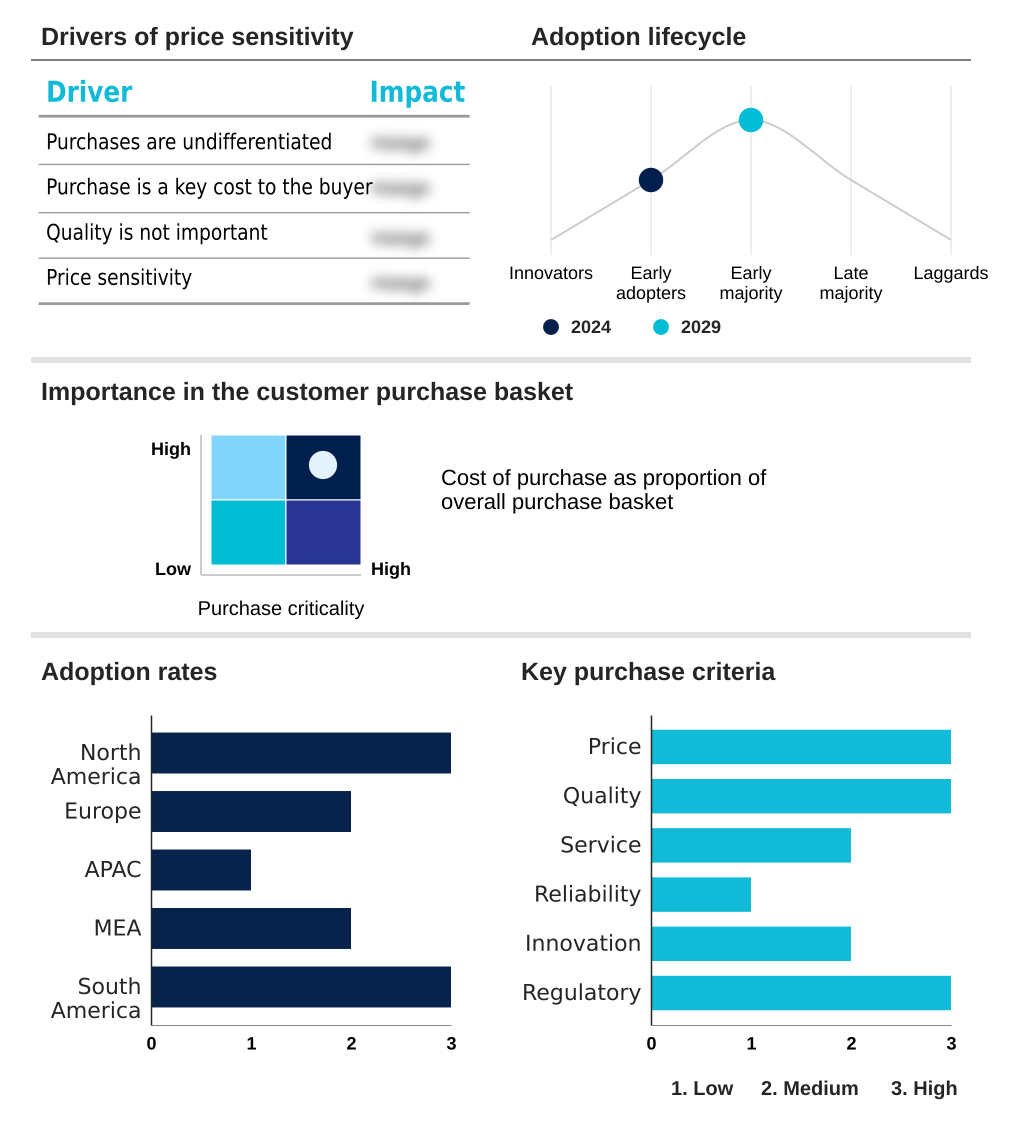
The ground penetrating radar market forecasting report includes the adoption lifecycle of the market, covering from the innovator’s stage to the laggard’s stage. It focuses on adoption rates in different regions based on penetration. Furthermore, the ground penetrating radar market report also includes key purchase criteria and drivers of price sensitivity to help companies evaluate and develop their market growth analysis strategies.

Customer Landscape of Ground Penetrating Radar Industry

Competitive Landscape

Companies are implementing various strategies, such as strategic alliances, ground penetrating radar market forecast, partnerships, mergers and acquisitions, geographical expansion, and product/service launches, to enhance their presence in the industry.

Chemring Group Plc - Key offerings include integrated ground penetrating radar systems that provide essential non-destructive subsurface imaging for utility detection, concrete scanning, and geophysical surveys across diverse industries.

The industry research and growth report includes detailed analyses of the competitive landscape of the market and information about key companies, including:

  • Chemring Group Plc
  • Geophysical Survey Systems Inc.
  • Geoscanners AB
  • Geotech LLC
  • Guideline Geo AB
  • Hexagon AB
  • Hilti Corp.
  • IDS GeoRadar Srl
  • Leica Geosystems AG
  • Lockheed Martin Corp.
  • Penetradar Corp.
  • Pipehawk Plc
  • Radiodetection Ltd.
  • Sensors and Software Inc.
  • US Radar Inc.
  • Utsi Electronics Ltd.

Qualitative and quantitative analysis of companies has been conducted to help clients understand the wider business environment as well as the strengths and weaknesses of key industry players. Data is qualitatively analyzed to categorize companies as pure play, category-focused, industry-focused, and diversified; it is quantitatively analyzed to categorize companies as dominant, leading, strong, tentative, and weak.

Recent Development and News in Ground penetrating radar market

  • In September, 2024, Guideline Geo AB announced the launch of its new compact, multi-channel GPR array system, designed to enhance high-resolution 3D data acquisition for utility mapping and archaeological surveys.
  • In November, 2024, Hexagon AB revealed a strategic partnership with a leading digital twin software provider to integrate its IDS GeoRadar GPR data streams, aiming to create comprehensive subsurface digital replicas for urban planning.
  • In February, 2025, Geophysical Survey Systems Inc. completed the acquisition of a specialized AI software firm to embed advanced machine learning algorithms into its GPR systems for automated target recognition and data interpretation.
  • In April, 2025, Radiodetection Ltd. launched a global initiative to standardize GPR operator training and certification, aligning with new international infrastructure safety protocols to improve data quality and consistency.

Dive into Technavio’s robust research methodology, blending expert interviews, extensive data synthesis, and validated models for unparalleled Ground Penetrating Radar Market insights. See full methodology.

Market Scope
Page number 291
Base year 2024
Historic period 2019-2023
Forecast period 2025-2029
Growth momentum & CAGR Accelerate at a CAGR of 6.5%
Market growth 2025-2029 USD 175.9 million
Market structure Fragmented
YoY growth 2024-2025(%) 5.9%
Key countries US, Canada, Mexico, UK, Germany, France, Italy, The Netherlands, Spain, China, Japan, India, South Korea, Australia, Indonesia, UAE, Saudi Arabia, South Africa, Israel, Turkey, Brazil, Argentina and Colombia
Competitive landscape Leading Companies, Market Positioning of Companies, Competitive Strategies, and Industry Risks

Request Free Sample

Research Analyst Overview

  • The ground penetrating radar market is advancing through innovations in hardware and software, fundamentally changing how subsurface investigation is conducted. The adoption of multi-channel antenna arrays enables data collection that is up to 50% faster than single-channel systems, a critical efficiency gain for large-area geotechnical surveys and infrastructure management.
  • This shift is driven by the need for more comprehensive non-destructive testing and subsurface utility engineering. Key technologies such as time-domain impulse radar and step-frequency radar are being refined for better performance in challenging environments. The emphasis on improved GPR data interpretation is leading to the integration of AI into control unit designs for real-time imaging and 3D reconstruction.
  • Applications are expanding beyond traditional utility detection and concrete scanning to include detailed pavement analysis, bridge deck assessment, and soil stratification. Boardroom decisions are increasingly influenced by the ability of GPR to ensure compliance and mitigate risk, particularly in tasks like rebar mapping and detecting moisture intrusion, void detection, and delamination detection.
  • This makes proficiency in electromagnetic wave propagation, signal attenuation, and non-metallic utility locating essential for modern structural health monitoring and archaeological investigation.

What are the Key Data Covered in this Ground Penetrating Radar Market Research and Growth Report?

  • What is the expected growth of the Ground Penetrating Radar Market between 2025 and 2029?

    • USD 175.9 million, at a CAGR of 6.5%

  • What segmentation does the market report cover?

    • The report is segmented by Application (Transport and road inspection, Mining, Natural hazard monitoring, Others), Type (Cart-based systems, Handheld systems, Vehicle-mounted systems), Component (Hardware, Services, Software) and Geography (North America, Europe, APAC, Middle East and Africa, South America)

  • Which regions are analyzed in the report?

    • North America, Europe, APAC, Middle East and Africa and South America

  • What are the key growth drivers and market challenges?

    • Rise in concerns related to safety and protection of underground utilities, High initial cost of GPR products

  • Who are the major players in the Ground Penetrating Radar Market?

    • Chemring Group Plc, Geophysical Survey Systems Inc., Geoscanners AB, Geotech LLC, Guideline Geo AB, Hexagon AB, Hilti Corp., IDS GeoRadar Srl, Leica Geosystems AG, Lockheed Martin Corp., Penetradar Corp., Pipehawk Plc, Radiodetection Ltd., Sensors and Software Inc., US Radar Inc. and Utsi Electronics Ltd.

Market Research Insights

  • The market's dynamics are shaped by a push for greater operational efficiency and accuracy in subsurface diagnostics. Advanced GPR systems now improve target identification accuracy by over 25% compared to legacy models, directly impacting asset integrity programs.
  • Furthermore, the adoption of digital twin integration is accelerating, with firms that incorporate GPR data into project workflows reporting a 40% reduction in planning-stage errors related to underground asset management. This shift toward data-centric methodologies enables more reliable utility strike prevention.
  • The market is also seeing a rise in demand for comprehensive subsurface inspection services, moving beyond simple equipment sales to full-service data acquisition and analysis, driven by the need for actionable insights.

We can help! Our analysts can customize this ground penetrating radar market research report to meet your requirements.

Get in touch

1. Executive Summary

1.1 Market overview

Executive Summary - Chart on Market Overview
Executive Summary - Data Table on Market Overview
Executive Summary - Chart on Global Market Characteristics
Executive Summary - Chart on Market by Geography
Executive Summary - Chart on Market Segmentation by Application
Executive Summary - Chart on Market Segmentation by Type
Executive Summary - Chart on Market Segmentation by Component
Executive Summary - Chart on Incremental Growth
Executive Summary - Data Table on Incremental Growth
Executive Summary - Chart on Company Market Positioning

2. Technavio Analysis

2.1 Analysis of price sensitivity, lifecycle, customer purchase basket, adoption rates, and purchase criteria

2.2 Criticality of inputs and Factors of differentiation

Chart on Overview on criticality of inputs and factors of differentiation

2.3 Factors of disruption

Chart on Overview on factors of disruption

2.4 Impact of drivers and challenges

Chart on Impact of drivers and challenges in 2024 and 2029

3. Market Landscape

3.1 Market ecosystem

Chart on Parent Market
Data Table on - Parent Market

3.2 Market characteristics

Chart on Market characteristics analysis

3.3 Value chain analysis

Chart on Value chain analysis

4. Market Sizing

4.1 Market definition

Data Table on Offerings of companies included in the market definition

4.2 Market segment analysis

Market segments

4.3 Market size 2024

4.4 Market outlook: Forecast for 2024-2029

Chart on Global - Market size and forecast 2024-2029 ($ million)
Data Table on Global - Market size and forecast 2024-2029 ($ million)
Chart on Global Market: Year-over-year growth 2024-2029 (%)
Data Table on Global Market: Year-over-year growth 2024-2029 (%)

5. Historic Market Size

5.1 Global Ground Penetrating Radar Market 2019 - 2023

Historic Market Size - Data Table on Global Ground Penetrating Radar Market 2019 - 2023 ($ million)

5.2 Application segment analysis 2019 - 2023

Historic Market Size - Application Segment 2019 - 2023 ($ million)

5.3 Type segment analysis 2019 - 2023

Historic Market Size - Type Segment 2019 - 2023 ($ million)

5.4 Component segment analysis 2019 - 2023

Historic Market Size - Component Segment 2019 - 2023 ($ million)

5.5 Geography segment analysis 2019 - 2023

Historic Market Size - Geography Segment 2019 - 2023 ($ million)

5.6 Country segment analysis 2019 - 2023

Historic Market Size - Country Segment 2019 - 2023 ($ million)

6. Qualitative Analysis

6.1 Impact of AI in the global ground penetrating radar market

7. Five Forces Analysis

7.1 Five forces summary

Five forces analysis - Comparison between 2024 and 2029

7.2 Bargaining power of buyers

Bargaining power of buyers - Impact of key factors 2024 and 2029

7.3 Bargaining power of suppliers

Bargaining power of suppliers - Impact of key factors in 2024 and 2029

7.4 Threat of new entrants

Threat of new entrants - Impact of key factors in 2024 and 2029

7.5 Threat of substitutes

Threat of substitutes - Impact of key factors in 2024 and 2029

7.6 Threat of rivalry

Threat of rivalry - Impact of key factors in 2024 and 2029

7.7 Market condition

Chart on Market condition - Five forces 2024 and 2029

8. Market Segmentation by Application

8.1 Market segments

Chart on Application - Market share 2024-2029 (%)
Data Table on Application - Market share 2024-2029 (%)

8.2 Comparison by Application

Chart on Comparison by Application
Data Table on Comparison by Application

8.3 Transport and road inspection - Market size and forecast 2024-2029

Chart on Transport and road inspection - Market size and forecast 2024-2029 ($ million)
Data Table on Transport and road inspection - Market size and forecast 2024-2029 ($ million)
Chart on Transport and road inspection - Year-over-year growth 2024-2029 (%)
Data Table on Transport and road inspection - Year-over-year growth 2024-2029 (%)

8.4 Mining - Market size and forecast 2024-2029

Chart on Mining - Market size and forecast 2024-2029 ($ million)
Data Table on Mining - Market size and forecast 2024-2029 ($ million)
Chart on Mining - Year-over-year growth 2024-2029 (%)
Data Table on Mining - Year-over-year growth 2024-2029 (%)

8.5 Natural hazard monitoring - Market size and forecast 2024-2029

Chart on Natural hazard monitoring - Market size and forecast 2024-2029 ($ million)
Data Table on Natural hazard monitoring - Market size and forecast 2024-2029 ($ million)
Chart on Natural hazard monitoring - Year-over-year growth 2024-2029 (%)
Data Table on Natural hazard monitoring - Year-over-year growth 2024-2029 (%)

8.6 Others - Market size and forecast 2024-2029

Chart on Others - Market size and forecast 2024-2029 ($ million)
Data Table on Others - Market size and forecast 2024-2029 ($ million)
Chart on Others - Year-over-year growth 2024-2029 (%)
Data Table on Others - Year-over-year growth 2024-2029 (%)

8.7 Market opportunity by Application

Market opportunity by Application ($ million)
Data Table on Market opportunity by Application ($ million)

9. Market Segmentation by Type

9.1 Market segments

Chart on Type - Market share 2024-2029 (%)
Data Table on Type - Market share 2024-2029 (%)

9.2 Comparison by Type

Chart on Comparison by Type
Data Table on Comparison by Type

9.3 Cart-based systems - Market size and forecast 2024-2029

Chart on Cart-based systems - Market size and forecast 2024-2029 ($ million)
Data Table on Cart-based systems - Market size and forecast 2024-2029 ($ million)
Chart on Cart-based systems - Year-over-year growth 2024-2029 (%)
Data Table on Cart-based systems - Year-over-year growth 2024-2029 (%)

9.4 Handheld systems - Market size and forecast 2024-2029

Chart on Handheld systems - Market size and forecast 2024-2029 ($ million)
Data Table on Handheld systems - Market size and forecast 2024-2029 ($ million)
Chart on Handheld systems - Year-over-year growth 2024-2029 (%)
Data Table on Handheld systems - Year-over-year growth 2024-2029 (%)

9.5 Vehicle-mounted systems - Market size and forecast 2024-2029

Chart on Vehicle-mounted systems - Market size and forecast 2024-2029 ($ million)
Data Table on Vehicle-mounted systems - Market size and forecast 2024-2029 ($ million)
Chart on Vehicle-mounted systems - Year-over-year growth 2024-2029 (%)
Data Table on Vehicle-mounted systems - Year-over-year growth 2024-2029 (%)

9.6 Market opportunity by Type

Market opportunity by Type ($ million)
Data Table on Market opportunity by Type ($ million)

10. Market Segmentation by Component

10.1 Market segments

Chart on Component - Market share 2024-2029 (%)
Data Table on Component - Market share 2024-2029 (%)

10.2 Comparison by Component

Chart on Comparison by Component
Data Table on Comparison by Component

10.3 Hardware - Market size and forecast 2024-2029

Chart on Hardware - Market size and forecast 2024-2029 ($ million)
Data Table on Hardware - Market size and forecast 2024-2029 ($ million)
Chart on Hardware - Year-over-year growth 2024-2029 (%)
Data Table on Hardware - Year-over-year growth 2024-2029 (%)

10.4 Services - Market size and forecast 2024-2029

Chart on Services - Market size and forecast 2024-2029 ($ million)
Data Table on Services - Market size and forecast 2024-2029 ($ million)
Chart on Services - Year-over-year growth 2024-2029 (%)
Data Table on Services - Year-over-year growth 2024-2029 (%)

10.5 Software - Market size and forecast 2024-2029

Chart on Software - Market size and forecast 2024-2029 ($ million)
Data Table on Software - Market size and forecast 2024-2029 ($ million)
Chart on Software - Year-over-year growth 2024-2029 (%)
Data Table on Software - Year-over-year growth 2024-2029 (%)

10.6 Market opportunity by Component

Market opportunity by Component ($ million)
Data Table on Market opportunity by Component ($ million)

11. Customer Landscape

11.1 Customer landscape overview

Analysis of price sensitivity, lifecycle, customer purchase basket, adoption rates, and purchase criteria

12. Geographic Landscape

12.1 Geographic segmentation

Chart on Market share by geography 2024-2029 (%)
Data Table on Market share by geography 2024-2029 (%)

12.2 Geographic comparison

Chart on Geographic comparison
Data Table on Geographic comparison

12.3 North America - Market size and forecast 2024-2029

Chart on North America - Market size and forecast 2024-2029 ($ million)
Data Table on North America - Market size and forecast 2024-2029 ($ million)
Chart on North America - Year-over-year growth 2024-2029 (%)
Data Table on North America - Year-over-year growth 2024-2029 (%)
Chart on Regional Comparison - North America
Data Table on Regional Comparison - North America

12.3.1 US - Market size and forecast 2024-2029

Chart on US - Market size and forecast 2024-2029 ($ million)
Data Table on US - Market size and forecast 2024-2029 ($ million)
Chart on US - Year-over-year growth 2024-2029 (%)
Data Table on US - Year-over-year growth 2024-2029 (%)

12.3.2 Canada - Market size and forecast 2024-2029

Chart on Canada - Market size and forecast 2024-2029 ($ million)
Data Table on Canada - Market size and forecast 2024-2029 ($ million)
Chart on Canada - Year-over-year growth 2024-2029 (%)
Data Table on Canada - Year-over-year growth 2024-2029 (%)

12.3.3 Mexico - Market size and forecast 2024-2029

Chart on Mexico - Market size and forecast 2024-2029 ($ million)
Data Table on Mexico - Market size and forecast 2024-2029 ($ million)
Chart on Mexico - Year-over-year growth 2024-2029 (%)
Data Table on Mexico - Year-over-year growth 2024-2029 (%)

12.4 Europe - Market size and forecast 2024-2029

Chart on Europe - Market size and forecast 2024-2029 ($ million)
Data Table on Europe - Market size and forecast 2024-2029 ($ million)
Chart on Europe - Year-over-year growth 2024-2029 (%)
Data Table on Europe - Year-over-year growth 2024-2029 (%)
Chart on Regional Comparison - Europe
Data Table on Regional Comparison - Europe

12.4.1 UK - Market size and forecast 2024-2029

Chart on UK - Market size and forecast 2024-2029 ($ million)
Data Table on UK - Market size and forecast 2024-2029 ($ million)
Chart on UK - Year-over-year growth 2024-2029 (%)
Data Table on UK - Year-over-year growth 2024-2029 (%)

12.4.2 Germany - Market size and forecast 2024-2029

Chart on Germany - Market size and forecast 2024-2029 ($ million)
Data Table on Germany - Market size and forecast 2024-2029 ($ million)
Chart on Germany - Year-over-year growth 2024-2029 (%)
Data Table on Germany - Year-over-year growth 2024-2029 (%)

12.4.3 France - Market size and forecast 2024-2029

Chart on France - Market size and forecast 2024-2029 ($ million)
Data Table on France - Market size and forecast 2024-2029 ($ million)
Chart on France - Year-over-year growth 2024-2029 (%)
Data Table on France - Year-over-year growth 2024-2029 (%)

12.4.4 Italy - Market size and forecast 2024-2029

Chart on Italy - Market size and forecast 2024-2029 ($ million)
Data Table on Italy - Market size and forecast 2024-2029 ($ million)
Chart on Italy - Year-over-year growth 2024-2029 (%)
Data Table on Italy - Year-over-year growth 2024-2029 (%)

12.4.5 The Netherlands - Market size and forecast 2024-2029

Chart on The Netherlands - Market size and forecast 2024-2029 ($ million)
Data Table on The Netherlands - Market size and forecast 2024-2029 ($ million)
Chart on The Netherlands - Year-over-year growth 2024-2029 (%)
Data Table on The Netherlands - Year-over-year growth 2024-2029 (%)

12.4.6 Spain - Market size and forecast 2024-2029

Chart on Spain - Market size and forecast 2024-2029 ($ million)
Data Table on Spain - Market size and forecast 2024-2029 ($ million)
Chart on Spain - Year-over-year growth 2024-2029 (%)
Data Table on Spain - Year-over-year growth 2024-2029 (%)

12.5 APAC - Market size and forecast 2024-2029

Chart on APAC - Market size and forecast 2024-2029 ($ million)
Data Table on APAC - Market size and forecast 2024-2029 ($ million)
Chart on APAC - Year-over-year growth 2024-2029 (%)
Data Table on APAC - Year-over-year growth 2024-2029 (%)
Chart on Regional Comparison - APAC
Data Table on Regional Comparison - APAC

12.5.1 China - Market size and forecast 2024-2029

Chart on China - Market size and forecast 2024-2029 ($ million)
Data Table on China - Market size and forecast 2024-2029 ($ million)
Chart on China - Year-over-year growth 2024-2029 (%)
Data Table on China - Year-over-year growth 2024-2029 (%)

12.5.2 Japan - Market size and forecast 2024-2029

Chart on Japan - Market size and forecast 2024-2029 ($ million)
Data Table on Japan - Market size and forecast 2024-2029 ($ million)
Chart on Japan - Year-over-year growth 2024-2029 (%)
Data Table on Japan - Year-over-year growth 2024-2029 (%)

12.5.3 India - Market size and forecast 2024-2029

Chart on India - Market size and forecast 2024-2029 ($ million)
Data Table on India - Market size and forecast 2024-2029 ($ million)
Chart on India - Year-over-year growth 2024-2029 (%)
Data Table on India - Year-over-year growth 2024-2029 (%)

12.5.4 South Korea - Market size and forecast 2024-2029

Chart on South Korea - Market size and forecast 2024-2029 ($ million)
Data Table on South Korea - Market size and forecast 2024-2029 ($ million)
Chart on South Korea - Year-over-year growth 2024-2029 (%)
Data Table on South Korea - Year-over-year growth 2024-2029 (%)

12.5.5 Australia - Market size and forecast 2024-2029

Chart on Australia - Market size and forecast 2024-2029 ($ million)
Data Table on Australia - Market size and forecast 2024-2029 ($ million)
Chart on Australia - Year-over-year growth 2024-2029 (%)
Data Table on Australia - Year-over-year growth 2024-2029 (%)

12.5.6 Indonesia - Market size and forecast 2024-2029

Chart on Indonesia - Market size and forecast 2024-2029 ($ million)
Data Table on Indonesia - Market size and forecast 2024-2029 ($ million)
Chart on Indonesia - Year-over-year growth 2024-2029 (%)
Data Table on Indonesia - Year-over-year growth 2024-2029 (%)

12.6 Middle East and Africa - Market size and forecast 2024-2029

Chart on Middle East and Africa - Market size and forecast 2024-2029 ($ million)
Data Table on Middle East and Africa - Market size and forecast 2024-2029 ($ million)
Chart on Middle East and Africa - Year-over-year growth 2024-2029 (%)
Data Table on Middle East and Africa - Year-over-year growth 2024-2029 (%)
Chart on Regional Comparison - Middle East and Africa
Data Table on Regional Comparison - Middle East and Africa

12.6.1 UAE - Market size and forecast 2024-2029

Chart on UAE - Market size and forecast 2024-2029 ($ million)
Data Table on UAE - Market size and forecast 2024-2029 ($ million)
Chart on UAE - Year-over-year growth 2024-2029 (%)
Data Table on UAE - Year-over-year growth 2024-2029 (%)

12.6.2 Saudi Arabia - Market size and forecast 2024-2029

Chart on Saudi Arabia - Market size and forecast 2024-2029 ($ million)
Data Table on Saudi Arabia - Market size and forecast 2024-2029 ($ million)
Chart on Saudi Arabia - Year-over-year growth 2024-2029 (%)
Data Table on Saudi Arabia - Year-over-year growth 2024-2029 (%)

12.6.3 South Africa - Market size and forecast 2024-2029

Chart on South Africa - Market size and forecast 2024-2029 ($ million)
Data Table on South Africa - Market size and forecast 2024-2029 ($ million)
Chart on South Africa - Year-over-year growth 2024-2029 (%)
Data Table on South Africa - Year-over-year growth 2024-2029 (%)

12.6.4 Israel - Market size and forecast 2024-2029

Chart on Israel - Market size and forecast 2024-2029 ($ million)
Data Table on Israel - Market size and forecast 2024-2029 ($ million)
Chart on Israel - Year-over-year growth 2024-2029 (%)
Data Table on Israel - Year-over-year growth 2024-2029 (%)

12.6.5 Turkey - Market size and forecast 2024-2029

Chart on Turkey - Market size and forecast 2024-2029 ($ million)
Data Table on Turkey - Market size and forecast 2024-2029 ($ million)
Chart on Turkey - Year-over-year growth 2024-2029 (%)
Data Table on Turkey - Year-over-year growth 2024-2029 (%)

12.7 South America - Market size and forecast 2024-2029

Chart on South America - Market size and forecast 2024-2029 ($ million)
Data Table on South America - Market size and forecast 2024-2029 ($ million)
Chart on South America - Year-over-year growth 2024-2029 (%)
Data Table on South America - Year-over-year growth 2024-2029 (%)
Chart on Regional Comparison - South America
Data Table on Regional Comparison - South America

12.7.1 Brazil - Market size and forecast 2024-2029

Chart on Brazil - Market size and forecast 2024-2029 ($ million)
Data Table on Brazil - Market size and forecast 2024-2029 ($ million)
Chart on Brazil - Year-over-year growth 2024-2029 (%)
Data Table on Brazil - Year-over-year growth 2024-2029 (%)

12.7.2 Argentina - Market size and forecast 2024-2029

Chart on Argentina - Market size and forecast 2024-2029 ($ million)
Data Table on Argentina - Market size and forecast 2024-2029 ($ million)
Chart on Argentina - Year-over-year growth 2024-2029 (%)
Data Table on Argentina - Year-over-year growth 2024-2029 (%)

12.7.3 Colombia - Market size and forecast 2024-2029

Chart on Colombia - Market size and forecast 2024-2029 ($ million)
Data Table on Colombia - Market size and forecast 2024-2029 ($ million)
Chart on Colombia - Year-over-year growth 2024-2029 (%)
Data Table on Colombia - Year-over-year growth 2024-2029 (%)

12.8 Market opportunity by geography

Market opportunity by geography ($ million)
Data Tables on Market opportunity by geography ($ million)

13. Drivers, Challenges, and Opportunity

13.1 Market drivers

Rise in concerns related to safety and protection of underground utilities
Increase in government support for deployment of GPRs system
Increased focus on technological advancements

13.2 Market challenges

High initial cost of GPR products
Lack of expertise and skillset to operate GPR equipment
Availability of alternatives in market

13.3 Impact of drivers and challenges

Impact of drivers and challenges in 2024 and 2029

13.4 Market opportunities

Increased demand in oil and gas industry
Rise in demand for real-time GPR services
Advantages of GPR system over other traditional technologies

14. Competitive Landscape

14.1 Overview

14.2

Overview on criticality of inputs and factors of differentiation

14.3 Landscape disruption

Overview on factors of disruption

14.4 Industry risks

Impact of key risks on business

15. Competitive Analysis

15.1 Companies profiled

Companies covered

15.2 Company ranking index

15.3 Market positioning of companies

Matrix on companies position and classification

15.4 Chemring Group Plc

Chemring Group Plc - Overview
Chemring Group Plc - Business segments
Chemring Group Plc - Key offerings
Chemring Group Plc - Segment focus
SWOT

15.5 Geophysical Survey Systems Inc.

Geophysical Survey Systems Inc. - Overview
Geophysical Survey Systems Inc. - Product / Service
Geophysical Survey Systems Inc. - Key offerings
SWOT

15.6 Geoscanners AB

Geoscanners AB - Overview
Geoscanners AB - Product / Service
Geoscanners AB - Key offerings
SWOT

15.7 Geotech LLC

Geotech LLC - Overview
Geotech LLC - Product / Service
Geotech LLC - Key offerings
SWOT

15.8 Guideline Geo AB

Guideline Geo AB - Overview
Guideline Geo AB - Product / Service
Guideline Geo AB - Key offerings
SWOT

15.9 Hexagon AB

Hexagon AB - Overview
Hexagon AB - Business segments
Hexagon AB - Key news
Hexagon AB - Key offerings
Hexagon AB - Segment focus
SWOT

15.10 Hilti Corp.

Hilti Corp. - Overview
Hilti Corp. - Product / Service
Hilti Corp. - Key offerings
SWOT

15.11 IDS GeoRadar Srl

IDS GeoRadar Srl - Overview
IDS GeoRadar Srl - Product / Service
IDS GeoRadar Srl - Key offerings
SWOT

15.12 Leica Geosystems AG

Leica Geosystems AG - Overview
Leica Geosystems AG - Product / Service
Leica Geosystems AG - Key offerings
SWOT

15.13 Lockheed Martin Corp.

Lockheed Martin Corp. - Overview
Lockheed Martin Corp. - Business segments
Lockheed Martin Corp. - Key news
Lockheed Martin Corp. - Key offerings
Lockheed Martin Corp. - Segment focus
SWOT

15.14 Penetradar Corp.

Penetradar Corp. - Overview
Penetradar Corp. - Product / Service
Penetradar Corp. - Key offerings
SWOT

15.15 Pipehawk Plc

Pipehawk Plc - Overview
Pipehawk Plc - Product / Service
Pipehawk Plc - Key offerings
SWOT

15.16 Radiodetection Ltd.

Radiodetection Ltd. - Overview
Radiodetection Ltd. - Product / Service
Radiodetection Ltd. - Key offerings
SWOT

15.17 US Radar Inc.

US Radar Inc. - Overview
US Radar Inc. - Product / Service
US Radar Inc. - Key offerings
SWOT

15.18 Utsi Electronics Ltd.

Utsi Electronics Ltd. - Overview
Utsi Electronics Ltd. - Product / Service
Utsi Electronics Ltd. - Key offerings
SWOT

16. Appendix

16.1 Scope of the report

Market definition
Objectives
Notes and caveats

16.2 Inclusions and exclusions checklist

Inclusions checklist
Exclusions checklist

16.3 Currency conversion rates for US$

16.4 Research methodology

16.5 Data procurement

Information sources

16.6 Data validation

16.7 Validation techniques employed for market sizing

16.8 Data synthesis

16.9 360 degree market analysis

16.10 List of abbreviations

Research Methodology

Technavio presents a detailed picture of the market by way of study, synthesis, and summation of data from multiple sources. The analysts have presented the various facets of the market with a particular focus on identifying the key industry influencers. The data thus presented is comprehensive, reliable, and the result of extensive research, both primary and secondary.

INFORMATION SOURCES

Primary sources

  • Manufacturers and suppliers
  • Channel partners
  • Industry experts
  • Strategic decision makers

Secondary sources

  • Industry journals and periodicals
  • Government data
  • Financial reports of key industry players
  • Historical data
  • Press releases

DATA ANALYSIS

Data Synthesis

  • Collation of data
  • Estimation of key figures
  • Analysis of derived insights

Data Validation

  • Triangulation with data models
  • Reference against proprietary databases
  • Corroboration with industry experts

REPORT WRITING

Qualitative

  • Market drivers
  • Market challenges
  • Market trends
  • Five forces analysis

Quantitative

  • Market size and forecast
  • Market segmentation
  • Geographical insights
  • Competitive landscape

Interested in this report?

Get your sample now to see our research methodology and insights!

Download Now

Frequently Asked Questions

Ground Penetrating Radar market growth will increase by USD 175.9 million during 2025-2029.

The Ground Penetrating Radar market is expected to grow at a CAGR of 6.5% during 2025-2029.

Ground Penetrating Radar market is segmented by Application (Transport and road inspection, Mining, Natural hazard monitoring, Others) Type (Cart-based systems, Handheld systems, Vehicle-mounted systems) Component (Hardware, Services, Software)

Chemring Group Plc, Geophysical Survey Systems Inc., Geoscanners AB, Geotech LLC, Guideline Geo AB, Hexagon AB, Hilti Corp., IDS GeoRadar Srl, Leica Geosystems AG, Lockheed Martin Corp., Penetradar Corp., Pipehawk Plc, Radiodetection Ltd., Sensors and Software Inc., US Radar Inc., Utsi Electronics Ltd. are a few of the key vendors in the Ground Penetrating Radar market.

North America will register the highest growth rate of 39.5% among the other regions. Therefore, the Ground Penetrating Radar market in North America is expected to garner significant business opportunities for the vendors during the forecast period.

US, Canada, Mexico, UK, Germany, France, Italy, The Netherlands, Spain, China, Japan, India, South Korea, Australia, Indonesia, UAE, Saudi Arabia, South Africa, Israel, Turkey, Brazil, Argentina, Colombia

  • Rise in concerns related to safety and protection of underground utilities is the driving factor this market.

The Ground Penetrating Radar market vendors should focus on grabbing business opportunities from the Application segment as it accounted for the largest market share in the base year.