Hazardous Waste Management Market Analysis, Size, and Forecast 2026-2030: APAC (China, Japan, and India), Europe (Germany, UK, and France), North America (US, Canada, and Mexico), South America (Brazil, Argentina, and Chile), Middle East and Africa (Saudi Arabia, UAE, and South Africa), and Rest of World (ROW)

Hazardous Waste Management Market Analysis, Size, and Forecast 2026-2030:
APAC (China, Japan, and India), Europe (Germany, UK, and France), North America (US, Canada, and Mexico), South America (Brazil, Argentina, and Chile), Middle East and Africa (Saudi Arabia, UAE, and South Africa), and Rest of World (ROW)

Published: May 2026 354 Pages SKU: IRTNTR46705

Market Overview at a Glance

$15.82 B
Market Opportunity
7.6%
CAGR 2025 - 2030
54.7%
APAC Growth
$20.02 B
Industrial segment 2024

Hazardous Waste Management Market Size 2026-2030

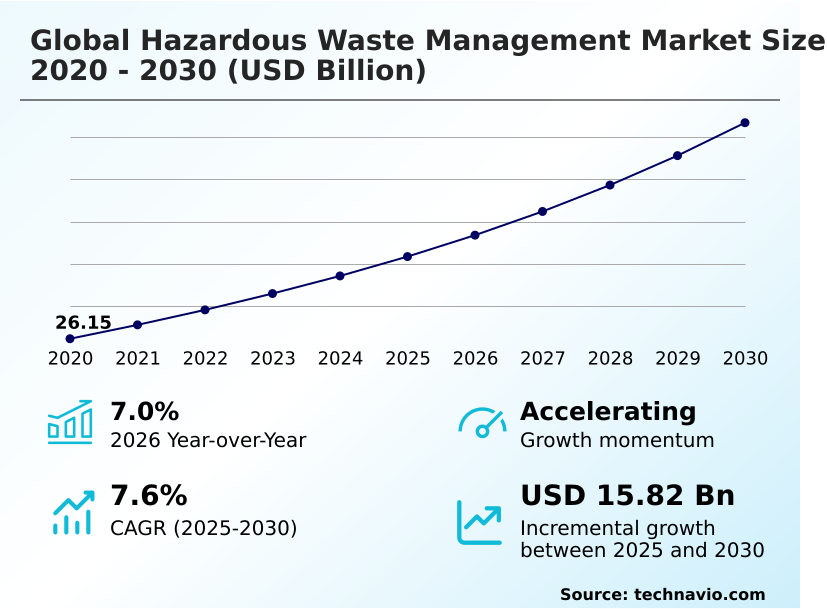
The hazardous waste management market size is valued to increase by USD 15.82 billion, at a CAGR of 7.6% from 2025 to 2030. Stricter global regulatory frameworks and expansion of listed hazardous substances will drive the hazardous waste management market.

Major Market Trends & Insights

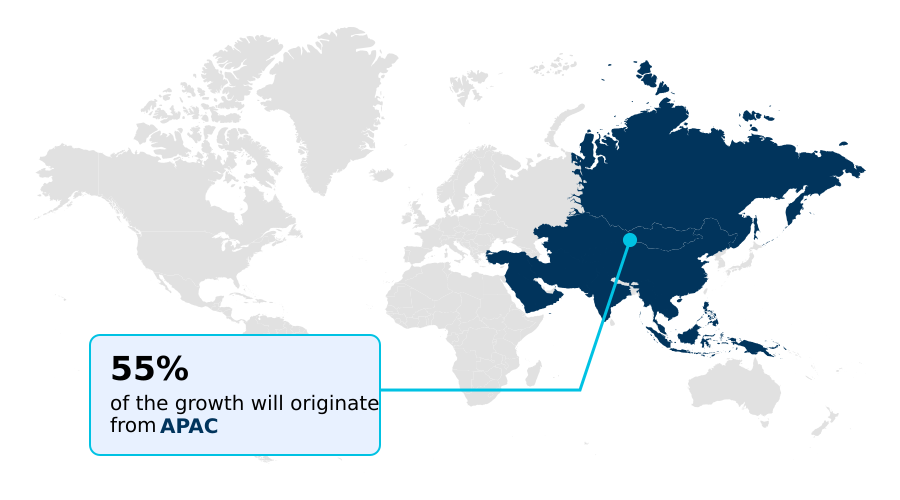
  • APAC dominated the market and accounted for a 54.7% growth during the forecast period.
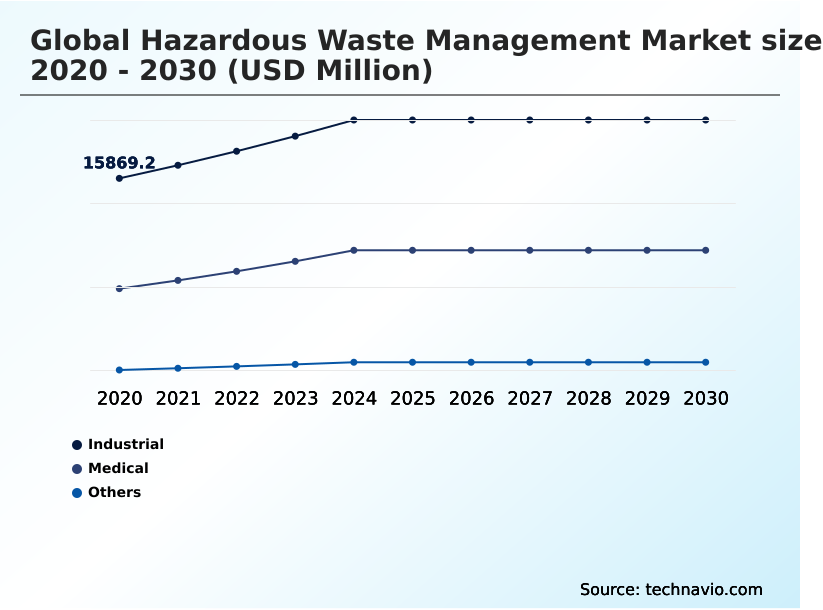
  • By Product - Industrial segment was valued at USD 20.02 billion in 2024
  • By Type - Solid segment accounted for the largest market revenue share in 2024

Market Size & Forecast

  • Market Opportunities: USD 25.54 billion
  • Market Future Opportunities: USD 15.82 billion
  • CAGR from 2025 to 2030 : 7.6%

Market Summary

  • The Hazardous Waste Management Market is fundamentally structured around the secure containment, neutralization, and disposal of toxic industrial byproducts. Tightening regulatory frameworks regarding persistent organic pollutants serve as the primary catalyst for infrastructure upgrades, forcing chemical manufacturers to transition from basic landfilling to advanced thermal destruction. This regulatory pressure directly increases the demand for specialized high-temperature incinerators.
  • Conversely, the extreme capital intensity required to build and maintain these advanced treatment facilities restricts operational flexibility, creating a significant barrier to entry for smaller service providers. In a practical supply chain scenario, automotive manufacturers transitioning to electric vehicles must partner with certified disposal networks to process highly flammable battery components.
  • By implementing closed-loop resource recovery models, leading industrial plants have improved their critical mineral extraction rates by 18% compared to conventional disposal methods. This integration of strategic resource recovery and strict environmental compliance ensures that waste processing becomes a core component of sustainable manufacturing operations rather than a mere end-of-pipe liability.

What will be the Size of the Hazardous Waste Management Market during the forecast period?

Get Key Insights on Market Forecast (PDF) Get Free Sample

How is the Hazardous Waste Management Market Segmented?

The hazardous waste management industry research report provides comprehensive data (region-wise segment analysis), with forecasts and estimates in "USD million" for the period 2026-2030, as well as historical data from 2020-2024 for the following segments.

  • Product
    • Industrial
    • Medical
    • Others
  • Type
    • Solid
    • Liquid
    • Sludge
  • Sector
    • Corrosive
    • Flammable
    • Infectious
    • Radioactive
    • Toxic
  • Service
    • Collection
    • Disposal services
    • Storage
    • Transportation
    • Waste treatment
  • Capacity
    • Large quantity hazardous waste generators
    • Medium quantity hazardous waste generators
    • Small quantity hazardous waste generators
  • Geography
    • APAC
      • China
      • Japan
      • India
      • South Korea
      • Australia
      • Indonesia
    • Europe
      • Germany
      • UK
      • France
      • Italy
      • Spain
      • The Netherlands
    • North America
      • US
      • Canada
      • Mexico
    • South America
      • Brazil
      • Argentina
      • Chile
    • Middle East and Africa
      • Saudi Arabia
      • UAE
      • South Africa
      • Turkey
      • Israel

By Product Insights

The industrial segment is estimated to witness significant growth during the forecast period.

Industrial applications represent the most critical volume generator for specialized disposal services, demanding advanced physico-chemical treatment and robust infrastructure. Manufacturing and petrochemical facilities must neutralize massive quantities of industrial effluent and volatile organic compounds to prevent ecological damage.

Consequently, operators are integrating supercritical water oxidation and plasma gasification technologies, improving waste destruction efficiency by 22% compared to traditional burning. This technological shift directly reduces long-term liability costs, enabling plants to meet stricter zero-liquid discharge mandates.

Corrosive acid neutralization and advanced effluent filtration systems have lowered equipment degradation rates by 15% across major processing hubs. By deploying localized chemical neutralization units, large-scale generators cut transportation risks and ensure comprehensive compliance.

This continuous technological integration secures sustainable manufacturing while treating complex liquid byproducts at their source.

Get Free Sample

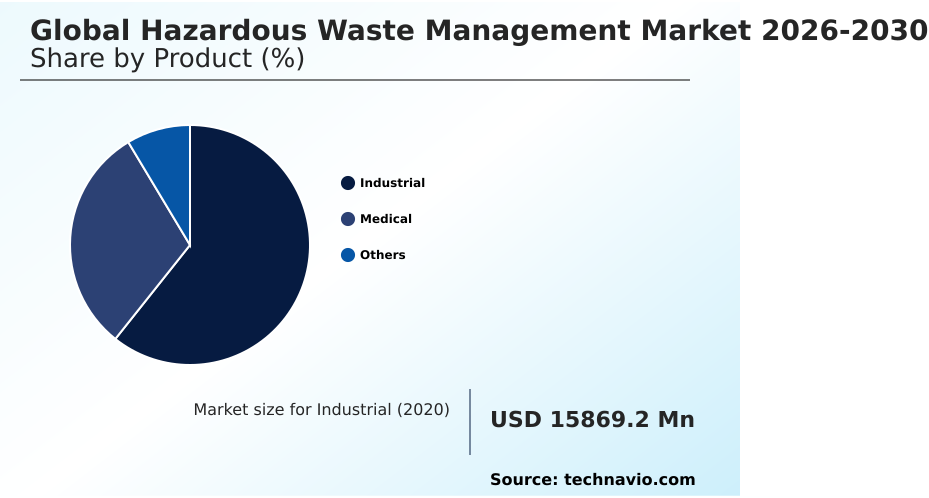
The Industrial segment was valued at USD 20.02 billion in 2024 and showed a gradual increase during the forecast period.

Get Free Sample

Regional Analysis

APAC is estimated to contribute 54.7% to the growth of the global market during the forecast period.Technavio’s analysts have elaborately explained the regional trends and drivers that shape the market during the forecast period.

See How Hazardous Waste Management Market Demand is Rising in APAC Get Free Sample

The geographic distribution of processing infrastructure reveals stark contrasts between established and rapidly industrializing regions. North America prioritizes deep geological repository investments and secure landfill engineering, driven by legacy industrial policies.

In contrast, APAC focuses heavily on electronic waste processing and lithium-ion battery recycling to support its massive electronics manufacturing hubs. Consequently, specialized thermal desorption and physico-chemical treatment facilities in APAC process 30% more volume annually than their North American counterparts.

This fundamental difference in supply chain requirements forces APAC operators to optimize heavy metal extraction capabilities, improving secondary raw material recovery rates by 22%.

Furthermore, strict policies regarding naturally occurring radioactive material in North America have increased radioactive isotope containment costs by 15%, whereas APAC focuses on scaling high-capacity throughput to match rapid urban manufacturing expansion.

Market Dynamics

Our researchers analyzed the data with 2025 as the base year, along with the key drivers, trends, and challenges. A holistic analysis of drivers will help companies refine their marketing strategies to gain a competitive advantage.

  • The strategic optimization of toxic byproduct handling relies heavily on deploying highly specialized neutralization and extraction technologies. As global manufacturing scales, operators are increasingly implementing an industrial chemical waste neutralization process to safely manage volatile effluents before they breach environmental thresholds. This proactive approach significantly reduces long-term liability and infrastructure corrosion.
  • Simultaneously, the surge in healthcare facility expansions has driven the critical need for clinical biohazard material high-temperature destruction, ensuring that infectious pathogens are completely eradicated without generating secondary atmospheric pollutants.
  • In the renewable energy and automotive sectors, the integration of lithium battery electrolyte extraction techniques has transformed end-of-life battery management into a lucrative resource recovery pipeline, improving critical metal salvage yields by 24% over standard smelting. This direct operational efficiency gain strengthens global supply chain resilience for rare earth elements.
  • Furthermore, the petroleum sector relies on complex petrochemical sludge dewatering systems to reduce transport weight and disposal volumes, lowering logistics expenses by nearly 18%. Finally, regulatory crackdowns on toxic synthetic compounds necessitate forever chemicals thermal degradation methods to permanently break carbon-fluorine bonds.
  • By adopting these advanced technological frameworks, modern enterprises ensure regulatory compliance while optimizing their overall operational planning and waste lifecycle expenditures.

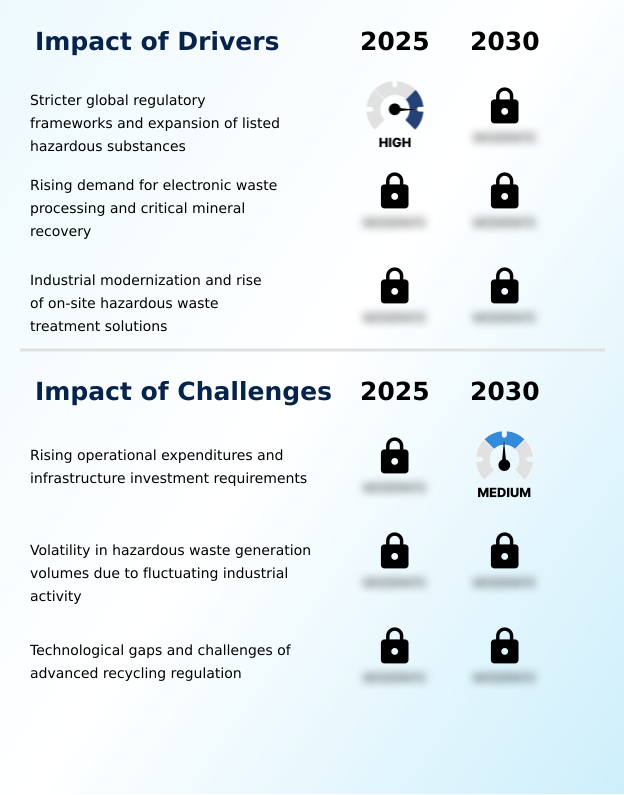
What are the key market drivers leading to the rise in the adoption of Hazardous Waste Management Industry?

  • Stricter global regulatory frameworks and the continuous expansion of listed hazardous substances act as primary catalysts for market expansion.

  • The exponential rise in specialized manufacturing outputs serves as the primary catalyst for scaling advanced neutralization infrastructure.
  • Because international regulators are actively expanding the classifications for hazardous materials, industrial producers must invest in per- and polyfluoroalkyl substances destruction technologies to avoid severe legal penalties.
  • This regulatory pressure impacts businesses by driving the adoption of high-efficiency solvent distillation and chemical stabilization protocols. Facilities utilizing submerged shredding for volatile components have reduced thermal runaway incidents by 34%, ensuring safer processing environments.
  • Additionally, implementing hydrometallurgical recycling systems has improved critical mineral recovery yields by 21%, lowering dependence on virgin mining. This continuous infrastructure modernization directly aligns environmental compliance with tangible operational cost reductions.

What are the market trends shaping the Hazardous Waste Management Industry?

  • Advanced thermal treatment and energy recovery systems have emerged as a dominant trend within the industry. This strategic adoption reflects a broader shift toward sustainable operational practices and regulatory alignment.

  • The transition toward circular industrial ecosystems is forcing manufacturers to adopt advanced material reclamation technologies over traditional disposal. Tightening regulations regarding persistent organic pollutants act as the primary cause, compelling facilities to implement closed-loop resource recovery models to permanently neutralize toxic flame retardants. Consequently, this shift impacts businesses by converting complex chemical liabilities into valuable secondary raw materials.
  • Facilities utilizing granular activated carbon and sophisticated ion exchange resins have improved their heavy metal filtration efficiency by 26%. Furthermore, integrating automated sorting robotics into processing lines has reduced manual exposure risks and increased throughput speeds by 19%. This technological adoption ensures that enterprises maintain strict environmental compliance while optimizing overall resource utilization.

What challenges does the Hazardous Waste Management Industry face during its growth?

  • Rising operational expenditures and the necessity for massive infrastructure investments represent significant hurdles for continuous industry growth.

  • The escalating technical complexity of modern industrial byproducts imposes severe operational limitations on processing facilities. Because advanced manufacturing generates highly volatile mixtures, operators are forced to deploy extremely capital-intensive secondary containment barrier and groundwater contamination prevention systems. This structural requirement impacts businesses by significantly increasing upfront infrastructure expenditures and maintenance overhead.
  • Specifically, upgrading legacy facilities with modern emission control filtration and flue gas desulfurization units has raised processing costs by 27% across key industrial hubs. Furthermore, managing concentrated residuals requires precise sludge dewatering and continuous hazardous sludge handling protocols to prevent equipment degradation. These substantial financial and technical hurdles strain operational margins, limiting the expansion capabilities of smaller environmental service providers.

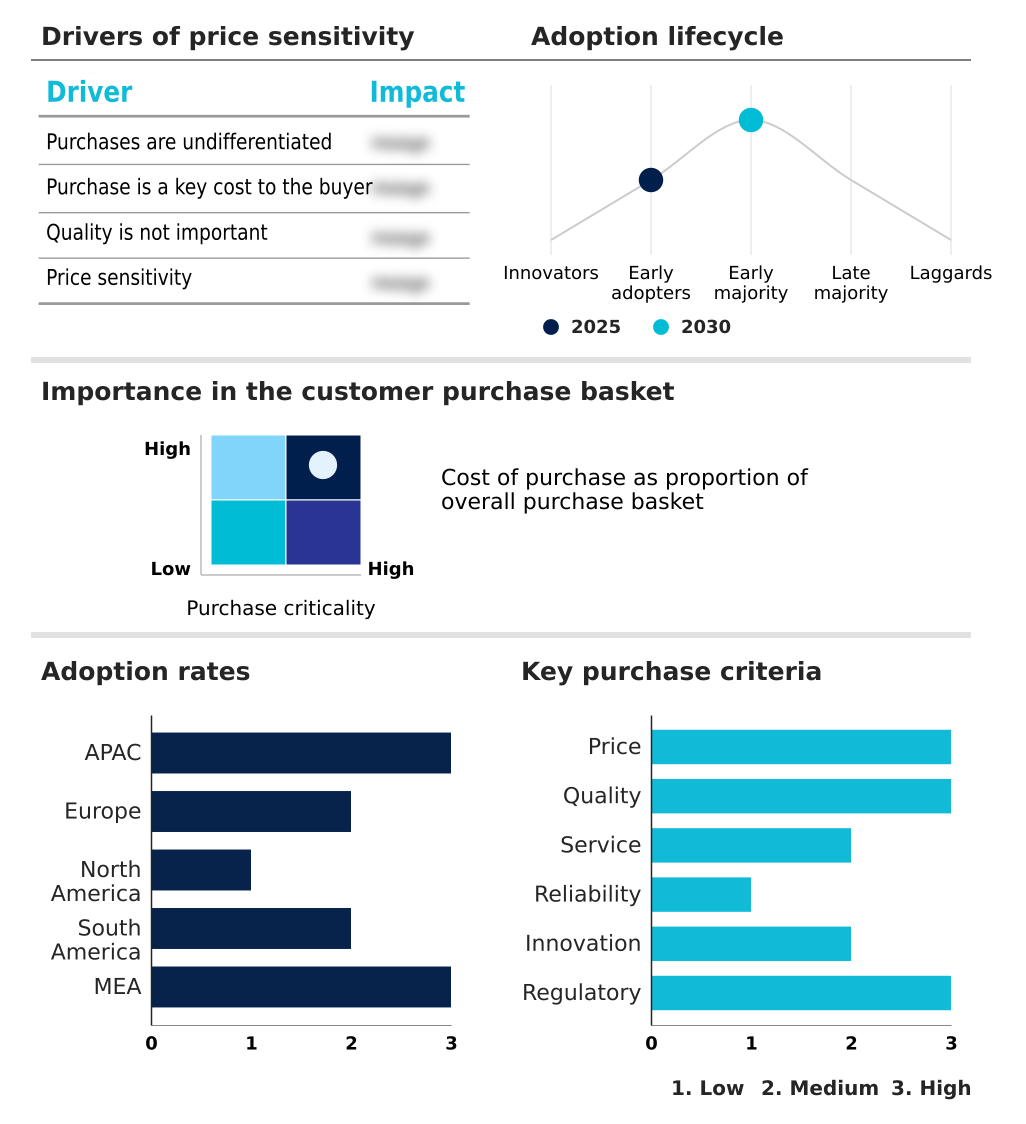
Exclusive Technavio Analysis on Customer Landscape

The hazardous waste management market forecasting report includes the adoption lifecycle of the market, covering from the innovator’s stage to the laggard’s stage. It focuses on adoption rates in different regions based on penetration. Furthermore, the hazardous waste management market report also includes key purchase criteria and drivers of price sensitivity to help companies evaluate and develop their market growth analysis strategies.

Customer Landscape of Hazardous Waste Management Industry

Competitive Landscape

Companies are implementing various strategies, such as strategic alliances, hazardous waste management market forecast, partnerships, mergers and acquisitions, geographical expansion, and product/service launches, to enhance their presence in the industry.

Avalon Holdings Corp - Hazardous waste management services deliver comprehensive industrial waste treatment, wastewater processing, emergency spill response, and customized recycling solutions to ensure strict regulatory compliance and optimize environmental safety protocols.

The industry research and growth report includes detailed analyses of the competitive landscape of the market and information about key companies, including:

  • Avalon Holdings Corp
  • Averda
  • Bechtel Corp.
  • Chloros Environmental Ltd.
  • Clean Harbors Inc.
  • Daniels Health
  • Environ India
  • GreenTech Environ Management
  • Grupo Tradebe Medioambiente SL
  • Hazardous Waste Experts
  • HWH Environmental
  • Recology Inc.
  • REMONDIS Medison GmbH
  • Republic Services Inc.
  • Seche Environnement SA
  • Sharps Medical Waste Services
  • SMS Envocare Ltd.
  • Veolia Environment SA
  • Waste Connections Inc.
  • Waste Management Inc.

Qualitative and quantitative analysis of companies has been conducted to help clients understand the wider business environment as well as the strengths and weaknesses of key industry players. Data is qualitatively analyzed to categorize companies as pure play, category-focused, industry-focused, and diversified; it is quantitatively analyzed to categorize companies as dominant, leading, strong, tentative, and weak.

Recent Development and News in Hazardous waste management market

  • In the Environmental and Facilities Services industry, the regulatory shift toward mandatory digital manifest tracking has modernized logistics networks, directly impacting Hazardous Waste Management demand by increasing the need for precise container monitoring.
  • The rapid expansion of lithium-ion battery infrastructure has advanced recycling capabilities, directly impacting Hazardous Waste Management demand by requiring specialized secondary containment barriers for highly flammable electrolytes.
  • Stricter enforcement of industrial manufacturer audit requirements has fundamentally altered operational workflows, directly impacting Hazardous Waste Management demand by accelerating the adoption of automated environmental compliance reporting software.
  • The implementation of more aggressive effluent mandates has forced manufacturing facilities to upgrade wastewater infrastructure, directly impacting Hazardous Waste Management demand by driving the deployment of advanced groundwater contamination prevention filtration systems.

Dive into Technavio’s robust research methodology, blending expert interviews, extensive data synthesis, and validated models for unparalleled Hazardous Waste Management Market insights. See full methodology.

Market Scope
Page number 354
Base year 2025
Historic period 2020-2024
Forecast period 2026-2030
Growth momentum & CAGR Accelerate at a CAGR of 7.6%
Market growth 2026-2030 USD 15822.1 million
Market structure Fragmented
YoY growth 2025-2026(%) 7.0%
Key countries China, Japan, India, South Korea, Australia, Indonesia, Germany, UK, France, Italy, Spain, The Netherlands, US, Canada, Mexico, Brazil, Argentina, Chile, Saudi Arabia, UAE, South Africa, Turkey and Israel
Competitive landscape Leading Companies, Market Positioning of Companies, Competitive Strategies, and Industry Risks

Request Free Sample

Research Analyst Overview

  • Stringent environmental mandates are fundamentally reshaping operational priorities across the industrial sector, driving a rapid transition toward advanced neutralization technologies. Heavy manufacturing facilities are increasingly abandoning traditional disposal methods in favor of high-temperature incineration and pyrolysis processing to permanently destroy toxic organic compounds.
  • This strategic shift directly addresses boardroom-level compliance and budgeting concerns by mitigating the long-term liabilities associated with soil and groundwater contamination. By adopting an automated vitrification process alongside sophisticated leachate collection system infrastructure, facility managers have reduced unexpected containment breach incidents by over 28%.
  • Furthermore, the integration of bioremediation agents and advanced anaerobic digestion allows petrochemical operators to neutralize volatile organic waste more efficiently at the point of generation. The continuous evolution of these complex processing technologies ensures that enterprises can navigate international protocols without sacrificing production capacity.
  • Implementing microwave disinfection and autoclave sterilization for biohazardous materials further streamlines logistics, cementing advanced processing infrastructure as a core pillar of sustainable industrial operations and risk management.

What are the Key Data Covered in this Hazardous Waste Management Market Research and Growth Report?

  • What is the expected growth of the Hazardous Waste Management Market between 2026 and 2030?

    • USD 15.82 billion, at a CAGR of 7.6%

  • What segmentation does the market report cover?

    • The report is segmented by Product (Industrial, Medical, and Others), Type (Solid, Liquid, and Sludge), Sector (Corrosive, Flammable, Infectious, Radioactive, and Toxic), Service (Collection, Disposal services, Storage, Transportation, and Waste treatment), Capacity (Large quantity hazardous waste generators, Medium quantity hazardous waste generators, and Small quantity hazardous waste generators) and Geography (APAC, Europe, North America, South America, Middle East and Africa)

  • Which regions are analyzed in the report?

    • APAC, Europe, North America, South America and Middle East and Africa

  • What are the key growth drivers and market challenges?

    • Stricter global regulatory frameworks and expansion of listed hazardous substances, Rising operational expenditures and infrastructure investment requirements

  • Who are the major players in the Hazardous Waste Management Market?

    • Avalon Holdings Corp, Averda, Bechtel Corp., Chloros Environmental Ltd., Clean Harbors Inc., Daniels Health, Environ India, GreenTech Environ Management, Grupo Tradebe Medioambiente SL, Hazardous Waste Experts, HWH Environmental, Recology Inc., REMONDIS Medison GmbH, Republic Services Inc., Seche Environnement SA, Sharps Medical Waste Services, SMS Envocare Ltd., Veolia Environment SA, Waste Connections Inc. and Waste Management Inc.

Market Research Insights

  • The Hazardous Waste Management Market continuously evolves to address increasingly complex toxic byproducts from advanced manufacturing and healthcare sectors. Industrial operators are rapidly adopting secure landfill engineering and digital manifest tracking to mitigate liability and optimize supply chain transparency.
  • By deploying iot sensor integration across disposal fleets, logistics coordinators have improved route efficiency by 14% and reduced unauthorized dumping incidents by nearly 21%. Furthermore, comprehensive cradle-to-grave audit processes and strict protocols for medical sharps disposal and pathological material handling ensure compliance with international mandates, lowering potential administrative penalty risks by 35%.
  • This strategic focus on verifiable environmental compliance reporting translates into tangible operational cost reductions, transforming toxic waste handling from a pure regulatory burden into a highly monitored, data-driven operational asset.

We can help! Our analysts can customize this hazardous waste management market research report to meet your requirements.

Get in touch

1. Executive Summary

1.1 Market overview

Executive Summary - Chart on Market Overview
Executive Summary - Data Table on Market Overview
Executive Summary - Chart on Global Market Characteristics
Executive Summary - Chart on Market by Geography
Executive Summary - Chart on Market Segmentation by Product
Executive Summary - Chart on Market Segmentation by Type
Executive Summary - Chart on Market Segmentation by Sector
Executive Summary - Chart on Market Segmentation by Service
Executive Summary - Chart on Market Segmentation by Capacity
Executive Summary - Chart on Incremental Growth
Executive Summary - Data Table on Incremental Growth
Executive Summary - Chart on Company Market Positioning

2. Technavio Analysis

2.1 Analysis of price sensitivity, lifecycle, customer purchase basket, adoption rates, and purchase criteria

2.2 Criticality of inputs and Factors of differentiation

Chart on Overview on criticality of inputs and factors of differentiation

2.3 Factors of disruption

Chart on Overview on factors of disruption

2.4 Impact of drivers and challenges

Chart on Impact of drivers and challenges in 2025 and 2030

3. Market Landscape

3.1 Market ecosystem

Chart on Parent Market
Data Table on - Parent Market

3.2 Market characteristics

Chart on Market characteristics analysis

3.3 Value chain analysis

Chart on Value chain analysis

4. Market Sizing

4.1 Market definition

Data Table on Offerings of companies included in the market definition

4.2 Market segment analysis

Market segments

4.3 Market size 2025

4.4 Market outlook: Forecast for 2025-2030

Chart on Global - Market size and forecast 2025-2030 ($ million)
Data Table on Global - Market size and forecast 2025-2030 ($ million)
Chart on Global Market: Year-over-year growth 2025-2030 (%)
Data Table on Global Market: Year-over-year growth 2025-2030 (%)

5. Historic Market Size

5.1 Global Hazardous Waste Management Market 2020 - 2024

Historic Market Size - Data Table on Global Hazardous Waste Management Market 2020 - 2024 ($ million)

5.2 Product segment analysis 2020 - 2024

Historic Market Size - Product Segment 2020 - 2024 ($ million)

5.3 Type segment analysis 2020 - 2024

Historic Market Size - Type Segment 2020 - 2024 ($ million)

5.4 Sector segment analysis 2020 - 2024

Historic Market Size - Sector Segment 2020 - 2024 ($ million)

5.5 Service segment analysis 2020 - 2024

Historic Market Size - Service Segment 2020 - 2024 ($ million)

5.6 Capacity segment analysis 2020 - 2024

Historic Market Size - Capacity Segment 2020 - 2024 ($ million)

5.7 Geography segment analysis 2020 - 2024

Historic Market Size - Geography Segment 2020 - 2024 ($ million)

5.8 Country segment analysis 2020 - 2024

Historic Market Size - Country Segment 2020 - 2024 ($ million)

6. Qualitative Analysis

6.1 Impact of AI on global hazardous waste management market

6.2 Impact of geopolitical conflict on global hazardous waste management market

7. Five Forces Analysis

7.1 Five forces summary

Five forces analysis - Comparison between 2025 and 2030

7.2 Bargaining power of buyers

Bargaining power of buyers - Impact of key factors 2025 and 2030

7.3 Bargaining power of suppliers

Bargaining power of suppliers - Impact of key factors in 2025 and 2030

7.4 Threat of new entrants

Threat of new entrants - Impact of key factors in 2025 and 2030

7.5 Threat of substitutes

Threat of substitutes - Impact of key factors in 2025 and 2030

7.6 Threat of rivalry

Threat of rivalry - Impact of key factors in 2025 and 2030

7.7 Market condition

Chart on Market condition - Five forces 2025 and 2030

8. Market Segmentation by Product

8.1 Market segments

Chart on Product - Market share 2025-2030 (%)
Data Table on Product - Market share 2025-2030 (%)

8.2 Comparison by Product

Chart on Comparison by Product
Data Table on Comparison by Product

8.3 Industrial - Market size and forecast 2025-2030

Chart on Industrial - Market size and forecast 2025-2030 ($ million)
Data Table on Industrial - Market size and forecast 2025-2030 ($ million)
Chart on Industrial - Year-over-year growth 2025-2030 (%)
Data Table on Industrial - Year-over-year growth 2025-2030 (%)

8.4 Medical - Market size and forecast 2025-2030

Chart on Medical - Market size and forecast 2025-2030 ($ million)
Data Table on Medical - Market size and forecast 2025-2030 ($ million)
Chart on Medical - Year-over-year growth 2025-2030 (%)
Data Table on Medical - Year-over-year growth 2025-2030 (%)

8.5 Others - Market size and forecast 2025-2030

Chart on Others - Market size and forecast 2025-2030 ($ million)
Data Table on Others - Market size and forecast 2025-2030 ($ million)
Chart on Others - Year-over-year growth 2025-2030 (%)
Data Table on Others - Year-over-year growth 2025-2030 (%)

8.6 Market opportunity by Product

Market opportunity by Product ($ million)
Data Table on Market opportunity by Product ($ million)

9. Market Segmentation by Type

9.1 Market segments

Chart on Type - Market share 2025-2030 (%)
Data Table on Type - Market share 2025-2030 (%)

9.2 Comparison by Type

Chart on Comparison by Type
Data Table on Comparison by Type

9.3 Solid - Market size and forecast 2025-2030

Chart on Solid - Market size and forecast 2025-2030 ($ million)
Data Table on Solid - Market size and forecast 2025-2030 ($ million)
Chart on Solid - Year-over-year growth 2025-2030 (%)
Data Table on Solid - Year-over-year growth 2025-2030 (%)

9.4 Liquid - Market size and forecast 2025-2030

Chart on Liquid - Market size and forecast 2025-2030 ($ million)
Data Table on Liquid - Market size and forecast 2025-2030 ($ million)
Chart on Liquid - Year-over-year growth 2025-2030 (%)
Data Table on Liquid - Year-over-year growth 2025-2030 (%)

9.5 Sludge - Market size and forecast 2025-2030

Chart on Sludge - Market size and forecast 2025-2030 ($ million)
Data Table on Sludge - Market size and forecast 2025-2030 ($ million)
Chart on Sludge - Year-over-year growth 2025-2030 (%)
Data Table on Sludge - Year-over-year growth 2025-2030 (%)

9.6 Market opportunity by Type

Market opportunity by Type ($ million)
Data Table on Market opportunity by Type ($ million)

10. Market Segmentation by Sector

10.1 Market segments

Chart on Sector - Market share 2025-2030 (%)
Data Table on Sector - Market share 2025-2030 (%)

10.2 Comparison by Sector

Chart on Comparison by Sector
Data Table on Comparison by Sector

10.3 Corrosive - Market size and forecast 2025-2030

Chart on Corrosive - Market size and forecast 2025-2030 ($ million)
Data Table on Corrosive - Market size and forecast 2025-2030 ($ million)
Chart on Corrosive - Year-over-year growth 2025-2030 (%)
Data Table on Corrosive - Year-over-year growth 2025-2030 (%)

10.4 Flammable - Market size and forecast 2025-2030

Chart on Flammable - Market size and forecast 2025-2030 ($ million)
Data Table on Flammable - Market size and forecast 2025-2030 ($ million)
Chart on Flammable - Year-over-year growth 2025-2030 (%)
Data Table on Flammable - Year-over-year growth 2025-2030 (%)

10.5 Infectious - Market size and forecast 2025-2030

Chart on Infectious - Market size and forecast 2025-2030 ($ million)
Data Table on Infectious - Market size and forecast 2025-2030 ($ million)
Chart on Infectious - Year-over-year growth 2025-2030 (%)
Data Table on Infectious - Year-over-year growth 2025-2030 (%)

10.6 Radioactive - Market size and forecast 2025-2030

Chart on Radioactive - Market size and forecast 2025-2030 ($ million)
Data Table on Radioactive - Market size and forecast 2025-2030 ($ million)
Chart on Radioactive - Year-over-year growth 2025-2030 (%)
Data Table on Radioactive - Year-over-year growth 2025-2030 (%)

10.7 Toxic - Market size and forecast 2025-2030

Chart on Toxic - Market size and forecast 2025-2030 ($ million)
Data Table on Toxic - Market size and forecast 2025-2030 ($ million)
Chart on Toxic - Year-over-year growth 2025-2030 (%)
Data Table on Toxic - Year-over-year growth 2025-2030 (%)

10.8 Market opportunity by Sector

Market opportunity by Sector ($ million)
Data Table on Market opportunity by Sector ($ million)

11. Market Segmentation by Service

11.1 Market segments

Chart on Service - Market share 2025-2030 (%)
Data Table on Service - Market share 2025-2030 (%)

11.2 Comparison by Service

Chart on Comparison by Service
Data Table on Comparison by Service

11.3 Collection - Market size and forecast 2025-2030

Chart on Collection - Market size and forecast 2025-2030 ($ million)
Data Table on Collection - Market size and forecast 2025-2030 ($ million)
Chart on Collection - Year-over-year growth 2025-2030 (%)
Data Table on Collection - Year-over-year growth 2025-2030 (%)

11.4 Disposal services - Market size and forecast 2025-2030

Chart on Disposal services - Market size and forecast 2025-2030 ($ million)
Data Table on Disposal services - Market size and forecast 2025-2030 ($ million)
Chart on Disposal services - Year-over-year growth 2025-2030 (%)
Data Table on Disposal services - Year-over-year growth 2025-2030 (%)

11.5 Storage - Market size and forecast 2025-2030

Chart on Storage - Market size and forecast 2025-2030 ($ million)
Data Table on Storage - Market size and forecast 2025-2030 ($ million)
Chart on Storage - Year-over-year growth 2025-2030 (%)
Data Table on Storage - Year-over-year growth 2025-2030 (%)

11.6 Transportation - Market size and forecast 2025-2030

Chart on Transportation - Market size and forecast 2025-2030 ($ million)
Data Table on Transportation - Market size and forecast 2025-2030 ($ million)
Chart on Transportation - Year-over-year growth 2025-2030 (%)
Data Table on Transportation - Year-over-year growth 2025-2030 (%)

11.7 Waste treatment - Market size and forecast 2025-2030

Chart on Waste treatment - Market size and forecast 2025-2030 ($ million)
Data Table on Waste treatment - Market size and forecast 2025-2030 ($ million)
Chart on Waste treatment - Year-over-year growth 2025-2030 (%)
Data Table on Waste treatment - Year-over-year growth 2025-2030 (%)

11.8 Market opportunity by Service

Market opportunity by Service ($ million)
Data Table on Market opportunity by Service ($ million)

12. Market Segmentation by Capacity

12.1 Market segments

Chart on Capacity - Market share 2025-2030 (%)
Data Table on Capacity - Market share 2025-2030 (%)

12.2 Comparison by Capacity

Chart on Comparison by Capacity
Data Table on Comparison by Capacity

12.3 Large quantity hazardous waste generators - Market size and forecast 2025-2030

Chart on Large quantity hazardous waste generators - Market size and forecast 2025-2030 ($ million)
Data Table on Large quantity hazardous waste generators - Market size and forecast 2025-2030 ($ million)
Chart on Large quantity hazardous waste generators - Year-over-year growth 2025-2030 (%)
Data Table on Large quantity hazardous waste generators - Year-over-year growth 2025-2030 (%)

12.4 Medium quantity hazardous waste generators - Market size and forecast 2025-2030

Chart on Medium quantity hazardous waste generators - Market size and forecast 2025-2030 ($ million)
Data Table on Medium quantity hazardous waste generators - Market size and forecast 2025-2030 ($ million)
Chart on Medium quantity hazardous waste generators - Year-over-year growth 2025-2030 (%)
Data Table on Medium quantity hazardous waste generators - Year-over-year growth 2025-2030 (%)

12.5 Small quantity hazardous waste generators - Market size and forecast 2025-2030

Chart on Small quantity hazardous waste generators - Market size and forecast 2025-2030 ($ million)
Data Table on Small quantity hazardous waste generators - Market size and forecast 2025-2030 ($ million)
Chart on Small quantity hazardous waste generators - Year-over-year growth 2025-2030 (%)
Data Table on Small quantity hazardous waste generators - Year-over-year growth 2025-2030 (%)

12.6 Market opportunity by Capacity

Market opportunity by Capacity ($ million)
Data Table on Market opportunity by Capacity ($ million)

13. Customer Landscape

13.1 Customer landscape overview

Analysis of price sensitivity, lifecycle, customer purchase basket, adoption rates, and purchase criteria

14. Geographic Landscape

14.1 Geographic segmentation

Chart on Market share by geography 2025-2030 (%)
Data Table on Market share by geography 2025-2030 (%)

14.2 Geographic comparison

Chart on Geographic comparison
Data Table on Geographic comparison

14.3 APAC - Market size and forecast 2025-2030

Chart on APAC - Market size and forecast 2025-2030 ($ million)
Data Table on APAC - Market size and forecast 2025-2030 ($ million)
Chart on APAC - Year-over-year growth 2025-2030 (%)
Data Table on APAC - Year-over-year growth 2025-2030 (%)
Chart on Regional Comparison - APAC
Data Table on Regional Comparison - APAC

14.3.1 China - Market size and forecast 2025-2030

Chart on China - Market size and forecast 2025-2030 ($ million)
Data Table on China - Market size and forecast 2025-2030 ($ million)
Chart on China - Year-over-year growth 2025-2030 (%)
Data Table on China - Year-over-year growth 2025-2030 (%)

14.3.2 Japan - Market size and forecast 2025-2030

Chart on Japan - Market size and forecast 2025-2030 ($ million)
Data Table on Japan - Market size and forecast 2025-2030 ($ million)
Chart on Japan - Year-over-year growth 2025-2030 (%)
Data Table on Japan - Year-over-year growth 2025-2030 (%)

14.3.3 India - Market size and forecast 2025-2030

Chart on India - Market size and forecast 2025-2030 ($ million)
Data Table on India - Market size and forecast 2025-2030 ($ million)
Chart on India - Year-over-year growth 2025-2030 (%)
Data Table on India - Year-over-year growth 2025-2030 (%)

14.3.4 South Korea - Market size and forecast 2025-2030

Chart on South Korea - Market size and forecast 2025-2030 ($ million)
Data Table on South Korea - Market size and forecast 2025-2030 ($ million)
Chart on South Korea - Year-over-year growth 2025-2030 (%)
Data Table on South Korea - Year-over-year growth 2025-2030 (%)

14.3.5 Australia - Market size and forecast 2025-2030

Chart on Australia - Market size and forecast 2025-2030 ($ million)
Data Table on Australia - Market size and forecast 2025-2030 ($ million)
Chart on Australia - Year-over-year growth 2025-2030 (%)
Data Table on Australia - Year-over-year growth 2025-2030 (%)

14.3.6 Indonesia - Market size and forecast 2025-2030

Chart on Indonesia - Market size and forecast 2025-2030 ($ million)
Data Table on Indonesia - Market size and forecast 2025-2030 ($ million)
Chart on Indonesia - Year-over-year growth 2025-2030 (%)
Data Table on Indonesia - Year-over-year growth 2025-2030 (%)

14.4 Europe - Market size and forecast 2025-2030

Chart on Europe - Market size and forecast 2025-2030 ($ million)
Data Table on Europe - Market size and forecast 2025-2030 ($ million)
Chart on Europe - Year-over-year growth 2025-2030 (%)
Data Table on Europe - Year-over-year growth 2025-2030 (%)
Chart on Regional Comparison - Europe
Data Table on Regional Comparison - Europe

14.4.1 Germany - Market size and forecast 2025-2030

Chart on Germany - Market size and forecast 2025-2030 ($ million)
Data Table on Germany - Market size and forecast 2025-2030 ($ million)
Chart on Germany - Year-over-year growth 2025-2030 (%)
Data Table on Germany - Year-over-year growth 2025-2030 (%)

14.4.2 UK - Market size and forecast 2025-2030

Chart on UK - Market size and forecast 2025-2030 ($ million)
Data Table on UK - Market size and forecast 2025-2030 ($ million)
Chart on UK - Year-over-year growth 2025-2030 (%)
Data Table on UK - Year-over-year growth 2025-2030 (%)

14.4.3 France - Market size and forecast 2025-2030

Chart on France - Market size and forecast 2025-2030 ($ million)
Data Table on France - Market size and forecast 2025-2030 ($ million)
Chart on France - Year-over-year growth 2025-2030 (%)
Data Table on France - Year-over-year growth 2025-2030 (%)

14.4.4 Italy - Market size and forecast 2025-2030

Chart on Italy - Market size and forecast 2025-2030 ($ million)
Data Table on Italy - Market size and forecast 2025-2030 ($ million)
Chart on Italy - Year-over-year growth 2025-2030 (%)
Data Table on Italy - Year-over-year growth 2025-2030 (%)

14.4.5 Spain - Market size and forecast 2025-2030

Chart on Spain - Market size and forecast 2025-2030 ($ million)
Data Table on Spain - Market size and forecast 2025-2030 ($ million)
Chart on Spain - Year-over-year growth 2025-2030 (%)
Data Table on Spain - Year-over-year growth 2025-2030 (%)

14.4.6 The Netherlands - Market size and forecast 2025-2030

Chart on The Netherlands - Market size and forecast 2025-2030 ($ million)
Data Table on The Netherlands - Market size and forecast 2025-2030 ($ million)
Chart on The Netherlands - Year-over-year growth 2025-2030 (%)
Data Table on The Netherlands - Year-over-year growth 2025-2030 (%)

14.5 North America - Market size and forecast 2025-2030

Chart on North America - Market size and forecast 2025-2030 ($ million)
Data Table on North America - Market size and forecast 2025-2030 ($ million)
Chart on North America - Year-over-year growth 2025-2030 (%)
Data Table on North America - Year-over-year growth 2025-2030 (%)
Chart on Regional Comparison - North America
Data Table on Regional Comparison - North America

14.5.1 US - Market size and forecast 2025-2030

Chart on US - Market size and forecast 2025-2030 ($ million)
Data Table on US - Market size and forecast 2025-2030 ($ million)
Chart on US - Year-over-year growth 2025-2030 (%)
Data Table on US - Year-over-year growth 2025-2030 (%)

14.5.2 Canada - Market size and forecast 2025-2030

Chart on Canada - Market size and forecast 2025-2030 ($ million)
Data Table on Canada - Market size and forecast 2025-2030 ($ million)
Chart on Canada - Year-over-year growth 2025-2030 (%)
Data Table on Canada - Year-over-year growth 2025-2030 (%)

14.5.3 Mexico - Market size and forecast 2025-2030

Chart on Mexico - Market size and forecast 2025-2030 ($ million)
Data Table on Mexico - Market size and forecast 2025-2030 ($ million)
Chart on Mexico - Year-over-year growth 2025-2030 (%)
Data Table on Mexico - Year-over-year growth 2025-2030 (%)

14.6 South America - Market size and forecast 2025-2030

Chart on South America - Market size and forecast 2025-2030 ($ million)
Data Table on South America - Market size and forecast 2025-2030 ($ million)
Chart on South America - Year-over-year growth 2025-2030 (%)
Data Table on South America - Year-over-year growth 2025-2030 (%)
Chart on Regional Comparison - South America
Data Table on Regional Comparison - South America

14.6.1 Brazil - Market size and forecast 2025-2030

Chart on Brazil - Market size and forecast 2025-2030 ($ million)
Data Table on Brazil - Market size and forecast 2025-2030 ($ million)
Chart on Brazil - Year-over-year growth 2025-2030 (%)
Data Table on Brazil - Year-over-year growth 2025-2030 (%)

14.6.2 Argentina - Market size and forecast 2025-2030

Chart on Argentina - Market size and forecast 2025-2030 ($ million)
Data Table on Argentina - Market size and forecast 2025-2030 ($ million)
Chart on Argentina - Year-over-year growth 2025-2030 (%)
Data Table on Argentina - Year-over-year growth 2025-2030 (%)

14.6.3 Chile - Market size and forecast 2025-2030

Chart on Chile - Market size and forecast 2025-2030 ($ million)
Data Table on Chile - Market size and forecast 2025-2030 ($ million)
Chart on Chile - Year-over-year growth 2025-2030 (%)
Data Table on Chile - Year-over-year growth 2025-2030 (%)

14.7 Middle East and Africa - Market size and forecast 2025-2030

Chart on Middle East and Africa - Market size and forecast 2025-2030 ($ million)
Data Table on Middle East and Africa - Market size and forecast 2025-2030 ($ million)
Chart on Middle East and Africa - Year-over-year growth 2025-2030 (%)
Data Table on Middle East and Africa - Year-over-year growth 2025-2030 (%)
Chart on Regional Comparison - Middle East and Africa
Data Table on Regional Comparison - Middle East and Africa

14.7.1 Saudi Arabia - Market size and forecast 2025-2030

Chart on Saudi Arabia - Market size and forecast 2025-2030 ($ million)
Data Table on Saudi Arabia - Market size and forecast 2025-2030 ($ million)
Chart on Saudi Arabia - Year-over-year growth 2025-2030 (%)
Data Table on Saudi Arabia - Year-over-year growth 2025-2030 (%)

14.7.2 UAE - Market size and forecast 2025-2030

Chart on UAE - Market size and forecast 2025-2030 ($ million)
Data Table on UAE - Market size and forecast 2025-2030 ($ million)
Chart on UAE - Year-over-year growth 2025-2030 (%)
Data Table on UAE - Year-over-year growth 2025-2030 (%)

14.7.3 South Africa - Market size and forecast 2025-2030

Chart on South Africa - Market size and forecast 2025-2030 ($ million)
Data Table on South Africa - Market size and forecast 2025-2030 ($ million)
Chart on South Africa - Year-over-year growth 2025-2030 (%)
Data Table on South Africa - Year-over-year growth 2025-2030 (%)

14.7.4 Turkey - Market size and forecast 2025-2030

Chart on Turkey - Market size and forecast 2025-2030 ($ million)
Data Table on Turkey - Market size and forecast 2025-2030 ($ million)
Chart on Turkey - Year-over-year growth 2025-2030 (%)
Data Table on Turkey - Year-over-year growth 2025-2030 (%)

14.7.5 Israel - Market size and forecast 2025-2030

Chart on Israel - Market size and forecast 2025-2030 ($ million)
Data Table on Israel - Market size and forecast 2025-2030 ($ million)
Chart on Israel - Year-over-year growth 2025-2030 (%)
Data Table on Israel - Year-over-year growth 2025-2030 (%)

14.8 Market opportunity by geography

Market opportunity by geography ($ million)
Data Tables on Market opportunity by geography ($ million)

15. Drivers, Challenges, and Opportunity

15.1 Market drivers

Stricter global regulatory frameworks and expansion of listed hazardous substances
Rising demand for electronic waste processing and critical mineral recovery
Industrial modernization and rise of on-site hazardous waste treatment solutions

15.2 Market challenges

Rising operational expenditures and infrastructure investment requirements
Volatility in hazardous waste generation volumes due to fluctuating industrial activity
Technological gaps and challenges of advanced recycling regulation

15.3 Impact of drivers and challenges

Impact of drivers and challenges in 2025 and 2030

15.4 Market opportunities

Adoption of advanced thermal treatment and energy recovery systems
Rising of specialized PFAS remediation and destruction services
Implementation of digital tracking and AI-driven compliance management

16. Competitive Landscape

16.1 Overview

16.2

Overview on criticality of inputs and factors of differentiation

16.3 Landscape disruption

Overview on factors of disruption

16.4 Industry risks

Impact of key risks on business

17. Competitive Analysis

17.1 Companies profiled

Companies covered

17.2 Company ranking index

17.3 Market positioning of companies

Matrix on companies position and classification

17.4 Avalon Holdings Corp

Avalon Holdings Corp - Overview
Avalon Holdings Corp - Business segments
Avalon Holdings Corp - Key offerings
Avalon Holdings Corp - Segment focus
SWOT

17.5 Averda

Averda - Overview
Averda - Product / Service
Averda - Key offerings
SWOT

17.6 Bechtel Corp.

Bechtel Corp. - Overview
Bechtel Corp. - Product / Service
Bechtel Corp. - Key offerings
SWOT

17.7 Clean Harbors Inc.

Clean Harbors Inc. - Overview
Clean Harbors Inc. - Business segments
Clean Harbors Inc. - Key news
Clean Harbors Inc. - Key offerings
Clean Harbors Inc. - Segment focus
SWOT

17.8 Daniels Health

Daniels Health - Overview
Daniels Health - Product / Service
Daniels Health - Key offerings
SWOT

17.9 Environ India

Environ India - Overview
Environ India - Product / Service
Environ India - Key offerings
SWOT

17.10 GreenTech Environ Management

GreenTech Environ Management - Overview
GreenTech Environ Management - Product / Service
GreenTech Environ Management - Key offerings
SWOT

17.11 Grupo Tradebe Medioambiente SL

Grupo Tradebe Medioambiente SL - Overview
Grupo Tradebe Medioambiente SL - Product / Service
Grupo Tradebe Medioambiente SL - Key offerings
SWOT

17.12 Recology Inc.

Recology Inc. - Overview
Recology Inc. - Product / Service
Recology Inc. - Key offerings
SWOT

17.13 Republic Services Inc.

Republic Services Inc. - Overview
Republic Services Inc. - Business segments
Republic Services Inc. - Key news
Republic Services Inc. - Key offerings
Republic Services Inc. - Segment focus
SWOT

17.14 Seche Environnement SA

Seche Environnement SA - Overview
Seche Environnement SA - Business segments
Seche Environnement SA - Key offerings
Seche Environnement SA - Segment focus
SWOT

17.15 Sharps Medical Waste Services

Sharps Medical Waste Services - Overview
Sharps Medical Waste Services - Product / Service
Sharps Medical Waste Services - Key offerings
SWOT

17.16 Veolia Environment SA

Veolia Environment SA - Overview
Veolia Environment SA - Business segments
Veolia Environment SA - Key news
Veolia Environment SA - Key offerings
Veolia Environment SA - Segment focus
SWOT

17.17 Waste Connections Inc.

Waste Connections Inc. - Overview
Waste Connections Inc. - Business segments
Waste Connections Inc. - Key offerings
Waste Connections Inc. - Segment focus
SWOT

17.18 Waste Management Inc.

Waste Management Inc. - Overview
Waste Management Inc. - Business segments
Waste Management Inc. - Key news
Waste Management Inc. - Key offerings
Waste Management Inc. - Segment focus
SWOT

18. Appendix

18.1 Scope of the report

Market definition
Objectives
Notes and caveats

18.2 Inclusions and exclusions checklist

Inclusions checklist
Exclusions checklist

18.3 Currency conversion rates for US$

18.4 Research methodology

18.5 Data procurement

Information sources

18.6 Data validation

18.7 Validation techniques employed for market sizing

18.8 Data synthesis

18.9 360 degree market analysis

18.10 List of abbreviations

Research Methodology

Technavio presents a detailed picture of the market by way of study, synthesis, and summation of data from multiple sources. The analysts have presented the various facets of the market with a particular focus on identifying the key industry influencers. The data thus presented is comprehensive, reliable, and the result of extensive research, both primary and secondary.

INFORMATION SOURCES

Primary sources

  • Manufacturers and suppliers
  • Channel partners
  • Industry experts
  • Strategic decision makers

Secondary sources

  • Industry journals and periodicals
  • Government data
  • Financial reports of key industry players
  • Historical data
  • Press releases

DATA ANALYSIS

Data Synthesis

  • Collation of data
  • Estimation of key figures
  • Analysis of derived insights

Data Validation

  • Triangulation with data models
  • Reference against proprietary databases
  • Corroboration with industry experts

REPORT WRITING

Qualitative

  • Market drivers
  • Market challenges
  • Market trends
  • Five forces analysis

Quantitative

  • Market size and forecast
  • Market segmentation
  • Geographical insights
  • Competitive landscape

Interested in this report?

Get your sample now to see our research methodology and insights!

Download Now

Frequently Asked Questions

Hazardous Waste Management market growth will increase by USD 15822.1 million during 2026-2030.

The Hazardous Waste Management market is expected to grow at a CAGR of 7.6% during 2026-2030.

Hazardous Waste Management market is segmented by Product (Industrial, Medical, Others) Type (Solid, Liquid, Sludge) Sector (Corrosive, Flammable, Infectious, Radioactive, Toxic) Service (Collection, Disposal services, Storage, Transportation, Waste treatment) Capacity (Large quantity hazardous waste generators, Medium quantity hazardous waste generators, Small quantity hazardous waste generators)

Avalon Holdings Corp, Averda, Bechtel Corp., Chloros Environmental Ltd., Clean Harbors Inc., Daniels Health, Environ India, GreenTech Environ Management, Grupo Tradebe Medioambiente SL, Hazardous Waste Experts, HWH Environmental, Recology Inc., REMONDIS Medison GmbH, Republic Services Inc., Seche Environnement SA, Sharps Medical Waste Services, SMS Envocare Ltd., Veolia Environment SA, Waste Connections Inc., Waste Management Inc. are a few of the key vendors in the Hazardous Waste Management market.

APAC will register the highest growth rate of 54.7% among the other regions. Therefore, the Hazardous Waste Management market in APAC is expected to garner significant business opportunities for the vendors during the forecast period.

China, Japan, India, South Korea, Australia, Indonesia, Germany, UK, France, Italy, Spain, The Netherlands, US, Canada, Mexico, Brazil, Argentina, Chile, Saudi Arabia, UAE, South Africa, Turkey, Israel

  • Stricter global regulatory frameworks and expansion of listed hazardous substances is the driving factor this market.

The Hazardous Waste Management market vendors should focus on grabbing business opportunities from the Product segment as it accounted for the largest market share in the base year.
RIA - Research AI Assistant
Ask RIA