Herbal Extract Market Analysis, Size, and Forecast 2026-2030: APAC (China, India, and Japan), North America (US, Canada, and Mexico), Europe (Germany, UK, and France), Middle East and Africa (Saudi Arabia, UAE, and Turkey), South America (Brazil and Argentina), and Rest of World (ROW)

Herbal Extract Market Analysis, Size, and Forecast 2026-2030:
APAC (China, India, and Japan), North America (US, Canada, and Mexico), Europe (Germany, UK, and France), Middle East and Africa (Saudi Arabia, UAE, and Turkey), South America (Brazil and Argentina), and Rest of World (ROW)

Published: Dec 2025 293 Pages SKU: IRTNTR71747

Market Overview at a Glance

$59.86 B
Market Opportunity
17.1%
CAGR 2025 - 2030
34%
APAC Growth
$26.27 B
Pharmaceuticals segment 2024

Herbal Extract Market Size 2026-2030

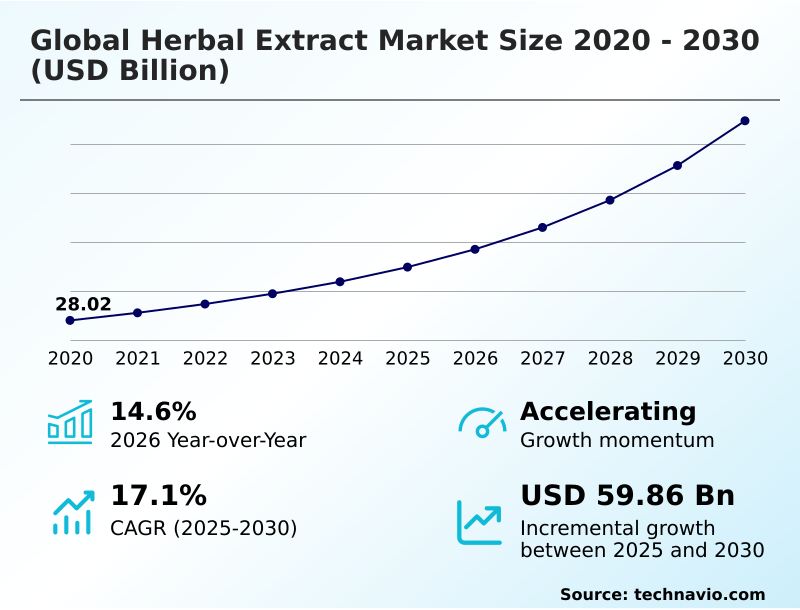
The herbal extract market size is valued to increase by USD 59.86 billion, at a CAGR of 17.1% from 2025 to 2030. Increasing demand for food and beverages with herbal ingredients will drive the herbal extract market.

Major Market Trends & Insights

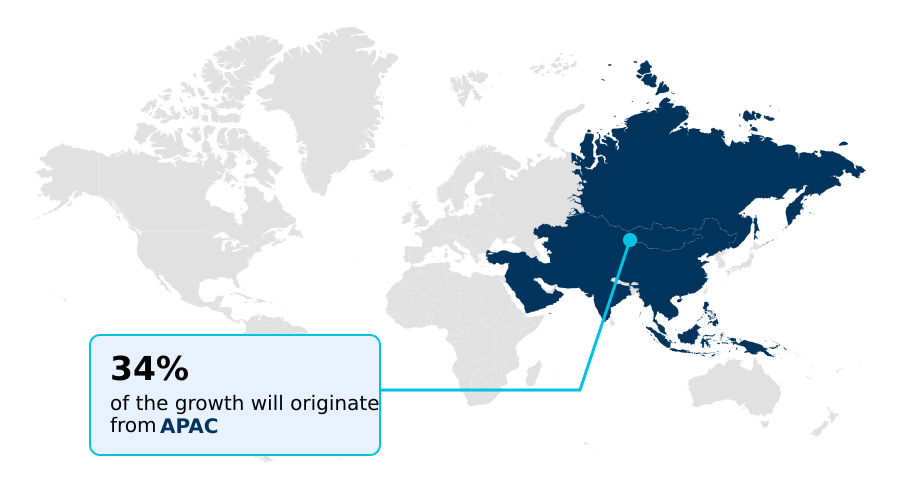
  • APAC dominated the market and accounted for a 34% growth during the forecast period.
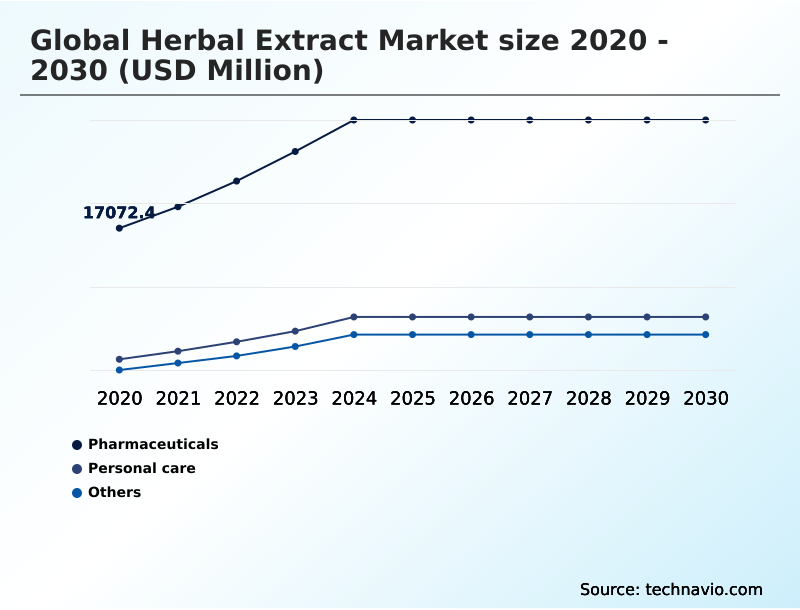
  • By Application - Pharmaceuticals segment was valued at USD 26.27 billion in 2024
  • By Type - Liquid segment accounted for the largest market revenue share in 2024

Market Size & Forecast

  • Market Opportunities: USD 81.66 billion
  • Market Future Opportunities: USD 59.86 billion
  • CAGR from 2025 to 2030 : 17.1%

Market Summary

  • The herbal extract market is undergoing a significant transformation, driven by a global consumer shift toward natural wellness and preventative health. This evolution is moving beyond traditional applications into sophisticated sectors like pharmaceuticals and functional foods, where the demand for clean-label ingredients and scientifically validated plant-based remedies is paramount.
  • Innovations in processing, such as supercritical fluid extraction, are enabling the production of highly pure phytochemicals and bioactive compounds, enhancing product efficacy. This technological progress supports the development of advanced phytopharmaceuticals and standardized extracts.
  • For instance, a food and beverage manufacturer could leverage these advancements to optimize its supply chain for herbal raw material sourcing, ensuring traceability and adherence to good agricultural and collection practices (gacps). This strategy not only meets stringent gmp for herbal medicines but also satisfies consumer demand for transparently sourced botanical ingredients in products like adaptogenic herbs and herbal nutraceuticals.
  • This focus on quality and efficacy, from medicinal plants to finished goods, is crucial for navigating the competitive landscape.

What will be the Size of the Herbal Extract Market during the forecast period?

Get Key Insights on Market Forecast (PDF) Request Free Sample

How is the Herbal Extract Market Segmented?

The herbal extract industry research report provides comprehensive data (region-wise segment analysis), with forecasts and estimates in "USD million" for the period 2026-2030, as well as historical data from 2020-2024 for the following segments.

  • Application
    • Pharmaceuticals
    • Personal care
    • Others
  • Type
    • Liquid
    • Powder
  • Product type
    • Phytomedicines
    • Essential oils
    • Plant extracts and oleoresins
    • Polyphenols
    • Others
  • Geography
    • APAC
      • China
      • India
      • Japan
    • North America
      • US
      • Canada
      • Mexico
    • Europe
      • Germany
      • UK
      • France
    • Middle East and Africa
      • Saudi Arabia
      • UAE
      • Turkey
    • South America
      • Brazil
      • Argentina
    • Rest of World (ROW)

By Application Insights

The pharmaceuticals segment is estimated to witness significant growth during the forecast period.

The pharmaceutical segment is a cornerstone of the herbal extract market, driven by the integration of phytopharmaceuticals into mainstream healthcare. This shift is propelled by a growing preference for plant-based remedies and botanical drugs over synthetic alternatives.

The sector emphasizes the scientific validation of traditional knowledge, with a focus on isolating bioactive compounds from medicinal plants through rigorous clinical trials. Regulatory frameworks are evolving to accommodate this, creating clearer pathways for herbal medicinal products.

In some developed nations, consumer adoption of complementary medicines, a key end-user category, surpasses 70%.

This high acceptance rate underscores the demand for standardized extracts and phytotherapy solutions, compelling companies to invest in R&D and ensure their plant-derived compounds meet stringent quality and efficacy standards, driving innovation in phytomedicine clinical trials.

Request Free Sample

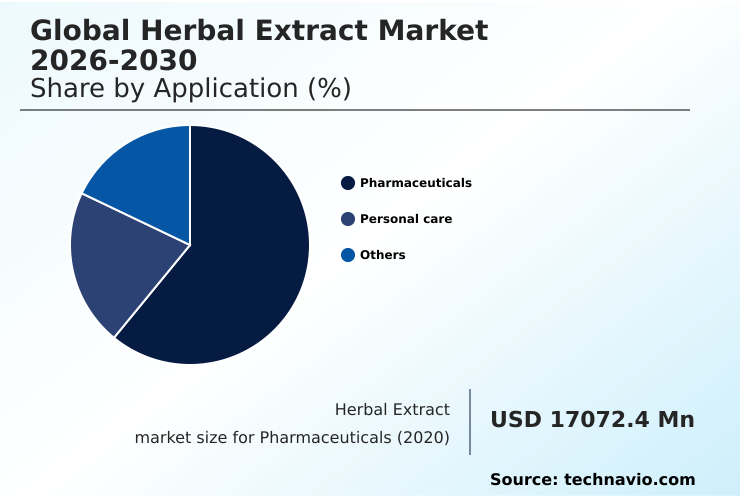
The Pharmaceuticals segment was valued at USD 26.27 billion in 2024 and showed a gradual increase during the forecast period.

Request Free Sample

Regional Analysis

APAC is estimated to contribute 34% to the growth of the global market during the forecast period.Technavio’s analysts have elaborately explained the regional trends and drivers that shape the market during the forecast period.

See How Herbal Extract Market Demand is Rising in APAC Request Free Sample

The APAC region is the dominant force in the herbal extract market, accounting for over 34% of the industry's incremental growth.

This leadership is anchored in the deep-rooted cultural acceptance of traditional chinese medicine (tcm) and ayurveda, particularly in China and India, which drives substantial demand for medicinal plants and plant-derived compounds.

Regional governments are actively supporting the modernization of these practices by funding phytomedicine clinical trials and establishing clearer herbal product regulatory compliance frameworks. The emphasis on ethnobotanical research and natural cosmetic ingredients is also fueling innovation.

This unique combination of rich biodiversity, strong consumer preference for natural health products, and evolving regulatory support solidifies APAC's position as the central hub for herbal raw material sourcing and botanical drug development.

Market Dynamics

Our researchers analyzed the data with 2025 as the base year, along with the key drivers, trends, and challenges. A holistic analysis of drivers will help companies refine their marketing strategies to gain a competitive advantage.

  • Strategic positioning in the herbal extract market requires a deep understanding of the technical nuances driving value, from sourcing to final product formulation. Advancements in herbal extraction techniques, particularly supercritical fluid extraction for turmeric, are unlocking new potential for bioactive compounds, significantly improving the bioavailability of encapsulated curcumin.
  • This necessitates stringent GMP compliance for herbal supplements and a robust strategy for sourcing organic medicinal plants. The market applications of phytomedicines are expanding as companies master the standardization of ashwagandha extract and other botanicals, which is critical for formulating functional foods with botanicals and developing supplements for targeted benefits like ashwagandha for stress reduction.
  • Companies focusing on standardizing extracts have seen a more than two-fold increase in product acceptance in regulated markets. Furthermore, understanding the challenges in herbal raw material supply and the complex regulatory pathways for botanical drugs is essential.
  • The effective use of natural preservatives like rosemary extract and the analysis of polyphenol content in green tea extract demonstrate a commitment to quality. The industry is also seeing a convergence of traditional knowledge and modern science, with ayurvedic principles in product development and the integration of tcm in modern healthcare becoming key differentiators.
  • This extends to analyzing terpenoid profiles in essential oils, alkaloid extraction from medicinal roots, and leveraging flavonoid benefits in skincare and carotenoid stability in food products.

What are the key market drivers leading to the rise in the adoption of Herbal Extract Industry?

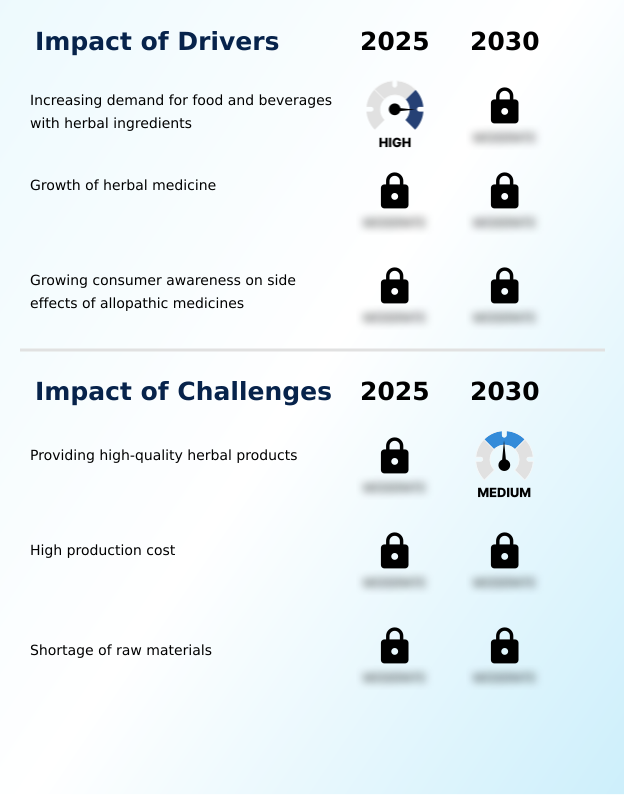
  • The increasing demand for food and beverages that incorporate natural herbal ingredients stands as a key driver for the market's expansion.

  • Market growth is fundamentally driven by a pronounced consumer shift toward natural and functional products, impacting purchasing decisions across multiple sectors.
  • Products featuring clean-label ingredients are experiencing a 20% higher repeat purchase rate, compelling manufacturers to reformulate with plant-based flavor enhancers and natural colorants for food.
  • The functional food sector, by incorporating validated phytopharmaceuticals and botanical antioxidant sources, has expanded its consumer base by 15% in recent years.
  • This trend is amplified by a growing awareness of the benefits of plant-based api manufacturing and ayurvedic medicine formulation, with consumers actively seeking out functional food ingredients and immune support botanicals for preventative health.
  • The demand for effective stress relief herbal remedies is also contributing significantly to market expansion.

What are the market trends shaping the Herbal Extract Industry?

  • Significant advancements in extraction techniques represent a key market trend, as these innovations are enhancing the quality, consistency, and efficacy of herbal extracts.

  • Key market trends are centered on technological innovation and digital transformation, creating new efficiency benchmarks. Advancements in extraction techniques, such as supercritical co2 extraction, are enabling firms to achieve up to a 40% higher yield of bioactive compounds compared to traditional solvent extraction methods. This enhances the quality of herbal supplement formulation and natural cosmetic ingredients.
  • Concurrently, the industry is leveraging digital platforms for direct-to-consumer engagement, with brands utilizing e-commerce channels reporting customer interaction rates increasing by over 50%. This shift facilitates broader access to natural health products and allows for real-time feedback, influencing botanical drug development.
  • The focus on plant extract standardization and distillation of essential oils ensures consistent product quality, meeting heightened consumer expectations for efficacy.

What challenges does the Herbal Extract Industry face during its growth?

  • Ensuring the provision of consistently high-quality herbal products, from raw material sourcing to final formulation, poses a significant challenge to the industry's growth trajectory.

  • Navigating operational and regulatory complexities presents significant challenges to market participants. Supply chain disruptions for essential medicinal plants have resulted in production delays of up to 30% for some manufacturers, highlighting vulnerabilities in herbal raw material sourcing and sustainable botanical harvesting.
  • The financial burden of compliance is also substantial; the cost of implementing gmp for herbal medicines can increase initial production overhead by nearly 25%, creating a high barrier to entry. Ensuring consistent quality requires robust herbal product quality control and adherence to good agricultural and collection practices (gacps).
  • These factors, combined with the technical demands of creating standardized extracts and anti-inflammatory plant extracts, demand significant capital and expertise, constraining scalability for many players.

Exclusive Technavio Analysis on Customer Landscape

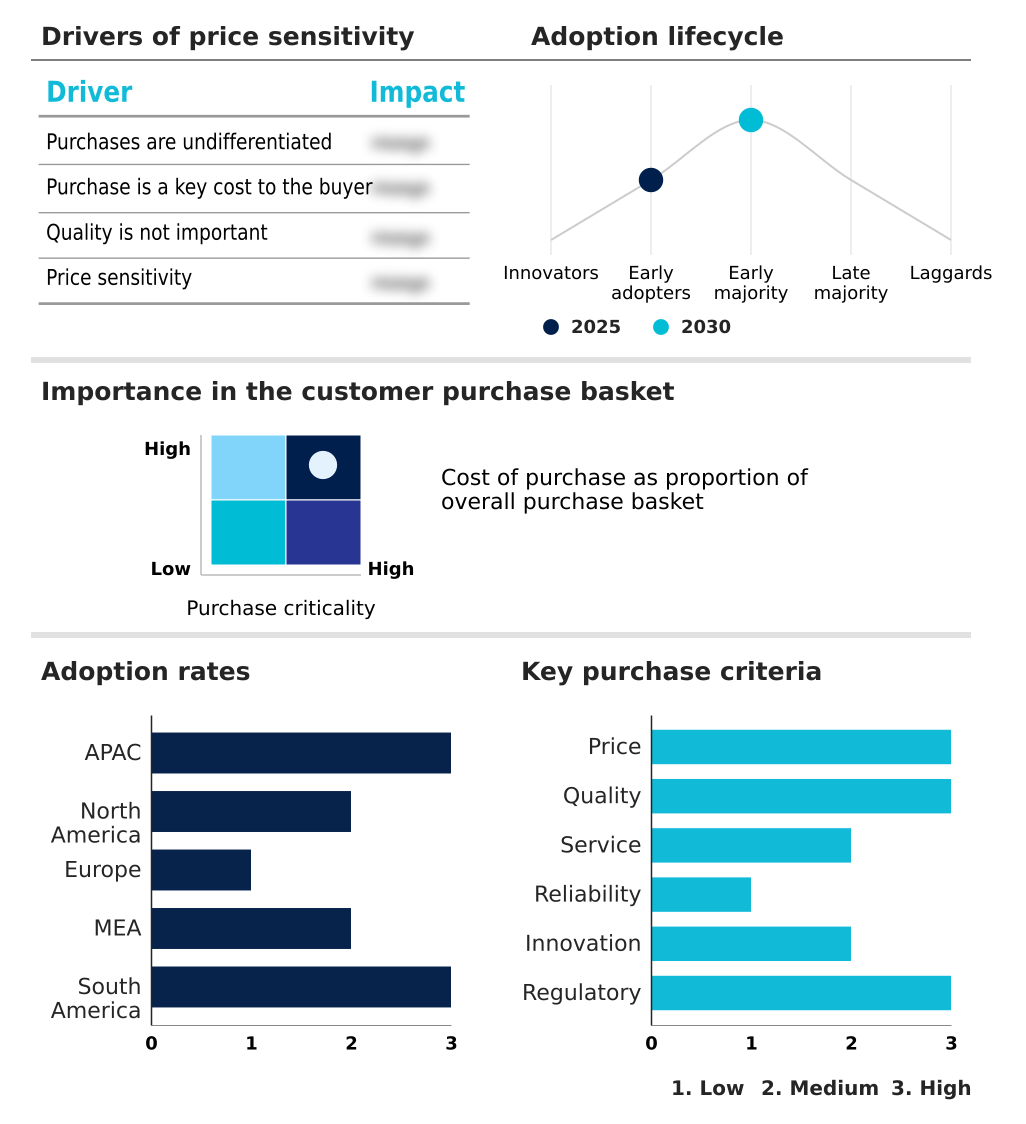
The herbal extract market forecasting report includes the adoption lifecycle of the market, covering from the innovator’s stage to the laggard’s stage. It focuses on adoption rates in different regions based on penetration. Furthermore, the herbal extract market report also includes key purchase criteria and drivers of price sensitivity to help companies evaluate and develop their market growth analysis strategies.

Customer Landscape of Herbal Extract Industry

Competitive Landscape

Companies are implementing various strategies, such as strategic alliances, herbal extract market forecast, partnerships, mergers and acquisitions, geographical expansion, and product/service launches, to enhance their presence in the industry.

Dohler GmbH - Specializes in technology-driven natural ingredient systems, delivering integrated botanical solutions like African extracts for diverse food, beverage, and pharmaceutical applications.

The industry research and growth report includes detailed analyses of the competitive landscape of the market and information about key companies, including:

  • Dohler GmbH
  • Herbal Creations
  • Herbochem
  • India Essential Oils
  • K. Patel Phyto Extractions
  • Kalsec Inc.
  • MB Holding GmbH and Co. KG
  • Mountain Rose Herbs
  • Naturalin Bio Resources
  • Natures Way Brands LLC
  • Octavius Pharma Pvt. Ltd.
  • Organic Herb Inc.
  • Ransom Naturals Ltd.
  • SA Herbal Bioactives LLP
  • Sarv Biolabs Pvt. Ltd.
  • Starwest Botanicals.com Inc.
  • Synergy Flavors Inc.
  • Synthite Industries Pvt. Ltd.
  • Vidya Herbs Pvt. Ltd.

Qualitative and quantitative analysis of companies has been conducted to help clients understand the wider business environment as well as the strengths and weaknesses of key industry players. Data is qualitatively analyzed to categorize companies as pure play, category-focused, industry-focused, and diversified; it is quantitatively analyzed to categorize companies as dominant, leading, strong, tentative, and weak.

Recent Development and News in Herbal extract market

  • In May 2025, Makers Nutrition launched a private-label gummy featuring shilajit and ashwagandha, adapting traditional powdered extracts into a more consumer-friendly format to meet rising demand.
  • In April 2025, Symrise introduced its Mindera platform, a 100% plant-based solution for the natural preservation of cosmetic products, marking a significant advancement in clean-label formulations.
  • In March 2025, Eisai, a major consumer brand in Japan, introduced Chocola BB Nightwell, a drinkable supplement incorporating herbal ingredients designed to support sleep and reduce fatigue.
  • In January 2025, the Korea Ginseng Corp. launched new herbal supplements aimed at managing blood sugar and body fat, following approvals from the Korean Food and Drug Administration.

Dive into Technavio’s robust research methodology, blending expert interviews, extensive data synthesis, and validated models for unparalleled Herbal Extract Market insights. See full methodology.

Market Scope
Page number 293
Base year 2025
Historic period 2020-2024
Forecast period 2026-2030
Growth momentum & CAGR Accelerate at a CAGR of 17.1%
Market growth 2026-2030 USD 59861.9 million
Market structure Fragmented
YoY growth 2025-2026(%) 14.6%
Key countries China, India, Japan, South Korea, Australia, Indonesia, US, Canada, Mexico, Germany, UK, France, Italy, Spain, The Netherlands, Saudi Arabia, UAE, Turkey, South Africa, Israel, Brazil, Argentina and Chile
Competitive landscape Leading Companies, Market Positioning of Companies, Competitive Strategies, and Industry Risks

Request Free Sample

Research Analyst Overview

  • The herbal extract market's evolution is compelling a strategic shift in boardroom-level decision-making, moving from a focus on traditional plant-based remedies to high-value, science-backed applications. The core of this transition lies in the commercialization of phytochemicals and bioactive compounds for phytopharmaceuticals and sophisticated botanical ingredients. Innovations like supercritical fluid extraction are enabling the production of highly potent oleoresins and polyphenols.
  • This technological advancement requires significant investment, and companies that adopt good agricultural and collection practices (gacps) have reported a 25% improvement in raw material traceability, directly impacting compliance and brand reputation. The industry is no longer just about sourcing medicinal plants but about mastering the science of flavonoids, carotenoids, alkaloids, and terpenoids.
  • Integrating ayurveda and traditional chinese medicine (tcm) principles with modern phytotherapy through the use of standardized extracts is now a key differentiator. Developing effective herbal nutraceuticals and botanical drugs necessitates a deep commitment to quality, including adherence to gmp for herbal medicines.

What are the Key Data Covered in this Herbal Extract Market Research and Growth Report?

  • What is the expected growth of the Herbal Extract Market between 2026 and 2030?

    • USD 59.86 billion, at a CAGR of 17.1%

  • What segmentation does the market report cover?

    • The report is segmented by Application (Pharmaceuticals, Personal care, and Others), Type (Liquid, and Powder), Product Type (Phytomedicines, Essential oils, Plant extracts and oleoresins, Polyphenols, and Others) and Geography (APAC, North America, Europe, Middle East and Africa, South America)

  • Which regions are analyzed in the report?

    • APAC, North America, Europe, Middle East and Africa and South America

  • What are the key growth drivers and market challenges?

    • Increasing demand for food and beverages with herbal ingredients, Providing high-quality herbal products

  • Who are the major players in the Herbal Extract Market?

    • Dohler GmbH, Herbal Creations, Herbochem, India Essential Oils, K. Patel Phyto Extractions, Kalsec Inc., MB Holding GmbH and Co. KG, Mountain Rose Herbs, Naturalin Bio Resources, Natures Way Brands LLC, Octavius Pharma Pvt. Ltd., Organic Herb Inc., Ransom Naturals Ltd., SA Herbal Bioactives LLP, Sarv Biolabs Pvt. Ltd., Starwest Botanicals.com Inc., Synergy Flavors Inc., Synthite Industries Pvt. Ltd. and Vidya Herbs Pvt. Ltd.

Market Research Insights

  • Market dynamics are increasingly shaped by the pursuit of efficacy and safety, with a focus on plant extract standardization and advanced extraction methods. Firms adopting supercritical CO2 extraction have reported a 20% reduction in solvent waste, aligning with sustainable botanical harvesting principles.
  • The integration of sophisticated herbal product quality control analytics has concurrently lowered batch rejection rates by over 10%, enhancing operational efficiency in botanical drug development. Furthermore, innovations in the encapsulation of herbal extracts are improving bioavailability, a key factor in formulating effective natural health products and herbal supplement formulations.
  • This emphasis on scientific validation and sustainable practices is redefining the competitive landscape for plant-derived compounds and functional food ingredients.

We can help! Our analysts can customize this herbal extract market research report to meet your requirements.

Get in touch

1. Executive Summary

1.1 Market overview

Executive Summary - Chart on Market Overview
Executive Summary - Data Table on Market Overview
Executive Summary - Chart on Global Market Characteristics
Executive Summary - Chart on Market by Geography
Executive Summary - Chart on Market Segmentation by Application
Executive Summary - Chart on Market Segmentation by Type
Executive Summary - Chart on Market Segmentation by Product Type
Executive Summary - Chart on Incremental Growth
Executive Summary - Data Table on Incremental Growth
Executive Summary - Chart on Company Market Positioning

2. Technavio Analysis

2.1 Analysis of price sensitivity, lifecycle, customer purchase basket, adoption rates, and purchase criteria

2.2 Criticality of inputs and Factors of differentiation

Chart on Overview on criticality of inputs and factors of differentiation

2.3 Factors of disruption

Chart on Overview on factors of disruption

2.4 Impact of drivers and challenges

Chart on Impact of drivers and challenges in 2025 and 2030

3. Market Landscape

3.1 Market ecosystem

Chart on Parent Market
Data Table on - Parent Market

3.2 Market characteristics

Chart on Market characteristics analysis

3.3 Value chain analysis

Chart on Value chain analysis

4. Market Sizing

4.1 Market definition

Data Table on Offerings of companies included in the market definition

4.2 Market segment analysis

Market segments

4.3 Market size 2025

4.4 Market outlook: Forecast for 2025-2030

Chart on Global - Market size and forecast 2025-2030 ($ million)
Data Table on Global - Market size and forecast 2025-2030 ($ million)
Chart on Global Market: Year-over-year growth 2025-2030 (%)
Data Table on Global Market: Year-over-year growth 2025-2030 (%)

5. Historic Market Size

5.1 Global Herbal Extract Market 2020 - 2024

Historic Market Size - Data Table on Global Herbal Extract Market 2020 - 2024 ($ million)

5.2 Application segment analysis 2020 - 2024

Historic Market Size - Application Segment 2020 - 2024 ($ million)

5.3 Type segment analysis 2020 - 2024

Historic Market Size - Type Segment 2020 - 2024 ($ million)

5.4 Product Type segment analysis 2020 - 2024

Historic Market Size - Product Type Segment 2020 - 2024 ($ million)

5.5 Geography segment analysis 2020 - 2024

Historic Market Size - Geography Segment 2020 - 2024 ($ million)

5.6 Country segment analysis 2020 - 2024

Historic Market Size - Country Segment 2020 - 2024 ($ million)

6. Qualitative Analysis

6.1 Impact of AI in global herbal extract market

7. Five Forces Analysis

7.1 Five forces summary

Five forces analysis - Comparison between 2025 and 2030

7.2 Bargaining power of buyers

Bargaining power of buyers - Impact of key factors 2025 and 2030

7.3 Bargaining power of suppliers

Bargaining power of suppliers - Impact of key factors in 2025 and 2030

7.4 Threat of new entrants

Threat of new entrants - Impact of key factors in 2025 and 2030

7.5 Threat of substitutes

Threat of substitutes - Impact of key factors in 2025 and 2030

7.6 Threat of rivalry

Threat of rivalry - Impact of key factors in 2025 and 2030

7.7 Market condition

Chart on Market condition - Five forces 2025 and 2030

8. Market Segmentation by Application

8.1 Market segments

Chart on Application - Market share 2025-2030 (%)
Data Table on Application - Market share 2025-2030 (%)

8.2 Comparison by Application

Chart on Comparison by Application
Data Table on Comparison by Application

8.3 Pharmaceuticals - Market size and forecast 2025-2030

Chart on Pharmaceuticals - Market size and forecast 2025-2030 ($ million)
Data Table on Pharmaceuticals - Market size and forecast 2025-2030 ($ million)
Chart on Pharmaceuticals - Year-over-year growth 2025-2030 (%)
Data Table on Pharmaceuticals - Year-over-year growth 2025-2030 (%)

8.4 Personal care - Market size and forecast 2025-2030

Chart on Personal care - Market size and forecast 2025-2030 ($ million)
Data Table on Personal care - Market size and forecast 2025-2030 ($ million)
Chart on Personal care - Year-over-year growth 2025-2030 (%)
Data Table on Personal care - Year-over-year growth 2025-2030 (%)

8.5 Others - Market size and forecast 2025-2030

Chart on Others - Market size and forecast 2025-2030 ($ million)
Data Table on Others - Market size and forecast 2025-2030 ($ million)
Chart on Others - Year-over-year growth 2025-2030 (%)
Data Table on Others - Year-over-year growth 2025-2030 (%)

8.6 Market opportunity by Application

Market opportunity by Application ($ million)
Data Table on Market opportunity by Application ($ million)

9. Market Segmentation by Type

9.1 Market segments

Chart on Type - Market share 2025-2030 (%)
Data Table on Type - Market share 2025-2030 (%)

9.2 Comparison by Type

Chart on Comparison by Type
Data Table on Comparison by Type

9.3 Liquid - Market size and forecast 2025-2030

Chart on Liquid - Market size and forecast 2025-2030 ($ million)
Data Table on Liquid - Market size and forecast 2025-2030 ($ million)
Chart on Liquid - Year-over-year growth 2025-2030 (%)
Data Table on Liquid - Year-over-year growth 2025-2030 (%)

9.4 Powder - Market size and forecast 2025-2030

Chart on Powder - Market size and forecast 2025-2030 ($ million)
Data Table on Powder - Market size and forecast 2025-2030 ($ million)
Chart on Powder - Year-over-year growth 2025-2030 (%)
Data Table on Powder - Year-over-year growth 2025-2030 (%)

9.5 Market opportunity by Type

Market opportunity by Type ($ million)
Data Table on Market opportunity by Type ($ million)

10. Market Segmentation by Product Type

10.1 Market segments

Chart on Product Type - Market share 2025-2030 (%)
Data Table on Product Type - Market share 2025-2030 (%)

10.2 Comparison by Product Type

Chart on Comparison by Product Type
Data Table on Comparison by Product Type

10.3 Phytomedicines - Market size and forecast 2025-2030

Chart on Phytomedicines - Market size and forecast 2025-2030 ($ million)
Data Table on Phytomedicines - Market size and forecast 2025-2030 ($ million)
Chart on Phytomedicines - Year-over-year growth 2025-2030 (%)
Data Table on Phytomedicines - Year-over-year growth 2025-2030 (%)

10.4 Essential oils - Market size and forecast 2025-2030

Chart on Essential oils - Market size and forecast 2025-2030 ($ million)
Data Table on Essential oils - Market size and forecast 2025-2030 ($ million)
Chart on Essential oils - Year-over-year growth 2025-2030 (%)
Data Table on Essential oils - Year-over-year growth 2025-2030 (%)

10.5 Plant extracts and oleoresins - Market size and forecast 2025-2030

Chart on Plant extracts and oleoresins - Market size and forecast 2025-2030 ($ million)
Data Table on Plant extracts and oleoresins - Market size and forecast 2025-2030 ($ million)
Chart on Plant extracts and oleoresins - Year-over-year growth 2025-2030 (%)
Data Table on Plant extracts and oleoresins - Year-over-year growth 2025-2030 (%)

10.6 Polyphenols - Market size and forecast 2025-2030

Chart on Polyphenols - Market size and forecast 2025-2030 ($ million)
Data Table on Polyphenols - Market size and forecast 2025-2030 ($ million)
Chart on Polyphenols - Year-over-year growth 2025-2030 (%)
Data Table on Polyphenols - Year-over-year growth 2025-2030 (%)

10.7 Others - Market size and forecast 2025-2030

Chart on Others - Market size and forecast 2025-2030 ($ million)
Data Table on Others - Market size and forecast 2025-2030 ($ million)
Chart on Others - Year-over-year growth 2025-2030 (%)
Data Table on Others - Year-over-year growth 2025-2030 (%)

10.8 Market opportunity by Product Type

Market opportunity by Product Type ($ million)
Data Table on Market opportunity by Product Type ($ million)

11. Customer Landscape

11.1 Customer landscape overview

Analysis of price sensitivity, lifecycle, customer purchase basket, adoption rates, and purchase criteria

12. Geographic Landscape

12.1 Geographic segmentation

Chart on Market share by geography 2025-2030 (%)
Data Table on Market share by geography 2025-2030 (%)

12.2 Geographic comparison

Chart on Geographic comparison
Data Table on Geographic comparison

12.3 APAC - Market size and forecast 2025-2030

Chart on APAC - Market size and forecast 2025-2030 ($ million)
Data Table on APAC - Market size and forecast 2025-2030 ($ million)
Chart on APAC - Year-over-year growth 2025-2030 (%)
Data Table on APAC - Year-over-year growth 2025-2030 (%)
Chart on Regional Comparison - APAC
Data Table on Regional Comparison - APAC

12.3.1 China - Market size and forecast 2025-2030

Chart on China - Market size and forecast 2025-2030 ($ million)
Data Table on China - Market size and forecast 2025-2030 ($ million)
Chart on China - Year-over-year growth 2025-2030 (%)
Data Table on China - Year-over-year growth 2025-2030 (%)

12.3.2 India - Market size and forecast 2025-2030

Chart on India - Market size and forecast 2025-2030 ($ million)
Data Table on India - Market size and forecast 2025-2030 ($ million)
Chart on India - Year-over-year growth 2025-2030 (%)
Data Table on India - Year-over-year growth 2025-2030 (%)

12.3.3 Japan - Market size and forecast 2025-2030

Chart on Japan - Market size and forecast 2025-2030 ($ million)
Data Table on Japan - Market size and forecast 2025-2030 ($ million)
Chart on Japan - Year-over-year growth 2025-2030 (%)
Data Table on Japan - Year-over-year growth 2025-2030 (%)

12.3.4 South Korea - Market size and forecast 2025-2030

Chart on South Korea - Market size and forecast 2025-2030 ($ million)
Data Table on South Korea - Market size and forecast 2025-2030 ($ million)
Chart on South Korea - Year-over-year growth 2025-2030 (%)
Data Table on South Korea - Year-over-year growth 2025-2030 (%)

12.3.5 Australia - Market size and forecast 2025-2030

Chart on Australia - Market size and forecast 2025-2030 ($ million)
Data Table on Australia - Market size and forecast 2025-2030 ($ million)
Chart on Australia - Year-over-year growth 2025-2030 (%)
Data Table on Australia - Year-over-year growth 2025-2030 (%)

12.3.6 Indonesia - Market size and forecast 2025-2030

Chart on Indonesia - Market size and forecast 2025-2030 ($ million)
Data Table on Indonesia - Market size and forecast 2025-2030 ($ million)
Chart on Indonesia - Year-over-year growth 2025-2030 (%)
Data Table on Indonesia - Year-over-year growth 2025-2030 (%)

12.4 North America - Market size and forecast 2025-2030

Chart on North America - Market size and forecast 2025-2030 ($ million)
Data Table on North America - Market size and forecast 2025-2030 ($ million)
Chart on North America - Year-over-year growth 2025-2030 (%)
Data Table on North America - Year-over-year growth 2025-2030 (%)
Chart on Regional Comparison - North America
Data Table on Regional Comparison - North America

12.4.1 US - Market size and forecast 2025-2030

Chart on US - Market size and forecast 2025-2030 ($ million)
Data Table on US - Market size and forecast 2025-2030 ($ million)
Chart on US - Year-over-year growth 2025-2030 (%)
Data Table on US - Year-over-year growth 2025-2030 (%)

12.4.2 Canada - Market size and forecast 2025-2030

Chart on Canada - Market size and forecast 2025-2030 ($ million)
Data Table on Canada - Market size and forecast 2025-2030 ($ million)
Chart on Canada - Year-over-year growth 2025-2030 (%)
Data Table on Canada - Year-over-year growth 2025-2030 (%)

12.4.3 Mexico - Market size and forecast 2025-2030

Chart on Mexico - Market size and forecast 2025-2030 ($ million)
Data Table on Mexico - Market size and forecast 2025-2030 ($ million)
Chart on Mexico - Year-over-year growth 2025-2030 (%)
Data Table on Mexico - Year-over-year growth 2025-2030 (%)

12.5 Europe - Market size and forecast 2025-2030

Chart on Europe - Market size and forecast 2025-2030 ($ million)
Data Table on Europe - Market size and forecast 2025-2030 ($ million)
Chart on Europe - Year-over-year growth 2025-2030 (%)
Data Table on Europe - Year-over-year growth 2025-2030 (%)
Chart on Regional Comparison - Europe
Data Table on Regional Comparison - Europe

12.5.1 Germany - Market size and forecast 2025-2030

Chart on Germany - Market size and forecast 2025-2030 ($ million)
Data Table on Germany - Market size and forecast 2025-2030 ($ million)
Chart on Germany - Year-over-year growth 2025-2030 (%)
Data Table on Germany - Year-over-year growth 2025-2030 (%)

12.5.2 UK - Market size and forecast 2025-2030

Chart on UK - Market size and forecast 2025-2030 ($ million)
Data Table on UK - Market size and forecast 2025-2030 ($ million)
Chart on UK - Year-over-year growth 2025-2030 (%)
Data Table on UK - Year-over-year growth 2025-2030 (%)

12.5.3 France - Market size and forecast 2025-2030

Chart on France - Market size and forecast 2025-2030 ($ million)
Data Table on France - Market size and forecast 2025-2030 ($ million)
Chart on France - Year-over-year growth 2025-2030 (%)
Data Table on France - Year-over-year growth 2025-2030 (%)

12.5.4 Italy - Market size and forecast 2025-2030

Chart on Italy - Market size and forecast 2025-2030 ($ million)
Data Table on Italy - Market size and forecast 2025-2030 ($ million)
Chart on Italy - Year-over-year growth 2025-2030 (%)
Data Table on Italy - Year-over-year growth 2025-2030 (%)

12.5.5 Spain - Market size and forecast 2025-2030

Chart on Spain - Market size and forecast 2025-2030 ($ million)
Data Table on Spain - Market size and forecast 2025-2030 ($ million)
Chart on Spain - Year-over-year growth 2025-2030 (%)
Data Table on Spain - Year-over-year growth 2025-2030 (%)

12.5.6 The Netherlands - Market size and forecast 2025-2030

Chart on The Netherlands - Market size and forecast 2025-2030 ($ million)
Data Table on The Netherlands - Market size and forecast 2025-2030 ($ million)
Chart on The Netherlands - Year-over-year growth 2025-2030 (%)
Data Table on The Netherlands - Year-over-year growth 2025-2030 (%)

12.6 Middle East and Africa - Market size and forecast 2025-2030

Chart on Middle East and Africa - Market size and forecast 2025-2030 ($ million)
Data Table on Middle East and Africa - Market size and forecast 2025-2030 ($ million)
Chart on Middle East and Africa - Year-over-year growth 2025-2030 (%)
Data Table on Middle East and Africa - Year-over-year growth 2025-2030 (%)
Chart on Regional Comparison - Middle East and Africa
Data Table on Regional Comparison - Middle East and Africa

12.6.1 Saudi Arabia - Market size and forecast 2025-2030

Chart on Saudi Arabia - Market size and forecast 2025-2030 ($ million)
Data Table on Saudi Arabia - Market size and forecast 2025-2030 ($ million)
Chart on Saudi Arabia - Year-over-year growth 2025-2030 (%)
Data Table on Saudi Arabia - Year-over-year growth 2025-2030 (%)

12.6.2 UAE - Market size and forecast 2025-2030

Chart on UAE - Market size and forecast 2025-2030 ($ million)
Data Table on UAE - Market size and forecast 2025-2030 ($ million)
Chart on UAE - Year-over-year growth 2025-2030 (%)
Data Table on UAE - Year-over-year growth 2025-2030 (%)

12.6.3 Turkey - Market size and forecast 2025-2030

Chart on Turkey - Market size and forecast 2025-2030 ($ million)
Data Table on Turkey - Market size and forecast 2025-2030 ($ million)
Chart on Turkey - Year-over-year growth 2025-2030 (%)
Data Table on Turkey - Year-over-year growth 2025-2030 (%)

12.6.4 South Africa - Market size and forecast 2025-2030

Chart on South Africa - Market size and forecast 2025-2030 ($ million)
Data Table on South Africa - Market size and forecast 2025-2030 ($ million)
Chart on South Africa - Year-over-year growth 2025-2030 (%)
Data Table on South Africa - Year-over-year growth 2025-2030 (%)

12.6.5 Israel - Market size and forecast 2025-2030

Chart on Israel - Market size and forecast 2025-2030 ($ million)
Data Table on Israel - Market size and forecast 2025-2030 ($ million)
Chart on Israel - Year-over-year growth 2025-2030 (%)
Data Table on Israel - Year-over-year growth 2025-2030 (%)

12.7 South America - Market size and forecast 2025-2030

Chart on South America - Market size and forecast 2025-2030 ($ million)
Data Table on South America - Market size and forecast 2025-2030 ($ million)
Chart on South America - Year-over-year growth 2025-2030 (%)
Data Table on South America - Year-over-year growth 2025-2030 (%)
Chart on Regional Comparison - South America
Data Table on Regional Comparison - South America

12.7.1 Brazil - Market size and forecast 2025-2030

Chart on Brazil - Market size and forecast 2025-2030 ($ million)
Data Table on Brazil - Market size and forecast 2025-2030 ($ million)
Chart on Brazil - Year-over-year growth 2025-2030 (%)
Data Table on Brazil - Year-over-year growth 2025-2030 (%)

12.7.2 Argentina - Market size and forecast 2025-2030

Chart on Argentina - Market size and forecast 2025-2030 ($ million)
Data Table on Argentina - Market size and forecast 2025-2030 ($ million)
Chart on Argentina - Year-over-year growth 2025-2030 (%)
Data Table on Argentina - Year-over-year growth 2025-2030 (%)

12.7.3 Chile - Market size and forecast 2025-2030

Chart on Chile - Market size and forecast 2025-2030 ($ million)
Data Table on Chile - Market size and forecast 2025-2030 ($ million)
Chart on Chile - Year-over-year growth 2025-2030 (%)
Data Table on Chile - Year-over-year growth 2025-2030 (%)

12.8 Market opportunity by geography

Market opportunity by geography ($ million)
Data Tables on Market opportunity by geography ($ million)

13. Drivers, Challenges, and Opportunity

13.1 Market drivers

Increasing demand for food and beverages with herbal ingredients
Growth of herbal medicine
Growing consumer awareness on side effects of allopathic medicines

13.2 Market challenges

Providing high-quality herbal products
High production cost
Shortage of raw materials

13.3 Impact of drivers and challenges

Impact of drivers and challenges in 2025 and 2030

13.4 Market opportunities

Advancements in extraction techniques
Availability of plant-based alternatives in food and beverages
Manufacturers leveraging digital platforms and e-commerce channels

14. Competitive Landscape

14.1 Overview

14.2

Overview on criticality of inputs and factors of differentiation

14.3 Landscape disruption

Overview on factors of disruption

14.4 Industry risks

Impact of key risks on business

15. Competitive Analysis

15.1 Companies profiled

Companies covered

15.2 Company ranking index

15.3 Market positioning of companies

Matrix on companies position and classification

15.4 Dohler GmbH

Dohler GmbH - Overview
Dohler GmbH - Product / Service
Dohler GmbH - Key offerings
SWOT

15.5 Herbal Creations

Herbal Creations - Overview
Herbal Creations - Product / Service
Herbal Creations - Key offerings
SWOT

15.6 Herbochem

Herbochem - Overview
Herbochem - Product / Service
Herbochem - Key offerings
SWOT

15.7 K. Patel Phyto Extractions

K. Patel Phyto Extractions - Overview
K. Patel Phyto Extractions - Product / Service
K. Patel Phyto Extractions - Key offerings
SWOT

15.8 Kalsec Inc.

Kalsec Inc. - Overview
Kalsec Inc. - Product / Service
Kalsec Inc. - Key offerings
SWOT

15.9 MB Holding GmbH and Co. KG

MB Holding GmbH and Co. KG - Overview
MB Holding GmbH and Co. KG - Product / Service
MB Holding GmbH and Co. KG - Key offerings
SWOT

15.10 Mountain Rose Herbs

Mountain Rose Herbs - Overview
Mountain Rose Herbs - Product / Service
Mountain Rose Herbs - Key offerings
SWOT

15.11 Naturalin Bio Resources

Naturalin Bio Resources - Overview
Naturalin Bio Resources - Product / Service
Naturalin Bio Resources - Key offerings
SWOT

15.12 Octavius Pharma Pvt. Ltd.

Octavius Pharma Pvt. Ltd. - Overview
Octavius Pharma Pvt. Ltd. - Product / Service
Octavius Pharma Pvt. Ltd. - Key offerings
SWOT

15.13 Organic Herb Inc.

Organic Herb Inc. - Overview
Organic Herb Inc. - Product / Service
Organic Herb Inc. - Key offerings
SWOT

15.14 SA Herbal Bioactives LLP

SA Herbal Bioactives LLP - Overview
SA Herbal Bioactives LLP - Product / Service
SA Herbal Bioactives LLP - Key offerings
SWOT

15.15 Sarv Biolabs Pvt. Ltd.

Sarv Biolabs Pvt. Ltd. - Overview
Sarv Biolabs Pvt. Ltd. - Product / Service
Sarv Biolabs Pvt. Ltd. - Key offerings
SWOT

15.16 Starwest Botanicals.com Inc.

Starwest Botanicals.com Inc. - Overview
Starwest Botanicals.com Inc. - Product / Service
Starwest Botanicals.com Inc. - Key offerings
SWOT

15.17 Synthite Industries Pvt. Ltd.

Synthite Industries Pvt. Ltd. - Overview
Synthite Industries Pvt. Ltd. - Product / Service
Synthite Industries Pvt. Ltd. - Key offerings
SWOT

15.18 Vidya Herbs Pvt. Ltd.

Vidya Herbs Pvt. Ltd. - Overview
Vidya Herbs Pvt. Ltd. - Product / Service
Vidya Herbs Pvt. Ltd. - Key offerings
SWOT

16. Appendix

16.1 Scope of the report

Market definition
Objectives
Notes and caveats

16.2 Inclusions and exclusions checklist

Inclusions checklist
Exclusions checklist

16.3 Currency conversion rates for US$

16.4 Research methodology

16.5 Data procurement

Information sources

16.6 Data validation

16.7 Validation techniques employed for market sizing

16.8 Data synthesis

16.9 360 degree market analysis

16.10 List of abbreviations

Research Methodology

Technavio presents a detailed picture of the market by way of study, synthesis, and summation of data from multiple sources. The analysts have presented the various facets of the market with a particular focus on identifying the key industry influencers. The data thus presented is comprehensive, reliable, and the result of extensive research, both primary and secondary.

INFORMATION SOURCES

Primary sources

  • Manufacturers and suppliers
  • Channel partners
  • Industry experts
  • Strategic decision makers

Secondary sources

  • Industry journals and periodicals
  • Government data
  • Financial reports of key industry players
  • Historical data
  • Press releases

DATA ANALYSIS

Data Synthesis

  • Collation of data
  • Estimation of key figures
  • Analysis of derived insights

Data Validation

  • Triangulation with data models
  • Reference against proprietary databases
  • Corroboration with industry experts

REPORT WRITING

Qualitative

  • Market drivers
  • Market challenges
  • Market trends
  • Five forces analysis

Quantitative

  • Market size and forecast
  • Market segmentation
  • Geographical insights
  • Competitive landscape

Interested in this report?

Get your sample now to see our research methodology and insights!

Download Now

Frequently Asked Questions

Herbal Extract market growth will increase by USD 59861.9 million during 2026-2030 .

The Herbal Extract market is expected to grow at a CAGR of 17.1% during 2026-2030 .

Herbal Extract market is segmented by Application (Pharmaceuticals, Personal care, Others) Type (Liquid, Powder) Product type (Phytomedicines, Essential oils, Plant extracts and oleoresins, Polyphenols, Others)

Dohler GmbH, Herbal Creations, Herbochem, India Essential Oils, K. Patel Phyto Extractions, Kalsec Inc., MB Holding GmbH and Co. KG, Mountain Rose Herbs, Naturalin Bio Resources, Natures Way Brands LLC, Octavius Pharma Pvt. Ltd., Organic Herb Inc., Ransom Naturals Ltd., SA Herbal Bioactives LLP, Sarv Biolabs Pvt. Ltd., Starwest Botanicals.com Inc., Synergy Flavors Inc., Synthite Industries Pvt. Ltd., Vidya Herbs Pvt. Ltd. are a few of the key vendors in the Herbal Extract market.

APAC will register the highest growth rate of 34% among the other regions. Therefore, the Herbal Extract market in APAC is expected to garner significant business opportunities for the vendors during the forecast period.

China, India, Japan, South Korea, Australia, Indonesia, US, Canada, Mexico, Germany, UK, France, Italy, Spain, The Netherlands, Saudi Arabia, UAE, Turkey, South Africa, Israel, Brazil, Argentina, Chile

  • Increasing demand for food and beverages with herbal ingredients is the driving factor this market.

The Herbal Extract market vendors should focus on grabbing business opportunities from the Application segment as it accounted for the largest market share in the base year.