High Protein-based Food Market Analysis, Size, and Forecast 2026-2030: North America (US, Canada, and Mexico), Europe (UK, Germany, and France), APAC (China, India, and Japan), South America (Brazil and Argentina), Middle East and Africa (South Africa, UAE, and Saudi Arabia), and Rest of World (ROW)

High Protein-based Food Market Analysis, Size, and Forecast 2026-2030:
North America (US, Canada, and Mexico), Europe (UK, Germany, and France), APAC (China, India, and Japan), South America (Brazil and Argentina), Middle East and Africa (South Africa, UAE, and Saudi Arabia), and Rest of World (ROW)

Published: Apr 2026 307 Pages SKU: IRTNTR45109

Market Overview at a Glance

$57.12 B
Market Opportunity
8.5%
CAGR 2025 - 2030
38.3%
North America Growth
$39.85 B
Protein-rich drinks segment 2024

High Protein-based Food Market Size 2026-2030

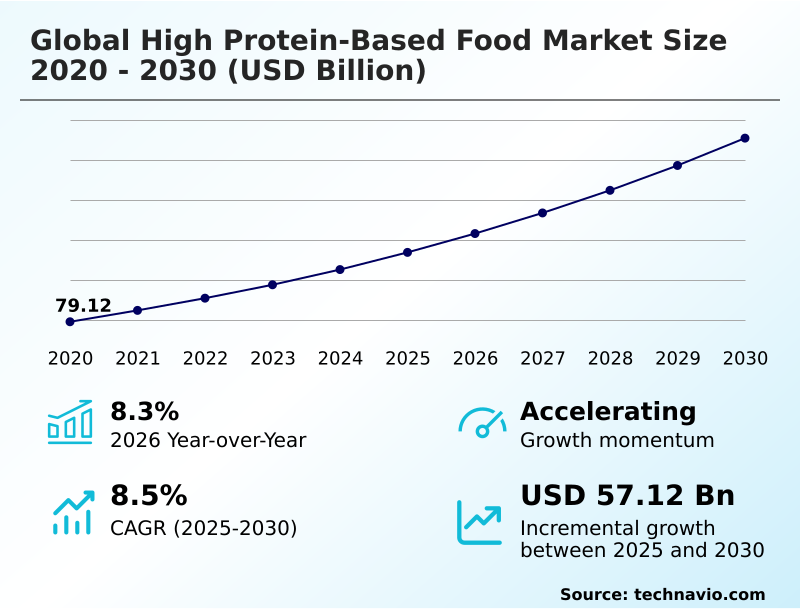
The high protein-based food market size is valued to increase by USD 57.12 billion, at a CAGR of 8.5% from 2025 to 2030. Rising demand for metabolic health and body composition optimization will drive the high protein-based food market.

Major Market Trends & Insights

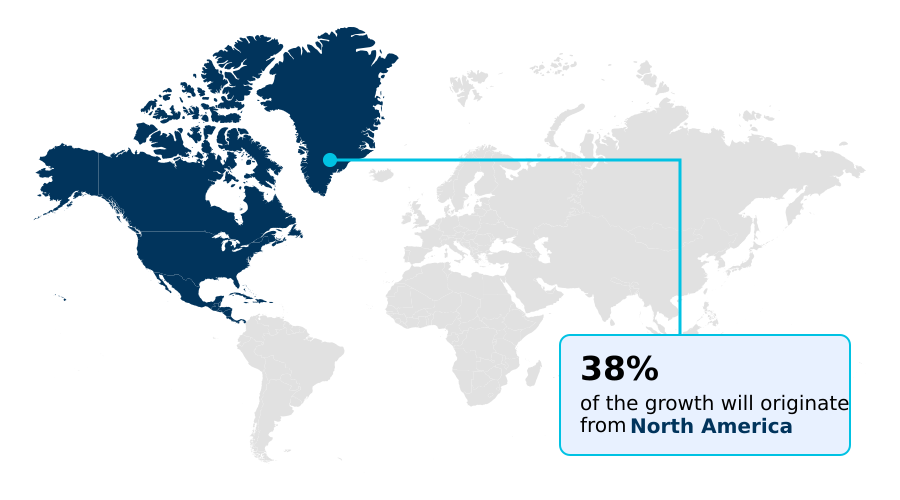
  • North America dominated the market and accounted for a 38.3% growth during the forecast period.
  • By Product - Protein-rich drinks segment was valued at USD 39.85 billion in 2024
  • By Distribution Channel - Offline channel segment accounted for the largest market revenue share in 2024

Market Size & Forecast

  • Market Opportunities: USD 91.81 billion
  • Market Future Opportunities: USD 57.12 billion
  • CAGR from 2025 to 2030 : 8.5%

Market Summary

  • The High Protein-Based Food Market is undergoing a significant transformation, driven by a global shift towards functional nutrition and proactive health management. Consumers now prioritize dietary protein for its role in muscle maintenance, metabolic regulation, and achieving satiety, moving beyond its traditional association with athletic performance.
  • This has spurred innovation across the industry, with a focus on developing a diverse range of products.
  • One key business scenario involves the reformulation of mass-market snacks; a food conglomerate, for instance, might re-engineer a popular biscuit line to include a fortified food matrix with a plant-based protein blend, aiming to improve its nutritional profile without altering the taste consumers expect. This requires overcoming technical hurdles in high-protein extrusion and implementing effective flavor masking technology.
  • The market is also characterized by the growing demand for clean-label protein source options and sustainable protein production methods, compelling companies to innovate in areas like precision fermentation protein and mycoprotein texturization to meet evolving consumer and regulatory expectations.

What will be the Size of the High Protein-based Food Market during the forecast period?

Get Key Insights on Market Forecast (PDF) Request Free Sample

How is the High Protein-based Food Market Segmented?

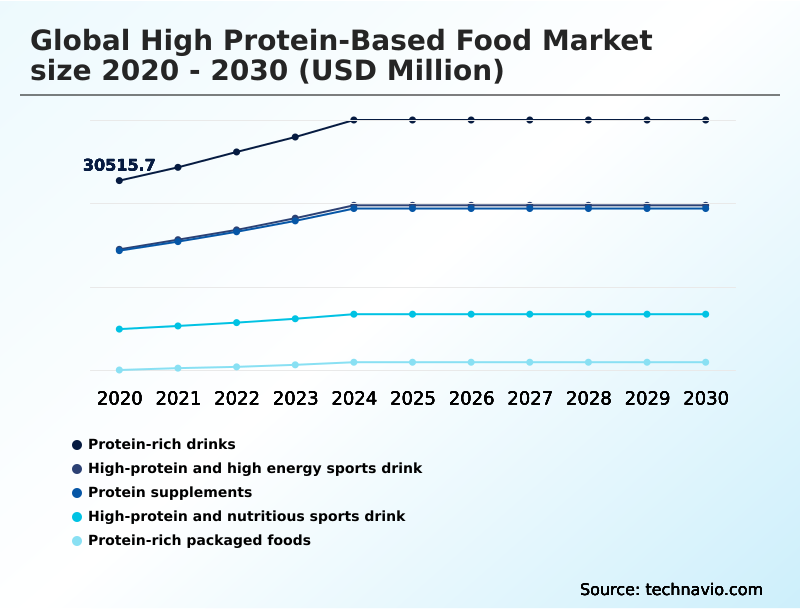
The high protein-based food industry research report provides comprehensive data (region-wise segment analysis), with forecasts and estimates in "USD million" for the period 2026-2030, as well as historical data from 2020-2024 for the following segments.

  • Product
    • Protein-rich drinks
    • High-protein and high energy sports drink
    • Protein supplements
    • High-protein and nutritious sports drink
    • Protein-rich packaged foods
  • Distribution channel
    • Offline channel
    • Online channel
  • Source
    • Animal-based
    • Plant-based
  • Geography
    • North America
      • US
      • Canada
      • Mexico
    • Europe
      • UK
      • Germany
      • France
    • APAC
      • China
      • India
      • Japan
    • South America
      • Brazil
      • Argentina
    • Middle East and Africa
      • South Africa
      • UAE
      • Saudi Arabia
    • Rest of World (ROW)

By Product Insights

The protein-rich drinks segment is estimated to witness significant growth during the forecast period.

The protein-rich drinks segment is rapidly evolving beyond niche applications, targeting mainstream consumers with ready-to-consume formats that emphasize convenience.

A key focus is improving the sensory experience, with significant R&D dedicated to advanced flavor masking technology and texture modification agent use to create a smoother mouthfeel in shelf-stable protein beverage options.

Formulations are increasingly clean-label, featuring non-GMO protein isolate and other premium ingredients. These products, often positioned as a high-protein meal replacement or a functional protein beverage, cater to busy lifestyles.

Innovations in enzymatic protein modification have improved digestibility in some offerings by over 15%, enhancing amino acid bioavailability. The goal is to provide a nutritionally dense, convenient boost without compromising on taste, appealing to a broad consumer base.

Request Free Sample

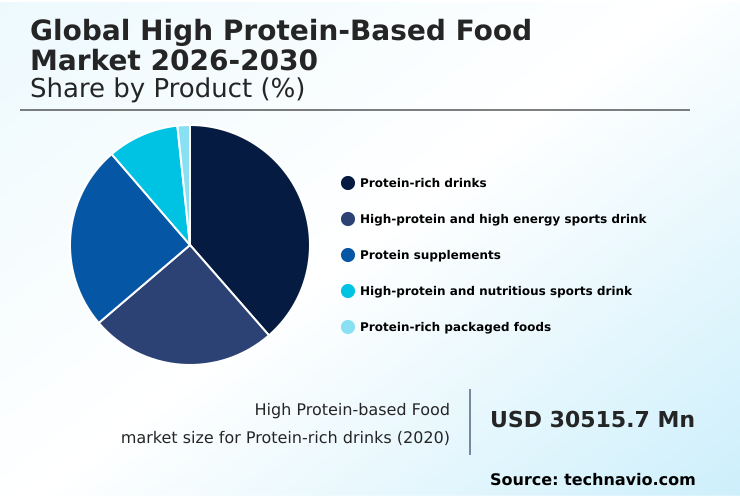
The Protein-rich drinks segment was valued at USD 39.85 billion in 2024 and showed a gradual increase during the forecast period.

Request Free Sample

Regional Analysis

North America is estimated to contribute 38.3% to the growth of the global market during the forecast period.Technavio’s analysts have elaborately explained the regional trends and drivers that shape the market during the forecast period.

See How High Protein-based Food Market Demand is Rising in North America Request Free Sample

The geographic landscape is marked by rapid growth in APAC, which is projected to contribute nearly 27% of the global market's incremental growth, driven by rising health awareness in countries like China and India.

Formulations using a clean-label protein source and sustainable protein production methods are gaining traction globally.

In North America, which accounts for over 38% of market share, the demand for grass-fed dairy protein and products supporting a keto-friendly protein snack trend is robust.

European markets show a strong preference for non-GMO protein isolate and products with transparent sourcing, with some manufacturers achieving a 10% reduction in supply chain waste through localized plant protein extraction.

The focus on nutritional density optimization is a universal driver, influencing product development worldwide.

Market Dynamics

Our researchers analyzed the data with 2025 as the base year, along with the key drivers, trends, and challenges. A holistic analysis of drivers will help companies refine their marketing strategies to gain a competitive advantage.

  • The High Protein-Based Food Market is increasingly shaped by specific consumer inquiries and sophisticated nutritional goals. The debate over whey vs casein for muscle growth continues to drive segmentation in sports nutrition, while concerns about pea protein vs soy protein taste influence plant-based product development.
  • Consumers seeking the best protein powder for weight loss are a significant driver for innovation in satiety-inducing formulations. The market is also expanding to address specific health needs, creating demand for high-protein snacks for diabetics and clarifying how to increase protein intake without meat.
  • Functional benefits are also a key focus, with strong interest in the benefits of collagen for joint health and the role of protein in sarcopenia prevention. The demand for transparency is pushing manufacturers to focus on clean label protein bar ingredients and offer more lactose-free protein shake options.
  • Sustainability is another critical factor, with a growing emphasis on sustainable plant-based protein sources. In response, food scientists are exploring advances in precision fermentation for protein, which promises higher efficiency than traditional methods. As demographic needs shift, understanding protein requirements for elderly adults and developing high-protein breakfast ideas for kids have become important R&D areas.
  • Formulators also face technical hurdles, such as the challenges of formulating high-protein beverages and making protein shakes taste better. The diversification is evident as protein fortification in baked goods becomes more common, requiring a deep understanding of consumer trends in protein consumption.
  • Furthermore, navigating the regulatory landscape for novel proteins is critical for market entry, where companies with streamlined compliance processes are showing a 20% faster time-to-market compared to competitors.

What are the key market drivers leading to the rise in the adoption of High Protein-based Food Industry?

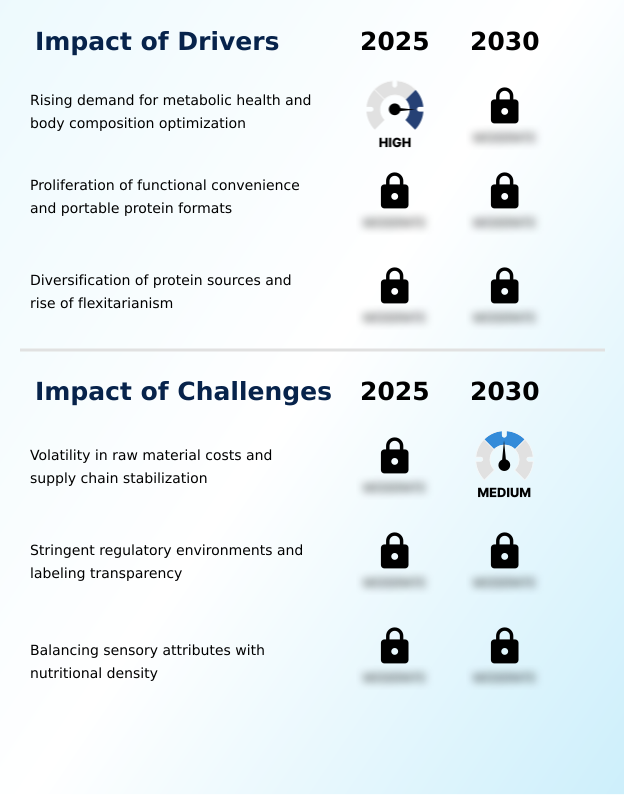
  • The rising consumer demand for solutions promoting metabolic health and optimizing body composition serves as a key driver for the market.

  • A fundamental driver is the growing consumer understanding of macronutrients, spurring demand for satiety-inducing formulation and products that support a high muscle protein synthesis rate.
  • This scientific literacy has expanded the market beyond athletes to include those focused on weight management and healthy aging, leading to a 35% growth in the geriatric nutrition food segment.
  • The diversification of protein sources, from traditional grass-fed dairy protein to innovative precision fermentation protein, allows manufacturers to cater to varied dietary preferences.
  • The demand for convenience is met with products like the shelf-stable protein beverage, with data showing that portable formats can increase consumption frequency by up to 50%. This drive for accessibility and functional benefits is a cornerstone of market expansion.

What are the market trends shaping the High Protein-based Food Industry?

  • A prominent market trend is the integration of high-protein formulations into nostalgic and traditional breakfast staples. This bridges the gap between indulgent taste and functional nutrition for health-conscious consumers.

  • A transformative trend is the adoption of next-generation sustainable ingredients, including algae-based protein source and insect protein bar options, which are gaining consumer acceptance. This shift is driven by a desire for environmentally friendly nutrition and is supported by advancements in cellular agriculture protein.
  • The mainstreaming of these novel sources is evident as some retail chains report that products featuring a fermented protein ingredient have seen a 25% increase in repeat purchases. The market is also seeing a surge in specialized products like protein-enriched pasta and high-protein baking flour, which allow for seamless nutritional enhancement of everyday meals.
  • This integration strategy improves consumer adoption by over 40% compared to products requiring new habits. The expansion of dairy-free protein drink and low-carb protein food categories further diversifies the market.

What challenges does the High Protein-based Food Industry face during its growth?

  • Volatility in the cost of raw materials and the need for supply chain stabilization present a key challenge affecting industry growth.

  • A primary challenge is balancing nutritional goals with sensory appeal, particularly in products with high concentrations of whey protein isolate or certain plant-based protein blend options. Formulators invest heavily in flavor masking technology, which can increase production costs by up to 15%.
  • Another hurdle is navigating the complex supply chain for specialized ingredients like hydrolyzed collagen peptides and casein micellar structure components, where disruptions have led to lead time increases of 20%. Ensuring high amino acid bioavailability while maintaining a clean-label protein source presents a continuous technical challenge.
  • The development of a viable plant-based meat alternative with the right texture and taste remains a high-stakes R&D focus for many companies, requiring mastery of high-protein extrusion and mycoprotein texturization.

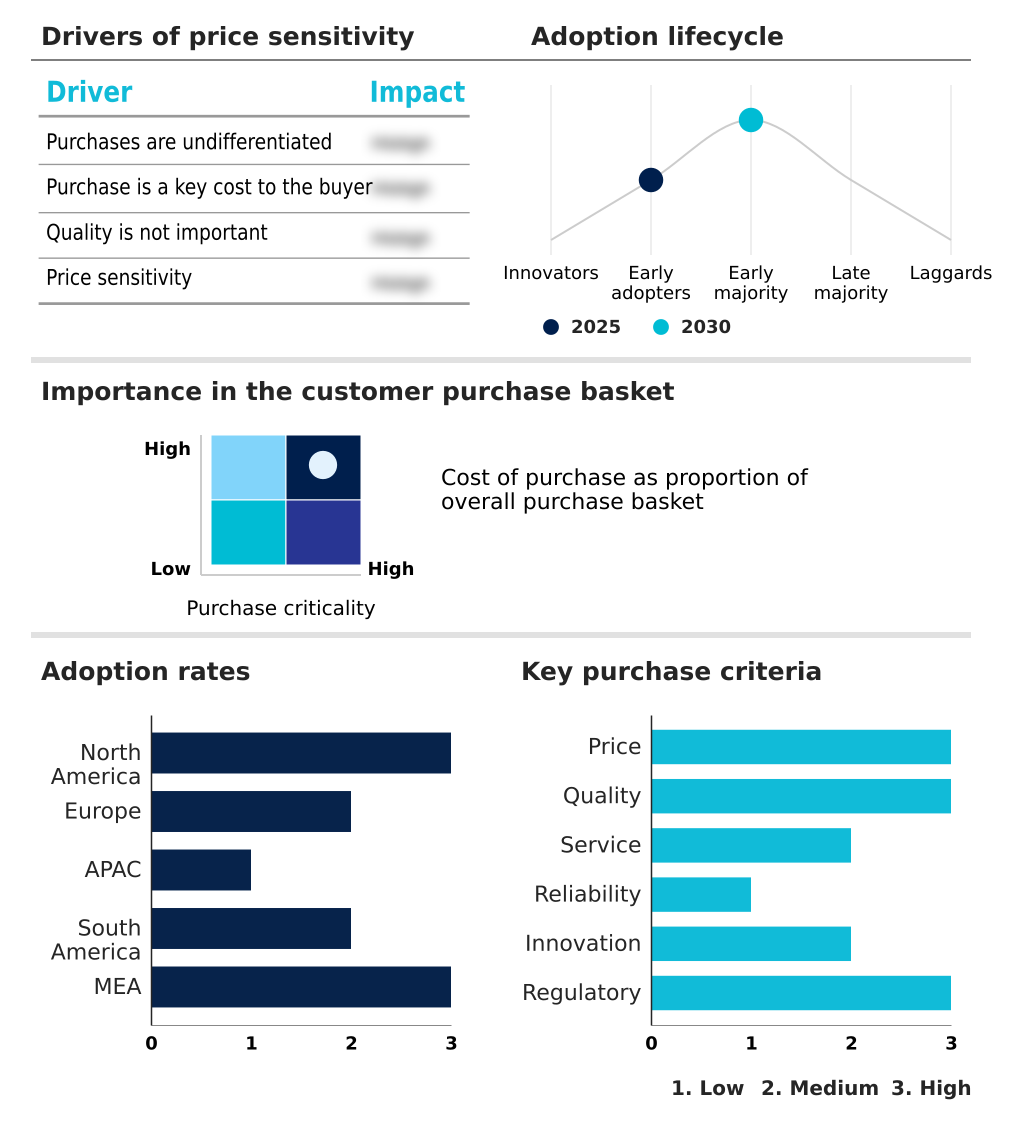
Exclusive Technavio Analysis on Customer Landscape

The high protein-based food market forecasting report includes the adoption lifecycle of the market, covering from the innovator’s stage to the laggard’s stage. It focuses on adoption rates in different regions based on penetration. Furthermore, the high protein-based food market report also includes key purchase criteria and drivers of price sensitivity to help companies evaluate and develop their market growth analysis strategies.

Customer Landscape of High Protein-based Food Industry

Competitive Landscape

Companies are implementing various strategies, such as strategic alliances, high protein-based food market forecast, partnerships, mergers and acquisitions, geographical expansion, and product/service launches, to enhance their presence in the industry.

Abbott Laboratories - Delivering therapeutic nutrition and performance-focused protein powders, including high-protein shakes and specialized drinks, to support diverse health and wellness objectives.

The industry research and growth report includes detailed analyses of the competitive landscape of the market and information about key companies, including:

  • Abbott Laboratories
  • Archer Daniels Midland Co.
  • Beyond Meat Inc.
  • Cargill Inc.
  • Chobani Global Holdings LLC
  • Conagra Brands Inc.
  • Danone SA
  • General Mills Inc.
  • Hormel Foods Corp.
  • Kellanova
  • Maple Leaf Foods Inc.
  • Mars Inc.
  • Mondelez International Inc.
  • Nestle SA
  • PepsiCo Inc.
  • The Campbell Co.
  • The Coca Cola Co.
  • The Kraft Heinz Co.
  • Tyson Foods Inc.
  • Unilever PLC

Qualitative and quantitative analysis of companies has been conducted to help clients understand the wider business environment as well as the strengths and weaknesses of key industry players. Data is qualitatively analyzed to categorize companies as pure play, category-focused, industry-focused, and diversified; it is quantitatively analyzed to categorize companies as dominant, leading, strong, tentative, and weak.

Recent Development and News in High protein-based food market

  • In May, 2025, Danone SA, through its North American division, introduced a new line of Oikos brand shelf-stable protein shakes, each formulated with thirty grams of protein.
  • In May, 2025, a European Union regulatory body issued a directive that streamlined the commercial approval process for insect-based protein isolates in food applications.
  • In March, 2025, a California-based food technology firm announced the nationwide commercial launch of its precision-fermented dairy protein, offering an alternative to traditional whey.
  • In February, 2025, General Mills Inc. expanded its Nature Valley snack line with savory nut bars featuring increased protein content to meet consumer demand for high-satiety options.

Dive into Technavio’s robust research methodology, blending expert interviews, extensive data synthesis, and validated models for unparalleled High Protein-based Food Market insights. See full methodology.

Market Scope
Page number 307
Base year 2025
Historic period 2020-2024
Forecast period 2026-2030
Growth momentum & CAGR Accelerate at a CAGR of 8.5%
Market growth 2026-2030 USD 57119.8 million
Market structure Fragmented
YoY growth 2025-2026(%) 8.3%
Key countries US, Canada, Mexico, UK, Germany, France, Italy, Spain, The Netherlands, China, India, Japan, South Korea, Indonesia, Australia, Brazil, Argentina, Chile, South Africa, UAE, Saudi Arabia, Egypt and Nigeria
Competitive landscape Leading Companies, Market Positioning of Companies, Competitive Strategies, and Industry Risks

Request Free Sample

Research Analyst Overview

  • The High Protein-Based Food Market is defined by intense innovation aimed at improving the nutritional density and sensory appeal of food products. Key developments center on the sourcing and processing of ingredients, with significant investment in whey protein isolate and ultra-filtered milk protein for superior purity.
  • The industry is also advancing mycoprotein texturization and high-protein extrusion techniques to create more palatable plant-based alternatives. A core boardroom-level focus is aligning product portfolios with consumer demand for a clean-label protein source and sustainable protein production, influencing budgeting for R&D in areas like enzymatic protein modification.
  • Success hinges on mastering flavor masking technology and selecting the right texture modification agent to create appealing products. Formulations are increasingly complex, incorporating bioactive peptides and hydrolyzed collagen peptides to offer targeted health benefits beyond basic nutrition. This technical sophistication is demonstrated by a 30% improvement in amino acid bioavailability in next-generation products.
  • The evolution of the fortified food matrix and plant protein extraction methods is pivotal for creating allergen-free protein and non-GMO protein isolate options that meet stringent consumer expectations.

What are the Key Data Covered in this High Protein-based Food Market Research and Growth Report?

  • What is the expected growth of the High Protein-based Food Market between 2026 and 2030?

    • USD 57.12 billion, at a CAGR of 8.5%

  • What segmentation does the market report cover?

    • The report is segmented by Product (Protein-rich drinks, High-protein and high energy sports drink, Protein supplements, High-protein and nutritious sports drink, and Protein-rich packaged foods), Distribution Channel (Offline channel, and Online channel), Source (Animal-based, and Plant-based) and Geography (North America, Europe, APAC, South America, Middle East and Africa)

  • Which regions are analyzed in the report?

    • North America, Europe, APAC, South America and Middle East and Africa

  • What are the key growth drivers and market challenges?

    • Rising demand for metabolic health and body composition optimization, Volatility in raw material costs and supply chain stabilization

  • Who are the major players in the High Protein-based Food Market?

    • Abbott Laboratories, Archer Daniels Midland Co., Beyond Meat Inc., Cargill Inc., Chobani Global Holdings LLC, Conagra Brands Inc., Danone SA, General Mills Inc., Hormel Foods Corp., Kellanova, Maple Leaf Foods Inc., Mars Inc., Mondelez International Inc., Nestle SA, PepsiCo Inc., The Campbell Co., The Coca Cola Co., The Kraft Heinz Co., Tyson Foods Inc. and Unilever PLC

Market Research Insights

  • Market dynamics are defined by a shift toward functional convenience and personalized nutrition. The demand for products like a high-protein meal replacement and post-workout recovery drink is expanding beyond athletes, with adoption rates among general wellness consumers increasing by over 20% in some demographics. This is driving innovation in formats such as the ready-to-drink protein shake and protein bar formulation.
  • Foodservice providers incorporating protein fortification ingredient options into menus have reported a 15% rise in sales of specific health-oriented dishes. Furthermore, the development of specialized products for medical nutrition therapy and geriatric nutrition food is creating new high-value segments, with formulations optimized for specific health outcomes showing a 2:1 preference over unfortified alternatives in clinical settings.

We can help! Our analysts can customize this high protein-based food market research report to meet your requirements.

Get in touch

1. Executive Summary

1.1 Market overview

Executive Summary - Chart on Market Overview
Executive Summary - Data Table on Market Overview
Executive Summary - Chart on Global Market Characteristics
Executive Summary - Chart on Market by Geography
Executive Summary - Chart on Market Segmentation by Product
Executive Summary - Chart on Market Segmentation by Distribution Channel
Executive Summary - Chart on Market Segmentation by Source
Executive Summary - Chart on Incremental Growth
Executive Summary - Data Table on Incremental Growth
Executive Summary - Chart on Company Market Positioning

2. Technavio Analysis

2.1 Analysis of price sensitivity, lifecycle, customer purchase basket, adoption rates, and purchase criteria

2.2 Criticality of inputs and Factors of differentiation

Chart on Overview on criticality of inputs and factors of differentiation

2.3 Factors of disruption

Chart on Overview on factors of disruption

2.4 Impact of drivers and challenges

Chart on Impact of drivers and challenges in 2025 and 2030

3. Market Landscape

3.1 Market ecosystem

Chart on Parent Market
Data Table on - Parent Market

3.2 Market characteristics

Chart on Market characteristics analysis

3.3 Value chain analysis

Chart on Value chain analysis

4. Market Sizing

4.1 Market definition

Data Table on Offerings of companies included in the market definition

4.2 Market segment analysis

Market segments

4.3 Market size 2025

4.4 Market outlook: Forecast for 2025-2030

Chart on Global - Market size and forecast 2025-2030 ($ million)
Data Table on Global - Market size and forecast 2025-2030 ($ million)
Chart on Global Market: Year-over-year growth 2025-2030 (%)
Data Table on Global Market: Year-over-year growth 2025-2030 (%)

5. Historic Market Size

5.1 Global High Protein-Based Food Market 2020 - 2024

Historic Market Size - Data Table on Global High Protein-Based Food Market 2020 - 2024 ($ million)

5.2 Product segment analysis 2020 - 2024

Historic Market Size - Product Segment 2020 - 2024 ($ million)

5.3 Distribution Channel segment analysis 2020 - 2024

Historic Market Size - Distribution Channel Segment 2020 - 2024 ($ million)

5.4 Source segment analysis 2020 - 2024

Historic Market Size - Source Segment 2020 - 2024 ($ million)

5.5 Geography segment analysis 2020 - 2024

Historic Market Size - Geography Segment 2020 - 2024 ($ million)

5.6 Country segment analysis 2020 - 2024

Historic Market Size - Country Segment 2020 - 2024 ($ million)

6. Qualitative Analysis

6.1 Impact of AI on Global High Protein-based Food Market

6.2 Impact of geopolitical conflicts on Global High Protein-based Food Market

7. Five Forces Analysis

7.1 Five forces summary

Five forces analysis - Comparison between 2025 and 2030

7.2 Bargaining power of buyers

Bargaining power of buyers - Impact of key factors 2025 and 2030

7.3 Bargaining power of suppliers

Bargaining power of suppliers - Impact of key factors in 2025 and 2030

7.4 Threat of new entrants

Threat of new entrants - Impact of key factors in 2025 and 2030

7.5 Threat of substitutes

Threat of substitutes - Impact of key factors in 2025 and 2030

7.6 Threat of rivalry

Threat of rivalry - Impact of key factors in 2025 and 2030

7.7 Market condition

Chart on Market condition - Five forces 2025 and 2030

8. Market Segmentation by Product

8.1 Market segments

Chart on Product - Market share 2025-2030 (%)
Data Table on Product - Market share 2025-2030 (%)

8.2 Comparison by Product

Chart on Comparison by Product
Data Table on Comparison by Product

8.3 Protein-rich drinks - Market size and forecast 2025-2030

Chart on Protein-rich drinks - Market size and forecast 2025-2030 ($ million)
Data Table on Protein-rich drinks - Market size and forecast 2025-2030 ($ million)
Chart on Protein-rich drinks - Year-over-year growth 2025-2030 (%)
Data Table on Protein-rich drinks - Year-over-year growth 2025-2030 (%)

8.4 High-protein and high energy sports drink - Market size and forecast 2025-2030

Chart on High-protein and high energy sports drink - Market size and forecast 2025-2030 ($ million)
Data Table on High-protein and high energy sports drink - Market size and forecast 2025-2030 ($ million)
Chart on High-protein and high energy sports drink - Year-over-year growth 2025-2030 (%)
Data Table on High-protein and high energy sports drink - Year-over-year growth 2025-2030 (%)

8.5 Protein supplements - Market size and forecast 2025-2030

Chart on Protein supplements - Market size and forecast 2025-2030 ($ million)
Data Table on Protein supplements - Market size and forecast 2025-2030 ($ million)
Chart on Protein supplements - Year-over-year growth 2025-2030 (%)
Data Table on Protein supplements - Year-over-year growth 2025-2030 (%)

8.6 High-protein and nutritious sports drink - Market size and forecast 2025-2030

Chart on High-protein and nutritious sports drink - Market size and forecast 2025-2030 ($ million)
Data Table on High-protein and nutritious sports drink - Market size and forecast 2025-2030 ($ million)
Chart on High-protein and nutritious sports drink - Year-over-year growth 2025-2030 (%)
Data Table on High-protein and nutritious sports drink - Year-over-year growth 2025-2030 (%)

8.7 Protein-rich packaged foods - Market size and forecast 2025-2030

Chart on Protein-rich packaged foods - Market size and forecast 2025-2030 ($ million)
Data Table on Protein-rich packaged foods - Market size and forecast 2025-2030 ($ million)
Chart on Protein-rich packaged foods - Year-over-year growth 2025-2030 (%)
Data Table on Protein-rich packaged foods - Year-over-year growth 2025-2030 (%)

8.8 Market opportunity by Product

Market opportunity by Product ($ million)
Data Table on Market opportunity by Product ($ million)

9. Market Segmentation by Distribution Channel

9.1 Market segments

Chart on Distribution Channel - Market share 2025-2030 (%)
Data Table on Distribution Channel - Market share 2025-2030 (%)

9.2 Comparison by Distribution Channel

Chart on Comparison by Distribution Channel
Data Table on Comparison by Distribution Channel

9.3 Offline channel - Market size and forecast 2025-2030

Chart on Offline channel - Market size and forecast 2025-2030 ($ million)
Data Table on Offline channel - Market size and forecast 2025-2030 ($ million)
Chart on Offline channel - Year-over-year growth 2025-2030 (%)
Data Table on Offline channel - Year-over-year growth 2025-2030 (%)

9.4 Online channel - Market size and forecast 2025-2030

Chart on Online channel - Market size and forecast 2025-2030 ($ million)
Data Table on Online channel - Market size and forecast 2025-2030 ($ million)
Chart on Online channel - Year-over-year growth 2025-2030 (%)
Data Table on Online channel - Year-over-year growth 2025-2030 (%)

9.5 Market opportunity by Distribution Channel

Market opportunity by Distribution Channel ($ million)
Data Table on Market opportunity by Distribution Channel ($ million)

10. Market Segmentation by Source

10.1 Market segments

Chart on Source - Market share 2025-2030 (%)
Data Table on Source - Market share 2025-2030 (%)

10.2 Comparison by Source

Chart on Comparison by Source
Data Table on Comparison by Source

10.3 Animal-based - Market size and forecast 2025-2030

Chart on Animal-based - Market size and forecast 2025-2030 ($ million)
Data Table on Animal-based - Market size and forecast 2025-2030 ($ million)
Chart on Animal-based - Year-over-year growth 2025-2030 (%)
Data Table on Animal-based - Year-over-year growth 2025-2030 (%)

10.4 Plant-based - Market size and forecast 2025-2030

Chart on Plant-based - Market size and forecast 2025-2030 ($ million)
Data Table on Plant-based - Market size and forecast 2025-2030 ($ million)
Chart on Plant-based - Year-over-year growth 2025-2030 (%)
Data Table on Plant-based - Year-over-year growth 2025-2030 (%)

10.5 Market opportunity by Source

Market opportunity by Source ($ million)
Data Table on Market opportunity by Source ($ million)

11. Customer Landscape

11.1 Customer landscape overview

Analysis of price sensitivity, lifecycle, customer purchase basket, adoption rates, and purchase criteria

12. Geographic Landscape

12.1 Geographic segmentation

Chart on Market share by geography 2025-2030 (%)
Data Table on Market share by geography 2025-2030 (%)

12.2 Geographic comparison

Chart on Geographic comparison
Data Table on Geographic comparison

12.3 North America - Market size and forecast 2025-2030

Chart on North America - Market size and forecast 2025-2030 ($ million)
Data Table on North America - Market size and forecast 2025-2030 ($ million)
Chart on North America - Year-over-year growth 2025-2030 (%)
Data Table on North America - Year-over-year growth 2025-2030 (%)
Chart on Regional Comparison - North America
Data Table on Regional Comparison - North America

12.3.1 US - Market size and forecast 2025-2030

Chart on US - Market size and forecast 2025-2030 ($ million)
Data Table on US - Market size and forecast 2025-2030 ($ million)
Chart on US - Year-over-year growth 2025-2030 (%)
Data Table on US - Year-over-year growth 2025-2030 (%)

12.3.2 Canada - Market size and forecast 2025-2030

Chart on Canada - Market size and forecast 2025-2030 ($ million)
Data Table on Canada - Market size and forecast 2025-2030 ($ million)
Chart on Canada - Year-over-year growth 2025-2030 (%)
Data Table on Canada - Year-over-year growth 2025-2030 (%)

12.3.3 Mexico - Market size and forecast 2025-2030

Chart on Mexico - Market size and forecast 2025-2030 ($ million)
Data Table on Mexico - Market size and forecast 2025-2030 ($ million)
Chart on Mexico - Year-over-year growth 2025-2030 (%)
Data Table on Mexico - Year-over-year growth 2025-2030 (%)

12.4 Europe - Market size and forecast 2025-2030

Chart on Europe - Market size and forecast 2025-2030 ($ million)
Data Table on Europe - Market size and forecast 2025-2030 ($ million)
Chart on Europe - Year-over-year growth 2025-2030 (%)
Data Table on Europe - Year-over-year growth 2025-2030 (%)
Chart on Regional Comparison - Europe
Data Table on Regional Comparison - Europe

12.4.1 UK - Market size and forecast 2025-2030

Chart on UK - Market size and forecast 2025-2030 ($ million)
Data Table on UK - Market size and forecast 2025-2030 ($ million)
Chart on UK - Year-over-year growth 2025-2030 (%)
Data Table on UK - Year-over-year growth 2025-2030 (%)

12.4.2 Germany - Market size and forecast 2025-2030

Chart on Germany - Market size and forecast 2025-2030 ($ million)
Data Table on Germany - Market size and forecast 2025-2030 ($ million)
Chart on Germany - Year-over-year growth 2025-2030 (%)
Data Table on Germany - Year-over-year growth 2025-2030 (%)

12.4.3 France - Market size and forecast 2025-2030

Chart on France - Market size and forecast 2025-2030 ($ million)
Data Table on France - Market size and forecast 2025-2030 ($ million)
Chart on France - Year-over-year growth 2025-2030 (%)
Data Table on France - Year-over-year growth 2025-2030 (%)

12.4.4 Italy - Market size and forecast 2025-2030

Chart on Italy - Market size and forecast 2025-2030 ($ million)
Data Table on Italy - Market size and forecast 2025-2030 ($ million)
Chart on Italy - Year-over-year growth 2025-2030 (%)
Data Table on Italy - Year-over-year growth 2025-2030 (%)

12.4.5 Spain - Market size and forecast 2025-2030

Chart on Spain - Market size and forecast 2025-2030 ($ million)
Data Table on Spain - Market size and forecast 2025-2030 ($ million)
Chart on Spain - Year-over-year growth 2025-2030 (%)
Data Table on Spain - Year-over-year growth 2025-2030 (%)

12.4.6 The Netherlands - Market size and forecast 2025-2030

Chart on The Netherlands - Market size and forecast 2025-2030 ($ million)
Data Table on The Netherlands - Market size and forecast 2025-2030 ($ million)
Chart on The Netherlands - Year-over-year growth 2025-2030 (%)
Data Table on The Netherlands - Year-over-year growth 2025-2030 (%)

12.5 APAC - Market size and forecast 2025-2030

Chart on APAC - Market size and forecast 2025-2030 ($ million)
Data Table on APAC - Market size and forecast 2025-2030 ($ million)
Chart on APAC - Year-over-year growth 2025-2030 (%)
Data Table on APAC - Year-over-year growth 2025-2030 (%)
Chart on Regional Comparison - APAC
Data Table on Regional Comparison - APAC

12.5.1 China - Market size and forecast 2025-2030

Chart on China - Market size and forecast 2025-2030 ($ million)
Data Table on China - Market size and forecast 2025-2030 ($ million)
Chart on China - Year-over-year growth 2025-2030 (%)
Data Table on China - Year-over-year growth 2025-2030 (%)

12.5.2 India - Market size and forecast 2025-2030

Chart on India - Market size and forecast 2025-2030 ($ million)
Data Table on India - Market size and forecast 2025-2030 ($ million)
Chart on India - Year-over-year growth 2025-2030 (%)
Data Table on India - Year-over-year growth 2025-2030 (%)

12.5.3 Japan - Market size and forecast 2025-2030

Chart on Japan - Market size and forecast 2025-2030 ($ million)
Data Table on Japan - Market size and forecast 2025-2030 ($ million)
Chart on Japan - Year-over-year growth 2025-2030 (%)
Data Table on Japan - Year-over-year growth 2025-2030 (%)

12.5.4 South Korea - Market size and forecast 2025-2030

Chart on South Korea - Market size and forecast 2025-2030 ($ million)
Data Table on South Korea - Market size and forecast 2025-2030 ($ million)
Chart on South Korea - Year-over-year growth 2025-2030 (%)
Data Table on South Korea - Year-over-year growth 2025-2030 (%)

12.5.5 Indonesia - Market size and forecast 2025-2030

Chart on Indonesia - Market size and forecast 2025-2030 ($ million)
Data Table on Indonesia - Market size and forecast 2025-2030 ($ million)
Chart on Indonesia - Year-over-year growth 2025-2030 (%)
Data Table on Indonesia - Year-over-year growth 2025-2030 (%)

12.5.6 Australia - Market size and forecast 2025-2030

Chart on Australia - Market size and forecast 2025-2030 ($ million)
Data Table on Australia - Market size and forecast 2025-2030 ($ million)
Chart on Australia - Year-over-year growth 2025-2030 (%)
Data Table on Australia - Year-over-year growth 2025-2030 (%)

12.6 South America - Market size and forecast 2025-2030

Chart on South America - Market size and forecast 2025-2030 ($ million)
Data Table on South America - Market size and forecast 2025-2030 ($ million)
Chart on South America - Year-over-year growth 2025-2030 (%)
Data Table on South America - Year-over-year growth 2025-2030 (%)
Chart on Regional Comparison - South America
Data Table on Regional Comparison - South America

12.6.1 Brazil - Market size and forecast 2025-2030

Chart on Brazil - Market size and forecast 2025-2030 ($ million)
Data Table on Brazil - Market size and forecast 2025-2030 ($ million)
Chart on Brazil - Year-over-year growth 2025-2030 (%)
Data Table on Brazil - Year-over-year growth 2025-2030 (%)

12.6.2 Argentina - Market size and forecast 2025-2030

Chart on Argentina - Market size and forecast 2025-2030 ($ million)
Data Table on Argentina - Market size and forecast 2025-2030 ($ million)
Chart on Argentina - Year-over-year growth 2025-2030 (%)
Data Table on Argentina - Year-over-year growth 2025-2030 (%)

12.6.3 Chile - Market size and forecast 2025-2030

Chart on Chile - Market size and forecast 2025-2030 ($ million)
Data Table on Chile - Market size and forecast 2025-2030 ($ million)
Chart on Chile - Year-over-year growth 2025-2030 (%)
Data Table on Chile - Year-over-year growth 2025-2030 (%)

12.7 Middle East and Africa - Market size and forecast 2025-2030

Chart on Middle East and Africa - Market size and forecast 2025-2030 ($ million)
Data Table on Middle East and Africa - Market size and forecast 2025-2030 ($ million)
Chart on Middle East and Africa - Year-over-year growth 2025-2030 (%)
Data Table on Middle East and Africa - Year-over-year growth 2025-2030 (%)
Chart on Regional Comparison - Middle East and Africa
Data Table on Regional Comparison - Middle East and Africa

12.7.1 South Africa - Market size and forecast 2025-2030

Chart on South Africa - Market size and forecast 2025-2030 ($ million)
Data Table on South Africa - Market size and forecast 2025-2030 ($ million)
Chart on South Africa - Year-over-year growth 2025-2030 (%)
Data Table on South Africa - Year-over-year growth 2025-2030 (%)

12.7.2 UAE - Market size and forecast 2025-2030

Chart on UAE - Market size and forecast 2025-2030 ($ million)
Data Table on UAE - Market size and forecast 2025-2030 ($ million)
Chart on UAE - Year-over-year growth 2025-2030 (%)
Data Table on UAE - Year-over-year growth 2025-2030 (%)

12.7.3 Saudi Arabia - Market size and forecast 2025-2030

Chart on Saudi Arabia - Market size and forecast 2025-2030 ($ million)
Data Table on Saudi Arabia - Market size and forecast 2025-2030 ($ million)
Chart on Saudi Arabia - Year-over-year growth 2025-2030 (%)
Data Table on Saudi Arabia - Year-over-year growth 2025-2030 (%)

12.7.4 Egypt - Market size and forecast 2025-2030

Chart on Egypt - Market size and forecast 2025-2030 ($ million)
Data Table on Egypt - Market size and forecast 2025-2030 ($ million)
Chart on Egypt - Year-over-year growth 2025-2030 (%)
Data Table on Egypt - Year-over-year growth 2025-2030 (%)

12.7.5 Nigeria - Market size and forecast 2025-2030

Chart on Nigeria - Market size and forecast 2025-2030 ($ million)
Data Table on Nigeria - Market size and forecast 2025-2030 ($ million)
Chart on Nigeria - Year-over-year growth 2025-2030 (%)
Data Table on Nigeria - Year-over-year growth 2025-2030 (%)

12.8 Market opportunity by geography

Market opportunity by geography ($ million)
Data Tables on Market opportunity by geography ($ million)

13. Drivers, Challenges, and Opportunity

13.1 Market drivers

Rising demand for metabolic health and body composition optimization
Proliferation of functional convenience and portable protein formats
Diversification of protein sources and rise of flexitarianism

13.2 Market challenges

Volatility in raw material costs and supply chain stabilization
Stringent regulatory environments and labeling transparency
Balancing sensory attributes with nutritional density

13.3 Impact of drivers and challenges

Impact of drivers and challenges in 2025 and 2030

13.4 Market opportunities

Integration of high-protein formulations into nostalgic and traditional breakfast staples
Expansion of high-density protein solutions in portable and quick-commerce formats
Mainstreaming of next-generation sustainable and fermented protein sources

14. Competitive Landscape

14.1 Overview

14.2

Overview on criticality of inputs and factors of differentiation

14.3 Landscape disruption

Overview on factors of disruption

14.4 Industry risks

Impact of key risks on business

15. Competitive Analysis

15.1 Companies profiled

Companies covered

15.2 Company ranking index

15.3 Market positioning of companies

Matrix on companies position and classification

15.4 Abbott Laboratories

Abbott Laboratories - Overview
Abbott Laboratories - Business segments
Abbott Laboratories - Key news
Abbott Laboratories - Key offerings
Abbott Laboratories - Segment focus
SWOT

15.5 Archer Daniels Midland Co.

Archer Daniels Midland Co. - Overview
Archer Daniels Midland Co. - Business segments
Archer Daniels Midland Co. - Key news
Archer Daniels Midland Co. - Key offerings
Archer Daniels Midland Co. - Segment focus
SWOT

15.6 Cargill Inc.

Cargill Inc. - Overview
Cargill Inc. - Product / Service
Cargill Inc. - Key news
Cargill Inc. - Key offerings
SWOT

15.7 Conagra Brands Inc.

Conagra Brands Inc. - Overview
Conagra Brands Inc. - Business segments
Conagra Brands Inc. - Key offerings
Conagra Brands Inc. - Segment focus
SWOT

15.8 General Mills Inc.

General Mills Inc. - Overview
General Mills Inc. - Business segments
General Mills Inc. - Key offerings
General Mills Inc. - Segment focus
SWOT

15.9 Hormel Foods Corp.

Hormel Foods Corp. - Overview
Hormel Foods Corp. - Business segments
Hormel Foods Corp. - Key offerings
Hormel Foods Corp. - Segment focus
SWOT

15.10 Mars Inc.

Mars Inc. - Overview
Mars Inc. - Product / Service
Mars Inc. - Key offerings
SWOT

15.11 Mondelez International Inc.

Mondelez International Inc. - Overview
Mondelez International Inc. - Business segments
Mondelez International Inc. - Key offerings
Mondelez International Inc. - Segment focus
SWOT

15.12 Nestle SA

Nestle SA - Overview
Nestle SA - Business segments
Nestle SA - Key news
Nestle SA - Key offerings
Nestle SA - Segment focus
SWOT

15.13 PepsiCo Inc.

PepsiCo Inc. - Overview
PepsiCo Inc. - Business segments
PepsiCo Inc. - Key news
PepsiCo Inc. - Key offerings
PepsiCo Inc. - Segment focus
SWOT

15.14 The Campbell Co.

The Campbell Co. - Overview
The Campbell Co. - Business segments
The Campbell Co. - Key news
The Campbell Co. - Key offerings
The Campbell Co. - Segment focus
SWOT

15.15 The Coca Cola Co.

The Coca Cola Co. - Overview
The Coca Cola Co. - Business segments
The Coca Cola Co. - Key news
The Coca Cola Co. - Key offerings
The Coca Cola Co. - Segment focus
SWOT

15.16 The Kraft Heinz Co.

The Kraft Heinz Co. - Overview
The Kraft Heinz Co. - Business segments
The Kraft Heinz Co. - Key news
The Kraft Heinz Co. - Key offerings
The Kraft Heinz Co. - Segment focus
SWOT

15.17 Tyson Foods Inc.

Tyson Foods Inc. - Overview
Tyson Foods Inc. - Business segments
Tyson Foods Inc. - Key news
Tyson Foods Inc. - Key offerings
Tyson Foods Inc. - Segment focus
SWOT

15.18 Unilever PLC

Unilever PLC - Overview
Unilever PLC - Business segments
Unilever PLC - Key news
Unilever PLC - Key offerings
Unilever PLC - Segment focus
SWOT

16. Appendix

16.1 Scope of the report

Market definition
Objectives
Notes and caveats

16.2 Inclusions and exclusions checklist

Inclusions checklist
Exclusions checklist

16.3 Currency conversion rates for US$

16.4 Research methodology

16.5 Data procurement

Information sources

16.6 Data validation

16.7 Validation techniques employed for market sizing

16.8 Data synthesis

16.9 360 degree market analysis

16.10 List of abbreviations

Research Methodology

Technavio presents a detailed picture of the market by way of study, synthesis, and summation of data from multiple sources. The analysts have presented the various facets of the market with a particular focus on identifying the key industry influencers. The data thus presented is comprehensive, reliable, and the result of extensive research, both primary and secondary.

INFORMATION SOURCES

Primary sources

  • Manufacturers and suppliers
  • Channel partners
  • Industry experts
  • Strategic decision makers

Secondary sources

  • Industry journals and periodicals
  • Government data
  • Financial reports of key industry players
  • Historical data
  • Press releases

DATA ANALYSIS

Data Synthesis

  • Collation of data
  • Estimation of key figures
  • Analysis of derived insights

Data Validation

  • Triangulation with data models
  • Reference against proprietary databases
  • Corroboration with industry experts

REPORT WRITING

Qualitative

  • Market drivers
  • Market challenges
  • Market trends
  • Five forces analysis

Quantitative

  • Market size and forecast
  • Market segmentation
  • Geographical insights
  • Competitive landscape

Interested in this report?

Get your sample now to see our research methodology and insights!

Download Now

Frequently Asked Questions

High Protein-based Food market growth will increase by USD 57119.8 million during 2026-2030.

The High Protein-based Food market is expected to grow at a CAGR of 8.5% during 2026-2030.

High Protein-based Food market is segmented by Product (Protein-rich drinks, High-protein and high energy sports drink, Protein supplements, High-protein and nutritious sports drink, Protein-rich packaged foods) Distribution channel (Offline channel, Online channel) Source (Animal-based, Plant-based)

Abbott Laboratories, Archer Daniels Midland Co., Beyond Meat Inc., Cargill Inc., Chobani Global Holdings LLC, Conagra Brands Inc., Danone SA, General Mills Inc., Hormel Foods Corp., Kellanova, Maple Leaf Foods Inc., Mars Inc., Mondelez International Inc., Nestle SA, PepsiCo Inc., The Campbell Co., The Coca Cola Co., The Kraft Heinz Co., Tyson Foods Inc., Unilever PLC are a few of the key vendors in the High Protein-based Food market.

North America will register the highest growth rate of 38.3% among the other regions. Therefore, the High Protein-based Food market in North America is expected to garner significant business opportunities for the vendors during the forecast period.

US, Canada, Mexico, UK, Germany, France, Italy, Spain, The Netherlands, China, India, Japan, South Korea, Indonesia, Australia, Brazil, Argentina, Chile, South Africa, UAE, Saudi Arabia, Egypt, Nigeria

  • Rising demand for metabolic health and body composition optimization is the driving factor this market.

The High Protein-based Food market vendors should focus on grabbing business opportunities from the Product segment as it accounted for the largest market share in the base year.
RIA - Research AI Assistant
Ask RIA