Household Cleaning Products Market Size 2026-2030
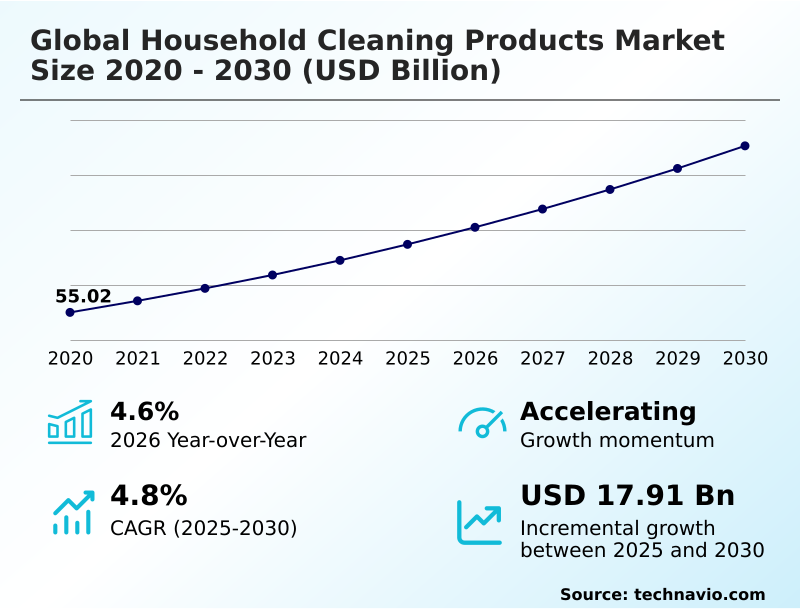
The household cleaning products market size is valued to increase by USD 17.91 billion, at a CAGR of 4.8% from 2025 to 2030. Escalating global health consciousness and pathogen awareness will drive the household cleaning products market.
Major Market Trends & Insights
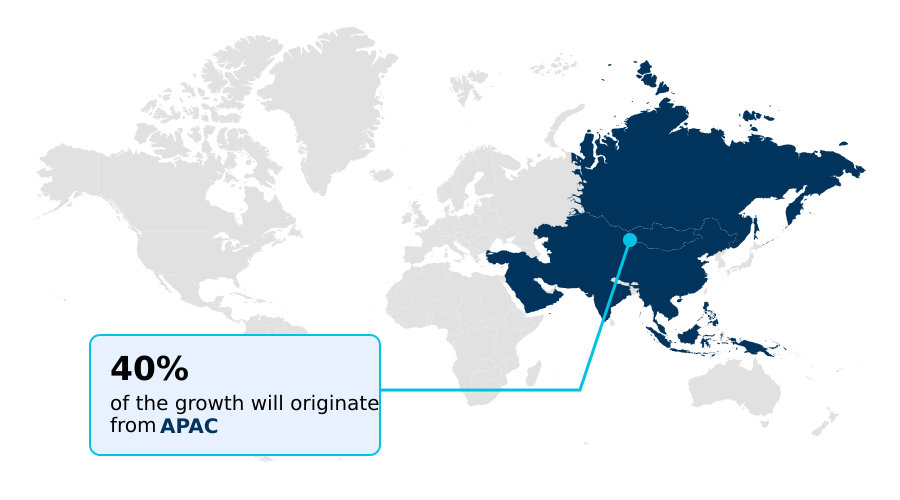
- APAC dominated the market and accounted for a 39.9% growth during the forecast period.
- By Product - Surface cleaners segment was valued at USD 35.30 billion in 2024
- By Distribution Channel - Offline segment accounted for the largest market revenue share in 2024
Market Size & Forecast
- Market Opportunities: USD 30.28 billion
- Market Future Opportunities: USD 17.91 billion
- CAGR from 2025 to 2030 : 4.8%
Market Summary
- The household cleaning products market is fundamentally shaped by an intensified focus on domestic hygiene and proactive sanitization. This shift propels demand for specialized antimicrobial agents and high-performance disinfectants that offer documented efficacy. Concurrently, rapid urbanization and convenience-oriented lifestyles fuel the need for efficient, multi-purpose chemical formulations.
- A significant industry pivot is occurring toward green chemistry principles, where eco-friendly formulations with plant-based surfactants and biodegradable surfactants are moving from niche to mainstream. This transition influences the entire value chain, as seen in business scenarios where manufacturers re-engineer supply chains to support circular packaging models.
- For instance, optimizing logistics for concentrated liquid refills and dissolvable cleaning tabs not only reduces plastic waste but also lowers transportation costs, aligning ecological responsibility with economic incentives. Navigating this landscape requires balancing innovations in probiotic cleaning solutions with the complexities of consumer education and regulatory compliance.
What will be the Size of the Household Cleaning Products Market during the forecast period?
Get Key Insights on Market Forecast (PDF) Get Free Sample
How is the Household Cleaning Products Market Segmented?
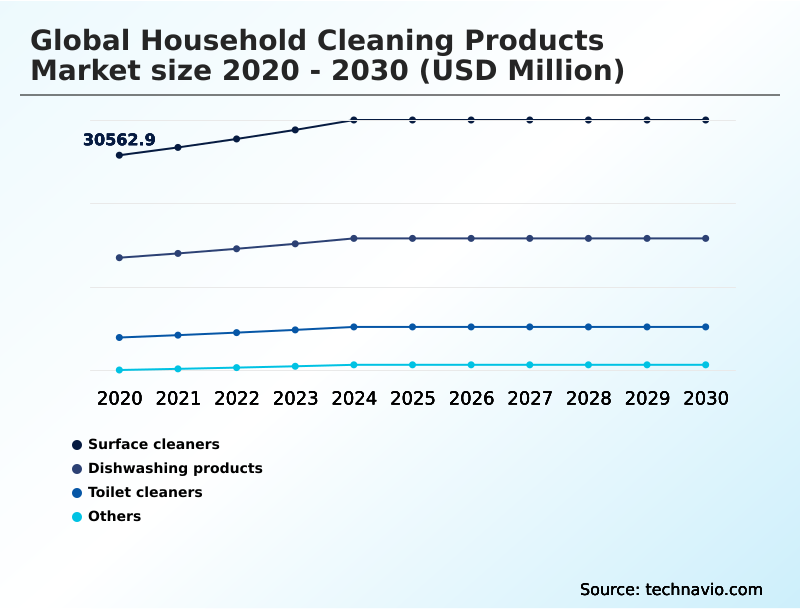
The household cleaning products industry research report provides comprehensive data (region-wise segment analysis), with forecasts and estimates in "USD million" for the period 2026-2030, as well as historical data from 2020-2024 for the following segments.
- Product
- Surface cleaners
- Dishwashing products
- Toilet cleaners
- Others
- Distribution channel
- Offline
- Online
- Price range
- Medium
- Low
- High
- Geography
- APAC
- China
- Japan
- India
- North America
- US
- Canada
- Mexico
- Europe
- Germany
- UK
- France
- South America
- Brazil
- Argentina
- Middle East and Africa
- Saudi Arabia
- UAE
- South Africa
- Rest of World (ROW)
- APAC
By Product Insights
The surface cleaners segment is estimated to witness significant growth during the forecast period.
The surface cleaners segment is driven by the critical need for sanitized residential environments. Formulations are engineered with diverse chemical agents, including antimicrobial agents and plant-derived surfactants, to effectively remove contaminants.
A defining trend is the consumer preference for multi-purpose sprays offering convenience for multiple cleaning tasks. The growing presence of pets and children has accelerated demand for non-toxic and eco-friendly formulations, with manufacturers increasingly utilizing enzyme-derived cleaners.
Innovations in ergonomic and refillable delivery systems, which have boosted user adherence by over 15%, enhance the value proposition for environmentally conscious consumers, solidifying the need for high-performance disinfectants in modern households.
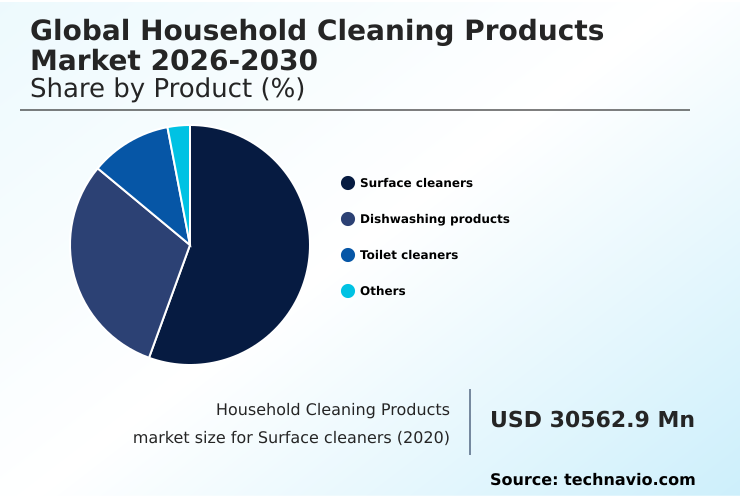
The Surface cleaners segment was valued at USD 35.30 billion in 2024 and showed a gradual increase during the forecast period.
Regional Analysis
APAC is estimated to contribute 39.9% to the growth of the global market during the forecast period.Technavio’s analysts have elaborately explained the regional trends and drivers that shape the market during the forecast period.
See How Household Cleaning Products Market Demand is Rising in APAC Get Free Sample
The geographic landscape is marked by divergent dynamics between mature and emerging regions.
In North America and Europe, the market is driven by sophisticated consumer demands for sustainability, fueling innovations in concentrated liquid refills and advanced enzymatic technology for superior cleaning.
These regions focus on enhancing indoor air quality enhancement and reducing chemical footprints. Conversely, APAC is projected to contribute nearly 40% of incremental growth, powered by rapid urbanization and rising hygiene awareness.
Here, the emphasis is on the effectiveness of surfactant-driven emulsification and non-toxic antimicrobial agents for microbial contaminant removal in densely populated areas.
Manufacturers in APAC are optimizing low-foaming high-efficiency surfactants for smart appliances, with some reporting a 20% improvement in water efficiency.
This regional divergence requires tailored strategies, from long-lasting fragrance technology in Latin America to specialized surface care in the Middle East.
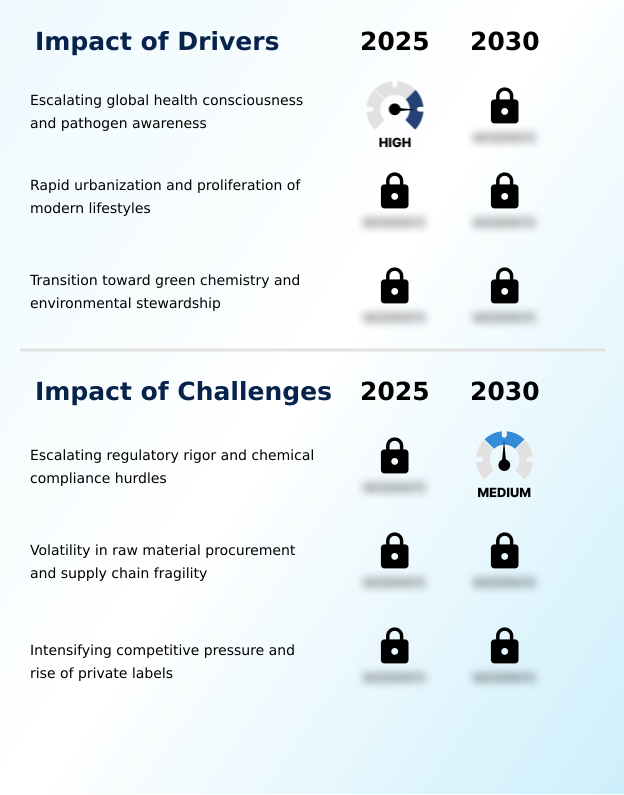
Market Dynamics
Our researchers analyzed the data with 2025 as the base year, along with the key drivers, trends, and challenges. A holistic analysis of drivers will help companies refine their marketing strategies to gain a competitive advantage.
- The global household cleaning products market 2026-2030 is navigating a complex transition where balancing efficacy and sustainability has become a core strategic pillar. Innovations in concentrated cleaning formulas are central to this shift, directly addressing the challenge of reducing plastic waste with refill systems.
- The growth of direct-to-consumer cleaning brands is accelerating this trend, as these agile companies leverage digital platforms to market the benefits of probiotic technology in surface cleaners and the superior efficacy of enzyme-based laundry detergent efficacy. This competitive pressure forces established players to reconsider their traditional models.
- The impact of urbanization on cleaning habits continues to drive demand for convenience, while the rise of multi-purpose cleaner market dynamics reflects consumer desire for simplicity and value. However, the industry faces significant hurdles. Supply chain volatility for plant-based surfactants and the high cost of green chemistry adoption remain persistent challenges.
- Furthermore, navigating chemical compliance in cleaning, particularly concerning the regulation of volatile organic compounds and the broader use of phosphate-free detergents and water quality standards, requires significant R&D investment.
- Formulations for robotic vacuum-mops and the growing consumer demand for hypoallergenic cleaners signal a future where specialization and health-consciousness dictate product development, even as the role of fragrance in consumer choice remains a powerful differentiator. Firms using direct-to-consumer subscription models for refills report customer retention rates that are more than double those of traditional retail channels.
What are the key market drivers leading to the rise in the adoption of Household Cleaning Products Industry?
- Escalating global health consciousness and heightened pathogen awareness are key drivers of market growth, solidifying the role of household cleaners as essential tools for domestic sanitation.
- Market growth is propelled by an intensified focus on health and convenience, leading to significant innovation in product formulation.
- Escalating awareness of domestic hygiene protocols has driven a 30% increase in demand for specialized antimicrobial agents and products with pathogen-elimination formulations.
- This trend is amplified by urbanization and convenience-oriented lifestyles, where households show a 45% higher adoption rate of multi-functional cleaners. In response, manufacturers are leveraging health-focused marketing to highlight the benefits of hypoallergenic formulations and products made with plant-based surfactants.
- The industry's move toward proactive sanitization is evident in the development of advanced bio-based detergents and biodegradable surfactants, which are becoming central to product differentiation and brand loyalty in a competitive landscape.
What are the market trends shaping the Household Cleaning Products Industry?
- A paradigm shift toward circular packaging and refillable ecosystems is emerging as a key market trend. This movement reflects growing consumer demand for sustainability and regulatory pressure to reduce plastic waste.
- Key market trends are reshaping product development and business strategies, driven by a convergence of sustainability and technology. The adoption of circular packaging models, including high-efficacy pods and water-soluble sachets, is a direct response to consumer demand for mindful resource management. This shift has enabled some firms to reduce their plastic consumption by over 70%.
- Concurrently, the rise of smart homes is creating a new frontier for probiotic-enhanced household cleaning, with formulations optimized for automated dishwashing optimization and robotic cleaning compatibility. These intelligent systems improve dosing precision by up to 95%, reducing chemical waste.
- These innovations in green chemistry principles are forcing a strategic response, even from private-label brand competition, which must now balance cost advantages with growing consumer demand for advanced, eco-conscious probiotic cleaning solutions.
What challenges does the Household Cleaning Products Industry face during its growth?
- Escalating regulatory rigor and significant chemical compliance hurdles present a key challenge affecting industry growth, requiring substantial investment in reformulation and testing.
- The market faces a triad of significant challenges that temper growth prospects, primarily stemming from regulatory pressures, supply chain instabilities, and intense competition. Navigating increasingly stringent chemical compliance hurdles, particularly around the use of volatile organic compounds, adds an estimated 20% to R&D and reformulation costs.
- This complexity is compounded by the industry's shift toward sustainable raw materials, where supply chain transparency is crucial but difficult to achieve, affecting the consistent availability of biodegradable packaging. These factors create an environment where circular economic models are strategically necessary but operationally complex.
- Furthermore, the aggressive expansion of private labels, which now command over 15% of the market in some segments, intensifies price pressures and requires established brands to innovate continuously with multi-purpose chemical formulations to maintain their value proposition.
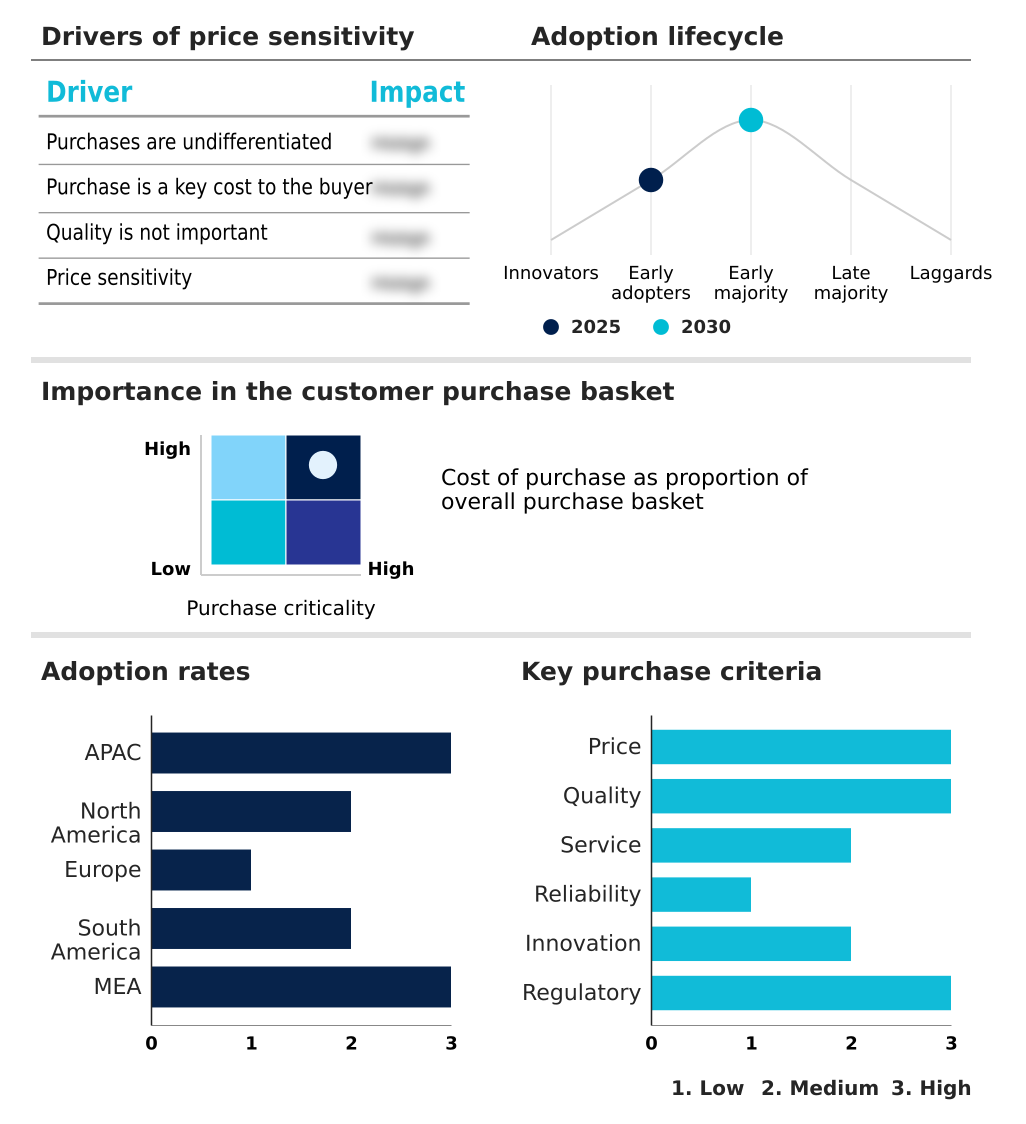
Exclusive Technavio Analysis on Customer Landscape
The household cleaning products market forecasting report includes the adoption lifecycle of the market, covering from the innovator’s stage to the laggard’s stage. It focuses on adoption rates in different regions based on penetration. Furthermore, the household cleaning products market report also includes key purchase criteria and drivers of price sensitivity to help companies evaluate and develop their market growth analysis strategies.
Customer Landscape of Household Cleaning Products Industry
Competitive Landscape
Companies are implementing various strategies, such as strategic alliances, household cleaning products market forecast, partnerships, mergers and acquisitions, geographical expansion, and product/service launches, to enhance their presence in the industry.
3M Co. - The vendor landscape features a portfolio of solutions addressing comprehensive domestic sanitation, from surface disinfection and fabric care to specialized dishwashing and toilet cleaning products.
The industry research and growth report includes detailed analyses of the competitive landscape of the market and information about key companies, including:
- 3M Co.
- Church and Dwight Co. Inc.
- Colgate Palmolive Co.
- Godrej Consumer Ltd.
- Henkel AG and Co. KGaA
- Kao Corp.
- Kimberly Clark Corp.
- LG Household and Health Care Ltd.
- Lion Corp.
- McBride Plc
- Method Products PBC
- Procter and Gamble Co.
- PZ Cussons Plc
- Reckitt Benckiser Group Plc
- S.C. Johnson and Son Inc.
- Seventh Generation Inc.
- The Clorox Co.
- The Honest Co. Inc.
- Unilever PLC
- Werner and Mertz GmbH
Qualitative and quantitative analysis of companies has been conducted to help clients understand the wider business environment as well as the strengths and weaknesses of key industry players. Data is qualitatively analyzed to categorize companies as pure play, category-focused, industry-focused, and diversified; it is quantitatively analyzed to categorize companies as dominant, leading, strong, tentative, and weak.
Recent Development and News in Household cleaning products market
- In August, 2024, Colgate-Palmolive Co. introduced Fabuloso 2X, a concentrated all-purpose cleaner designed with 50% less plastic per dose, supporting sustainability goals without compromising cleaning power.
- In February, 2025, Henkel AG and Co. KGaA announced new concentrated formulas and updated packaging for its all, Persil, and Snuggle liquid laundry lines to improve performance and sustainability.
- In February, 2025, The Clorox Co. unveiled several innovations, including improved-scent Clorox Disinfecting Wipes and Clorox Screen+ Sanitizing Wipes, addressing modern cleaning needs with enhanced fragrance and multi-surface efficacy.
- In April, 2025, Unilever PLC launched Cif Infinite Clean, an all-in-one spray using probiotics and bioscience technology to provide sustained cleaning and freshness for up to 72 hours.
Dive into Technavio’s robust research methodology, blending expert interviews, extensive data synthesis, and validated models for unparalleled Household Cleaning Products Market insights. See full methodology.
| Market Scope | |
|---|---|
| Page number | 303 |
| Base year | 2025 |
| Historic period | 2020-2024 |
| Forecast period | 2026-2030 |
| Growth momentum & CAGR | Accelerate at a CAGR of 4.8% |
| Market growth 2026-2030 | USD 17911.3 million |
| Market structure | Fragmented |
| YoY growth 2025-2026(%) | 4.6% |
| Key countries | China, Japan, India, South Korea, Australia, Indonesia, US, Canada, Mexico, Germany, UK, France, Italy, Spain, The Netherlands, Brazil, Argentina, Chile, Saudi Arabia, UAE, South Africa, Israel and Turkey |
| Competitive landscape | Leading Companies, Market Positioning of Companies, Competitive Strategies, and Industry Risks |
Research Analyst Overview
- The household cleaning products market is undergoing a fundamental realignment, moving beyond basic sanitation to embrace a holistic vision of home wellness and environmental stewardship. This evolution is driven by sophisticated advancements in biotechnology, leading to the widespread adoption of bio-based detergents and specialized antimicrobial agents.
- Boardroom decisions now center on reallocating R&D to develop innovative probiotic-enhanced household cleaning solutions and enzyme-derived cleaners, which offer superior performance without compromising ecological integrity. Formulations featuring biodegradable surfactants and plant-derived surfactants are becoming standard, addressing consumer demand for hypoallergenic formulations. The industry is also tackling waste through circular packaging models, with concentrated liquid refills and water-soluble sachets gaining traction.
- The integration of advanced enzymatic technology in high-efficacy pods and low-foaming high-efficiency surfactants for smart appliances is a key competitive differentiator. For example, investments in developing non-toxic antimicrobial agents have yielded formulations that provide 99.9% effectiveness while being fully biodegradable, showcasing the industry's capacity to innovate in response to both health and environmental pressures.
What are the Key Data Covered in this Household Cleaning Products Market Research and Growth Report?
-
What is the expected growth of the Household Cleaning Products Market between 2026 and 2030?
-
USD 17.91 billion, at a CAGR of 4.8%
-
-
What segmentation does the market report cover?
-
The report is segmented by Product (Surface cleaners, Dishwashing products, Toilet cleaners, and Others), Distribution Channel (Offline, and Online), Price Range (Medium, Low, and High) and Geography (APAC, North America, Europe, South America, Middle East and Africa)
-
-
Which regions are analyzed in the report?
-
APAC, North America, Europe, South America and Middle East and Africa
-
-
What are the key growth drivers and market challenges?
-
Escalating global health consciousness and pathogen awareness, Escalating regulatory rigor and chemical compliance hurdles
-
-
Who are the major players in the Household Cleaning Products Market?
-
3M Co., Church and Dwight Co. Inc., Colgate Palmolive Co., Godrej Consumer Ltd., Henkel AG and Co. KGaA, Kao Corp., Kimberly Clark Corp., LG Household and Health Care Ltd., Lion Corp., McBride Plc, Method Products PBC, Procter and Gamble Co., PZ Cussons Plc, Reckitt Benckiser Group Plc, S.C. Johnson and Son Inc., Seventh Generation Inc., The Clorox Co., The Honest Co. Inc., Unilever PLC and Werner and Mertz GmbH
-
Market Research Insights
- Market dynamics are increasingly governed by a pivot toward sustainability, with consumer preferences compelling a move to eco-friendly formulations and circular economic models. Companies adopting these green chemistry principles report that using sustainable raw materials can reduce dependency on volatile petrochemical markets.
- This shift to biodegradable surfactants and plant-based surfactants has measurable business outcomes, with some brands noting a 15% improvement in consumer loyalty. Furthermore, the integration with smart home technology for automated dishwashing optimization represents a significant opportunity.
- Formulations developed for robotic cleaning compatibility can improve dosing accuracy by over 90%, preventing the overconsumption of chemicals and aligning with mindful resource management goals while enhancing indoor air quality enhancement.
We can help! Our analysts can customize this household cleaning products market research report to meet your requirements.
 RIA -
RIA - 
