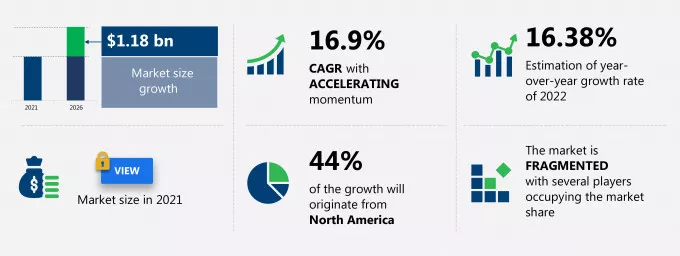
The human organoids market share is expected to increase to USD 1.18 billion from 2021 to 2026, and the market's growth momentum will accelerate at a CAGR of 16.9%.
This human organoids market research report provides valuable insights on the post COVID-19 impact on the market, which will help companies evaluate their business approaches. Furthermore, this report extensively covers human organoids market segmentations by end-user (pharmaceutical and biotechnology companies, contract research organizations, academic and research institutes, and others) and geography (North America, Europe, Asia, and Rest of World (ROW)). The human organoids market report also offers information on several market vendors, including BICO Group AB, BioIVT LLC, Biopredic International, Cellesce Ltd., CN Bio Innovations Ltd., Corning Inc., DefiniGEN Ltd., Emulate Inc., Hubrecht Organoid Technology, InSphero AG, Kirkstall Ltd., Merck KGaA, MIMETAS BV, Miromatrix Medical Inc., Organoid Therapeutics, Organovo Holdings Inc., Pandorum Technologies Pvt. Ltd., STEMCELL Technologies Inc., Thermo Fisher Scientific Inc., and ZenBio Inc. among others.
What will the Human Organoids Market Size be During the Forecast Period?
Download the Free Report Sample to Unlock the Human Organoids Market Size for the Forecast Period and Other Important Statistics
Human Organoids Market: Key Drivers, Trends, and Challenges
The advantages of human organoids over traditional methods is notably driving the human organoids market growth, although factors such as constraints in human organoids models may impede the market growth. Our research analysts have studied the historical data and deduced the key market drivers and the COVID-19 pandemic impact on the human organoids industry. The holistic analysis of the drivers will help in deducing end goals and refining marketing strategies to gain a competitive edge.
Key Human Organoids Market Driver
- The advantages of human organoids over traditional methods is one of the key drivers fueling the human organoids market growth.
- Human organoids require relatively less time and money and offer a high success rate in clinical trials.
- Human organoids retain the 3D structure of the original tissues, which summarizes the genetic and phenotypic heterogeneity of the original tissues.
- Human organoids can be used in screening drugs with high efficiency and sensitivity, guiding clinical precision treatment and personalized treatment.
The above-mentioned advantages will fuel the human organoids market growth during the forecast period.
Key Human Organoids Market Trend
- Mergers and acquisitions, collaborations, and partnerships among vendors is one of the key human organoids market trends supporting the market growth.
- Organoids have become very useful for studying the mechanisms of human diseases and a tool to test patients' responses to therapies in various disorders such as chronic disorders, neurological, and others.
- Organoids are derived from stem cells and grown as a three-dimensional structure, which is capable of self-organizing and replicating features of the original tissues. By focusing initially on disease-linked genetic mutations, researchers plan to identify common causes and potential therapeutic approaches.
- The immense growth opportunities of human organoids in medical research have led vendors to adopt various strategies to gain a competitive edge in the market. For instance, in May 2020, CELLINK, and AstraZeneca, collaborated to provide advanced 3Dbioprinted liver organoids for drug discovery purposes in cardiovascular, renal, and metabolic diseases. This, in turn, will support the market growth during the forecast period.
Key Human Organoids Market Challenge
- Constraints in human organoids models is one of the factors impeding the human organoids market growth.
- 3D cardiac organoids or microtissues which are generated from human PSCs do not contain all the cells present in the adult heart, such as immune cells. These cells play an important role in providing the protective inflammatory responses required for host defenses against infections.
- Degree of maturation for the fabricated 3D cardiac organoids is not sufficient when compared to adult cardiac tissues in terms of morphology, function, and gene expression. This prevents accurate predictions of drug-induced cardiotoxicity.
- The kidney organoids lead to a lack of blood flow, as the kidney is an organ that carries a large amount of blood, and understanding its vascular structure is essential to accurately recapitulate kidney functions.
The aforementioned limitations may impede the market growth during the forecast period.
This human organoids market analysis report also provides detailed information on other upcoming trends and challenges that will have a far-reaching effect on the market growth. The actionable insights on the trends and challenges will help companies evaluate and develop growth strategies for 2022-2026.
Parent Market Analysis
Technavio categorizes the global human organoids market as a part of the global biotechnology market. Our research report has extensively covered external factors influencing the parent market growth potential in the coming years, which will determine the levels of growth of the human organoids market during the forecast period.
Who are the Major Human Organoids Market Vendors?
The report analyzes the market's competitive landscape and offers information on several market vendors, including:
- BICO Group AB
- BioIVT LLC
- Biopredic International
- Cellesce Ltd.
- CN Bio Innovations Ltd.
- Corning Inc.
- DefiniGEN Ltd.
- Emulate Inc.
- Hubrecht Organoid Technology
- InSphero AG
- Kirkstall Ltd.
- Merck KGaA
- MIMETAS BV
- Miromatrix Medical Inc.
- Organoid Therapeutics
- Organovo Holdings Inc.
- Pandorum Technologies Pvt. Ltd.
- STEMCELL Technologies Inc.
- Thermo Fisher Scientific Inc.
- ZenBio Inc.
This statistical study of the human organoids market encompasses successful business strategies deployed by the key vendors. The human organoids market is fragmented and the vendors are deploying organic and inorganic growth strategies to compete in the market.
Product Insights and News
- BioIVT LLC - The company offers human organoids such as fibroblasts, renal cells, non parenchymal cells, and dissociated tumor cells.
- Cellesce Ltd. - The company offers human organoids such as colorectal cancer, breast cancer, and intestinal organoids.
- Corning Inc. - The company offers human organoids such as airway, lung, and mouse intestinal organoids.
To make the most of the opportunities and recover from post COVID-19 impact, market vendors should focus more on the growth prospects in the fast-growing segments, while maintaining their positions in the slow-growing segments.
The human organoids market forecast report offers in-depth insights into key vendor profiles. The profiles include information on the production, sustainability, and prospects of the leading companies.
Human Organoids Market Value Chain Analysis
Our report provides extensive information on the value chain analysis for the human organoids market, which vendors can leverage to gain a competitive advantage during the forecast period. The end-to-end understanding of the value chain is essential in profit margin optimization and evaluation of business strategies. The data available in our value chain analysis segment can help vendors drive costs and enhance customer services during the forecast period.
Which are the Key Regions for Human Organoids Market?
For more insights on the market share of various regions Request for a FREE sample now!
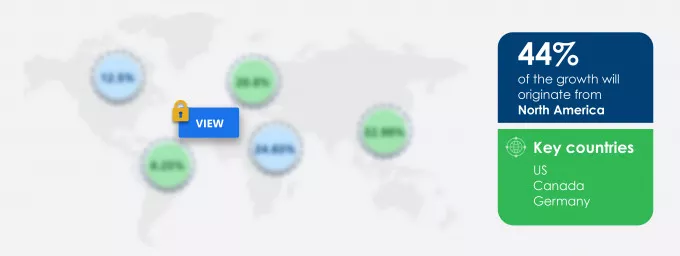
44% of the market's growth will originate from North America during the forecast period. The US and Canada are the key markets for human organoids market in North America. Market growth in this region will be slower than the growth of the market in Asia.
High investment in medical research will facilitate the human organoids market growth in North America over the forecast period. This market research report entails detailed information on the competitive intelligence, marketing gaps, and regional opportunities in store for vendors, which will assist in creating efficient business plans.
COVID Impact and Recovery Analysis
The outbreak of COVID-19 in 2020 led to an increase in neurological disorders in the region since neurologic complications in patients with COVID-19 are more common, which had a positive impact on the regional market. Moreover, the growing R&D activities for infectious diseases such as COVID-19 are deploying human organoids models to better understand the impact of pathogens on different individuals. Thus, it is anticipated that the market in focus will grow positively in the region during the forecast period.
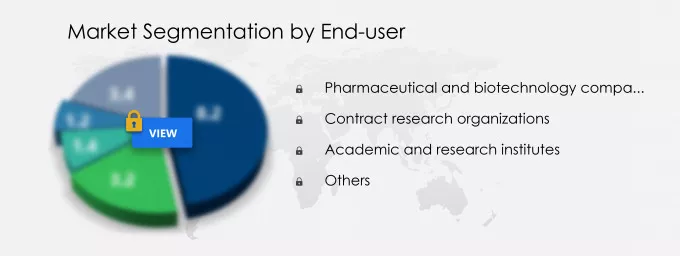
What are the Revenue-generating End-user Segments in the Human Organoids Market?
To gain further insights on the market contribution of various segments Request for a FREE sample
The human organoids market share growth by the pharmaceutical and biotechnology companies segment will be significant during the forecast period. Pharmaceutical and biotechnology companies are developing organoid technology, which ensures an alternative to preclinical drug testing. They are also currently used for personalized medicine to modulate disease treatment, such as cancer, as they are uniquely identifiable to each patient genetic makeup. Such factors of pharmaceutical and biotechnology companies will drive the market growth during the forecast period.
This report provides an accurate prediction of the contribution of all the segments to the growth of the human organoids market size and actionable market insights on post COVID-19 impact on each segment.
|
Human Organoids Market Scope
|
|
Report Coverage
|
Details
|
|
Page number
|
120
|
|
Base year
|
2021
|
|
Forecast period
|
2022-2026
|
|
Growth momentum & CAGR
|
Accelerate at a CAGR of 16.9%
|
|
Market growth 2022-2026
|
$ 1.18 billion
|
|
Market structure
|
Fragmented
|
|
YoY growth (%)
|
16.38
|
|
Regional analysis
|
North America, Europe, Asia, and Rest of World (ROW)
|
|
Performing market contribution
|
North America at 44%
|
|
Key consumer countries
|
US, Canada, Germany, UK, and China
|
|
Competitive landscape
|
Leading companies, Competitive strategies, Consumer engagement scope
|
|
Key companies profiled
|
BICO Group AB, BioIVT LLC, Biopredic International, Cellesce Ltd., CN Bio Innovations Ltd., Corning Inc., DefiniGEN Ltd., Emulate Inc., Hubrecht Organoid Technology, InSphero AG, Kirkstall Ltd., Merck KGaA, MIMETAS BV, Miromatrix Medical Inc., Organoid Therapeutics, Organovo Holdings Inc., Pandorum Technologies Pvt. Ltd., STEMCELL Technologies Inc., Thermo Fisher Scientific Inc., and ZenBio Inc.
|
|
Market dynamics
|
Parent market analysis, Market growth inducers and obstacles, Fast-growing and slow-growing segment analysis, COVID 19 impact and recovery analysis and future consumer dynamics, Market condition analysis for forecast period
|
|
Customization purview
|
If our report has not included the data that you are looking for, you can reach out to our analysts and get segments customized.
|
Request for a FREE sample
What are the Key Data Covered in this Human Organoids Market Report?
- CAGR of the market during the forecast period 2022-2026
- Detailed information on factors that will drive human organoids market growth during the next five years
- Precise estimation of the human organoids market size and its contribution to the parent market
- Accurate predictions on upcoming trends and changes in consumer behavior
- The growth of the human organoids industry across North America, Europe, Asia, and Rest of World (ROW)
- A thorough analysis of the market's competitive landscape and detailed information on vendors
- Comprehensive details of factors that will challenge the growth of human organoids market vendors
We can help! Our analysts can customize this report to meet your requirements. Get in touch
1 Executive Summary
- 1.1 Market overview
- Exhibit 01: Executive Summary – Chart on Market Overview
- Exhibit 02: Executive Summary – Data Table on Market Overview
- Exhibit 03: Executive Summary – Chart on Global Market Characteristics
- Exhibit 04: Executive Summary – Chart on Market by Geography
- Exhibit 05: Executive Summary – Chart on Market Segmentation by End-user
- Exhibit 06: Executive Summary – Chart on Incremental Growth
- Exhibit 07: Executive Summary – Data Table on Incremental Growth
- Exhibit 08: Executive Summary – Chart on Vendor Market Positioning
2 Market Landscape
- 2.1 Market ecosystem
- Exhibit 09: Parent market
- Exhibit 10: Market Characteristics
3 Market Sizing
- 3.1 Market definition
- Exhibit 11: Offerings of vendors included in the market definition
- 3.2 Market segment analysis
- Exhibit 12: Market segments
- 3.4 Market outlook: Forecast for 2021-2026
- Exhibit 13: Chart on Global - Market size and forecast 2021-2026 ($ million)
- Exhibit 14: Data Table on Global - Market size and forecast 2021-2026 ($ million)
- Exhibit 15: Chart on Global Market: Year-over-year growth 2021-2026 (%)
- Exhibit 16: Data Table on Global Market: Year-over-year growth 2021-2026 (%)
4 Five Forces Analysis
- 4.1 Five forces summary
- Exhibit 17: Five forces analysis - Comparison between 2021 and 2026
- 4.2 Bargaining power of buyers
- Exhibit 18: Chart on Bargaining power of buyers – Impact of key factors 2021 and 2026
- 4.3 Bargaining power of suppliers
- Exhibit 19: Bargaining power of suppliers – Impact of key factors in 2021 and 2026
- 4.4 Threat of new entrants
- Exhibit 20: Threat of new entrants – Impact of key factors in 2021 and 2026
- 4.5 Threat of substitutes
- Exhibit 21: Threat of substitutes – Impact of key factors in 2021 and 2026
- 4.6 Threat of rivalry
- Exhibit 22: Threat of rivalry – Impact of key factors in 2021 and 2026
- 4.7 Market condition
- Exhibit 23: Chart on Market condition - Five forces 2021 and 2026
5 Market Segmentation by End-user
- 5.1 Market segments
- Exhibit 24: Chart on End-user - Market share 2021-2026 (%)
- Exhibit 25: Data Table on End-user - Market share 2021-2026 (%)
- 5.2 Comparison by End-user
- Exhibit 26: Chart on Comparison by End-user
- Exhibit 27: Data Table on Comparison by End-user
- 5.3 Pharmaceutical and biotechnology companies - Market size and forecast 2021-2026
- Exhibit 28: Chart on Pharmaceutical and biotechnology companies - Market size and forecast 2021-2026 ($ million)
- Exhibit 29: Data Table on Pharmaceutical and biotechnology companies - Market size and forecast 2021-2026 ($ million)
- Exhibit 30: Chart on Pharmaceutical and biotechnology companies - Year-over-year growth 2021-2026 (%)
- Exhibit 31: Data Table on Pharmaceutical and biotechnology companies - Year-over-year growth 2021-2026 (%)
- 5.4 Contract research organizations - Market size and forecast 2021-2026
- Exhibit 32: Chart on Contract research organizations - Market size and forecast 2021-2026 ($ million)
- Exhibit 33: Data Table on Contract research organizations - Market size and forecast 2021-2026 ($ million)
- Exhibit 34: Chart on Contract research organizations - Year-over-year growth 2021-2026 (%)
- Exhibit 35: Data Table on Contract research organizations - Year-over-year growth 2021-2026 (%)
- 5.5 Academic and research institutes - Market size and forecast 2021-2026
- Exhibit 36: Chart on Academic and research institutes - Market size and forecast 2021-2026 ($ million)
- Exhibit 37: Data Table on Academic and research institutes - Market size and forecast 2021-2026 ($ million)
- Exhibit 38: Chart on Academic and research institutes - Year-over-year growth 2021-2026 (%)
- Exhibit 39: Data Table on Academic and research institutes - Year-over-year growth 2021-2026 (%)
- 5.6 Others - Market size and forecast 2021-2026
- Exhibit 40: Chart on Others - Market size and forecast 2021-2026 ($ million)
- Exhibit 41: Data Table on Others - Market size and forecast 2021-2026 ($ million)
- Exhibit 42: Chart on Others - Year-over-year growth 2021-2026 (%)
- Exhibit 43: Data Table on Others - Year-over-year growth 2021-2026 (%)
- 5.7 Market opportunity by End-user
- Exhibit 44: Market opportunity by End-user ($ million)
6 Customer Landscape
- 6.1 Customer landscape overview
- Exhibit 45: Analysis of price sensitivity, lifecycle, customer purchase basket, adoption rates, and purchase criteria
7 Geographic Landscape
- 7.1 Geographic segmentation
- Exhibit 46: Chart on Market share by geography 2021-2026 (%)
- Exhibit 47: Data Table on Market share by geography 2021-2026 (%)
- 7.2 Geographic comparison
- Exhibit 48: Chart on Geographic comparison
- Exhibit 49: Data Table on Geographic comparison
- 7.3 North America - Market size and forecast 2021-2026
- Exhibit 50: Chart on North America - Market size and forecast 2021-2026 ($ million)
- Exhibit 51: Data Table on North America - Market size and forecast 2021-2026 ($ million)
- Exhibit 52: Chart on North America - Year-over-year growth 2021-2026 (%)
- Exhibit 53: Data Table on North America - Year-over-year growth 2021-2026 (%)
- 7.4 Europe - Market size and forecast 2021-2026
- Exhibit 54: Chart on Europe - Market size and forecast 2021-2026 ($ million)
- Exhibit 55: Data Table on Europe - Market size and forecast 2021-2026 ($ million)
- Exhibit 56: Chart on Europe - Year-over-year growth 2021-2026 (%)
- Exhibit 57: Data Table on Europe - Year-over-year growth 2021-2026 (%)
- 7.5 Asia - Market size and forecast 2021-2026
- Exhibit 58: Chart on Asia - Market size and forecast 2021-2026 ($ million)
- Exhibit 59: Data Table on Asia - Market size and forecast 2021-2026 ($ million)
- Exhibit 60: Chart on Asia - Year-over-year growth 2021-2026 (%)
- Exhibit 61: Data Table on Asia - Year-over-year growth 2021-2026 (%)
- 7.6 Rest of World (ROW) - Market size and forecast 2021-2026
- Exhibit 62: Chart on Rest of World (ROW) - Market size and forecast 2021-2026 ($ million)
- Exhibit 63: Data Table on Rest of World (ROW) - Market size and forecast 2021-2026 ($ million)
- Exhibit 64: Chart on Rest of World (ROW) - Year-over-year growth 2021-2026 (%)
- Exhibit 65: Data Table on Rest of World (ROW) - Year-over-year growth 2021-2026 (%)
- 7.7 US - Market size and forecast 2021-2026
- Exhibit 66: Chart on US - Market size and forecast 2021-2026 ($ million)
- Exhibit 67: Data Table on US - Market size and forecast 2021-2026 ($ million)
- Exhibit 68: Chart on US - Year-over-year growth 2021-2026 (%)
- Exhibit 69: Data Table on US - Year-over-year growth 2021-2026 (%)
- 7.8 Germany - Market size and forecast 2021-2026
- Exhibit 70: Chart on Germany - Market size and forecast 2021-2026 ($ million)
- Exhibit 71: Data Table on Germany - Market size and forecast 2021-2026 ($ million)
- Exhibit 72: Chart on Germany - Year-over-year growth 2021-2026 (%)
- Exhibit 73: Data Table on Germany - Year-over-year growth 2021-2026 (%)
- 7.9 UK - Market size and forecast 2021-2026
- Exhibit 74: Chart on UK - Market size and forecast 2021-2026 ($ million)
- Exhibit 75: Data Table on UK - Market size and forecast 2021-2026 ($ million)
- Exhibit 76: Chart on UK - Year-over-year growth 2021-2026 (%)
- Exhibit 77: Data Table on UK - Year-over-year growth 2021-2026 (%)
- 7.10 Canada - Market size and forecast 2021-2026
- Exhibit 78: Chart on Canada - Market size and forecast 2021-2026 ($ million)
- Exhibit 79: Data Table on Canada - Market size and forecast 2021-2026 ($ million)
- Exhibit 80: Chart on Canada - Year-over-year growth 2021-2026 (%)
- Exhibit 81: Data Table on Canada - Year-over-year growth 2021-2026 (%)
- 7.11 China - Market size and forecast 2021-2026
- Exhibit 82: Chart on China - Market size and forecast 2021-2026 ($ million)
- Exhibit 83: Data Table on China - Market size and forecast 2021-2026 ($ million)
- Exhibit 84: Chart on China - Year-over-year growth 2021-2026 (%)
- Exhibit 85: Data Table on China - Year-over-year growth 2021-2026 (%)
- 7.12 Market opportunity by geography
- Exhibit 86: Market opportunity by geography ($ million)
8 Drivers, Challenges, and Trends
- 8.3 Impact of drivers and challenges
- Exhibit 87: Impact of drivers and challenges in 2021 and 2026
9 Vendor Landscape
- 9.2 Vendor landscape
- Exhibit 88: Overview on Criticality of inputs and Factors of differentiation
- 9.3 Landscape disruption
- Exhibit 89: Overview on factors of disruption
- 9.4 Industry risks
- Exhibit 90: Impact of key risks on business
10 Vendor Analysis
- 10.1 Vendors covered
- Exhibit 91: Vendors covered
- 10.2 Market positioning of vendors
- Exhibit 92: Matrix on vendor position and classification
- 10.3 BioIVT LLC
- Exhibit 93: BioIVT LLC - Overview
- Exhibit 94: BioIVT LLC - Product / Service
- Exhibit 95: BioIVT LLC - Key news
- Exhibit 96: BioIVT LLC - Key offerings
- 10.4 Cellesce Ltd.
- Exhibit 97: Cellesce Ltd. - Overview
- Exhibit 98: Cellesce Ltd. - Product / Service
- Exhibit 99: Cellesce Ltd. - Key offerings
- 10.5 Corning Inc.
- Exhibit 100: Corning Inc. - Overview
- Exhibit 101: Corning Inc. - Business segments
- Exhibit 102: Corning Inc. - Key offerings
- Exhibit 103: Corning Inc. - Segment focus
- 10.6 DefiniGEN Ltd.
- Exhibit 104: DefiniGEN Ltd. - Overview
- Exhibit 105: DefiniGEN Ltd. - Product / Service
- Exhibit 106: DefiniGEN Ltd. - Key offerings
- 10.7 Emulate Inc.
- Exhibit 107: Emulate Inc. - Overview
- Exhibit 108: Emulate Inc. - Product / Service
- Exhibit 109: Emulate Inc. - Key offerings
- 10.8 Hubrecht Organoid Technology
- Exhibit 110: Hubrecht Organoid Technology - Overview
- Exhibit 111: Hubrecht Organoid Technology - Product / Service
- Exhibit 112: Hubrecht Organoid Technology - Key offerings
- 10.9 Merck KGaA
- Exhibit 113: Merck KGaA - Overview
- Exhibit 114: Merck KGaA - Business segments
- Exhibit 115: Merck KGaA - Key news
- Exhibit 116: Merck KGaA - Key offerings
- Exhibit 117: Merck KGaA - Segment focus
- 10.10 Organoid Therapeutics
- Exhibit 118: Organoid Therapeutics - Overview
- Exhibit 119: Organoid Therapeutics - Product / Service
- Exhibit 120: Organoid Therapeutics - Key offerings
- 10.11 STEMCELL Technologies Inc.
- Exhibit 121: STEMCELL Technologies Inc. - Overview
- Exhibit 122: STEMCELL Technologies Inc. - Product / Service
- Exhibit 123: STEMCELL Technologies Inc. - Key offerings
- 10.12 ZenBio Inc.
- Exhibit 124: ZenBio Inc. - Overview
- Exhibit 125: ZenBio Inc. - Product / Service
- Exhibit 126: ZenBio Inc. - Key offerings
11 Appendix
- 11.2 Inclusions and exclusions checklist
- Exhibit 127: Inclusions checklist
- Exhibit 128: Exclusions checklist
- 11.3 Currency conversion rates for US$
- Exhibit 129: Currency conversion rates for US$
- 11.4 Research methodology
- Exhibit 130: Research methodology
- Exhibit 131: Validation techniques employed for market sizing
- Exhibit 132: Information sources
- 11.5 List of abbreviations
- Exhibit 133: List of abbreviations
- investments in R and D by biotechnology firms and federal agencies: Biotechnology companies and research organizations are investing significantly in R and D activities to develop new technologies to improve the quality and standards of their products. They are investing in proteomics, drug testing, high-throughput screening, combinational chemistry, and the development of highly innovative environment-friendly biotechnology reagents. Increased R and D has led to improved healthcare access in the US, countries in Europe, as well as in emerging markets such as China and India, which drives the demand for biotechnology reagents.


