Hybrid Vehicle Market Analysis, Size, and Forecast 2025-2029: APAC (China, Japan, and India), North America (US, Canada, and Mexico), Europe (Germany, UK, and France), Middle East and Africa (UAE, Saudi Arabia, and South Africa), South America (Brazil and Argentina), and Rest of World (ROW)

Hybrid Vehicle Market Analysis, Size, and Forecast 2025-2029:
APAC (China, Japan, and India), North America (US, Canada, and Mexico), Europe (Germany, UK, and France), Middle East and Africa (UAE, Saudi Arabia, and South Africa), South America (Brazil and Argentina), and Rest of World (ROW)

Published: Dec 2025 294 Pages SKU: IRTNTR73400

Market Overview at a Glance

$1440.2 B
Market Opportunity
35%
CAGR 2024 - 2029
48.5%
APAC Growth
$228.8 B
Passenger cars segment 2023

Hybrid Vehicle Market Size 2025-2029

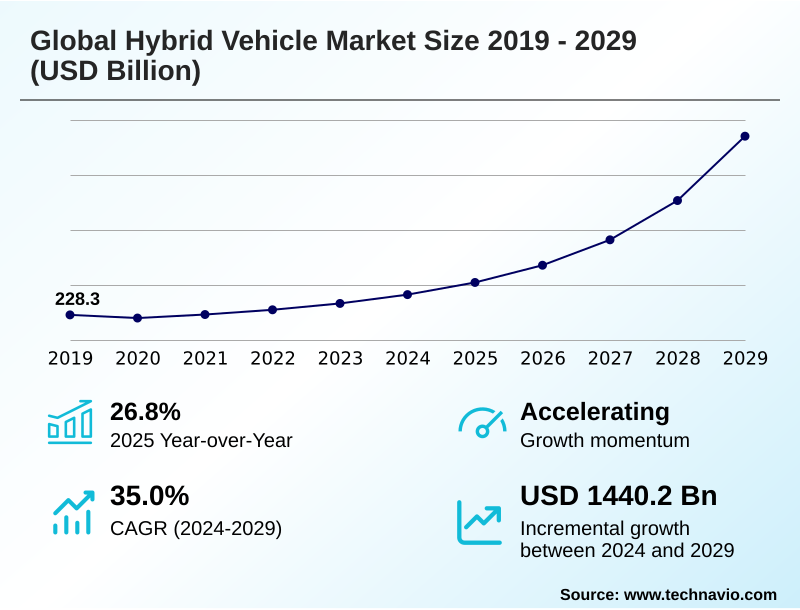
The hybrid vehicle market size is valued to increase by USD 1440.2 billion, at a CAGR of 35% from 2024 to 2029. Stringent emission control will drive the hybrid vehicle market.

Major Market Trends & Insights

  • APAC dominated the market and accounted for a 48.5% growth during the forecast period.
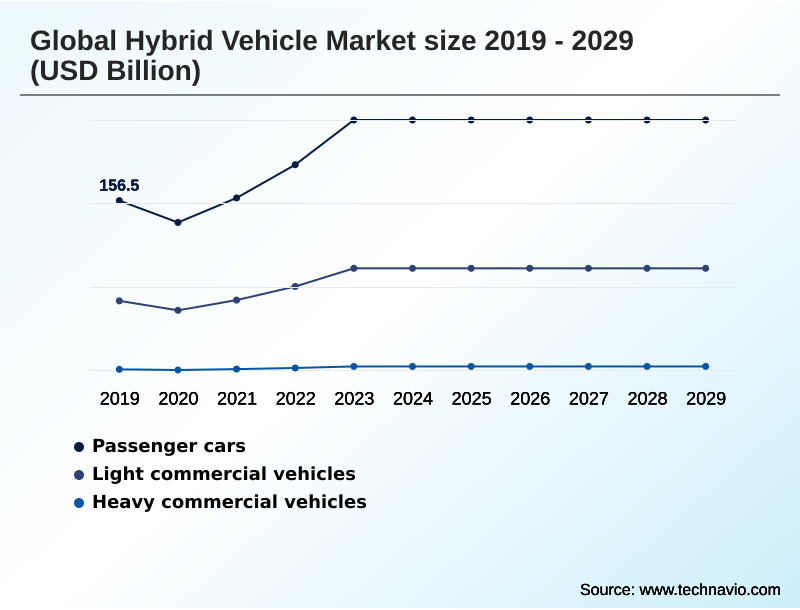
  • By Vehicle Type - Passenger cars segment was valued at USD 228.8 billion in 2023
  • By Component - Battery segment accounted for the largest market revenue share in 2023

Market Size & Forecast

  • Market Opportunities: USD 1624.5 billion
  • Market Future Opportunities: USD 1440.2 billion
  • CAGR from 2024 to 2029 : 35%

Market Summary

  • The hybrid vehicle market is undergoing sustained expansion, driven by a confluence of stringent environmental regulations and evolving consumer preferences for fuel-efficient transportation. This growth is not merely a transition toward full electrification but a strategic positioning of hybrid technology as a long-term, practical solution.
  • Key drivers include tightening emissions standards, which necessitate the adoption of cleaner powertrains, and the rising popularity of green vehicles among eco-conscious buyers. Innovations in lithium-ion battery technology and electric motor efficiency are enhancing performance and range, making hybrids more competitive.
  • For instance, a logistics company can leverage a fleet of hybrid commercial vehicles to significantly reduce operational fuel costs and meet corporate sustainability targets, all while navigating the challenges of a still-developing phev charging infrastructure. However, the market faces competition from the growing demand for pure battery electric vehicles (BEVs).
  • To maintain momentum, manufacturers are focusing on hybrid powertrain optimization and integrating features like advanced regenerative braking system and predictive energy management software, which further improve real-world efficiency and strengthen the value proposition for both consumers and fleet operators. This strategic focus ensures hybrids remain a relevant and vital part of the automotive landscape.

What will be the Size of the Hybrid Vehicle Market during the forecast period?

Get Key Insights on Market Forecast (PDF) Request Free Sample

How is the Hybrid Vehicle Market Segmented?

The hybrid vehicle industry research report provides comprehensive data (region-wise segment analysis), with forecasts and estimates in "USD billion" for the period 2025-2029, as well as historical data from 2019-2023 for the following segments.

  • Vehicle type
    • Passenger cars
    • Light commercial vehicles
    • Heavy commercial vehicles
  • Component
    • Battery
    • Electric motor
    • Transmission
    • Others
  • Powertrain type
    • Parallel hybrid
    • Power-split hybrid
    • Series hybrid
  • Geography
    • APAC
      • China
      • Japan
      • India
    • North America
      • US
      • Canada
      • Mexico
    • Europe
      • Germany
      • UK
      • France
    • Middle East and Africa
      • UAE
      • Saudi Arabia
      • South Africa
    • South America
      • Brazil
      • Argentina
    • Rest of World (ROW)

By Vehicle Type Insights

The passenger cars segment is estimated to witness significant growth during the forecast period.

The passenger car segment is pivotal, driven by stringent emission norms and incentives promoting adoption. The market has seen significant uptake, with sales in the US increasing by 53% in one year.

This reflects a growing consumer shift towards vehicles offering balanced efficiency. Manufacturers are responding by integrating advanced technologies, including sophisticated battery management system (bms) and effective energy recovery system designs.

The demand for better hybrid suv fuel economy and compact hybrid vehicle design is shaping product development.

Innovations in lithium-ion battery technology and the refinement of the internal combustion engine (ice) are critical for meeting consumer expectations and regulatory requirements like the corporate average fuel economy (cafe) standards, while optimizing hybrid powertrain optimization.

Request Free Sample

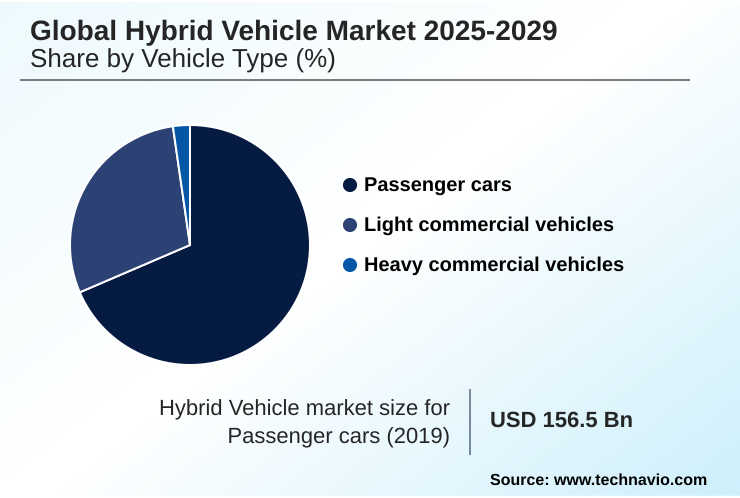
The Passenger cars segment was valued at USD 228.8 billion in 2023 and showed a gradual increase during the forecast period.

Request Free Sample

Regional Analysis

APAC is estimated to contribute 48.5% to the growth of the global market during the forecast period.Technavio’s analysts have elaborately explained the regional trends and drivers that shape the market during the forecast period.

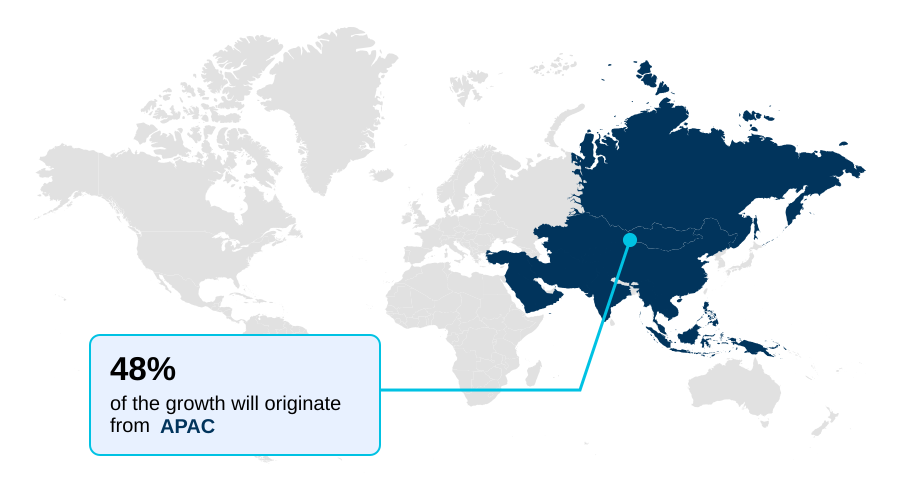
See How Hybrid Vehicle Market Demand is Rising in APAC Request Free Sample

The market's geographic distribution shows distinct regional preferences and growth patterns. APAC is set to contribute nearly 48.5% of the market’s incremental growth, driven by government policies and high consumer demand in countries like China and Japan.

In North America, the focus is on larger vehicles, with significant R&D in hybrid suv fuel economy and commercial hybrid truck payload capacity.

European markets, expanding at a rate of 36.8%, emphasize plug-in hybrid electric vehicle (PHEV) models to meet stringent CO2 targets.

Across all regions, technology adoption is key; the power-split hybrid powertrain remains a popular architecture, and advancements in regenerative braking system effectiveness and overall electric motor efficiency are universal goals.

Emerging technologies like vehicle-to-grid (v2g) capability and the integration of advanced driver-assistance systems (adas) with hybrid powertrain optimization software and its eco-driving mode algorithm are creating new value propositions for consumers, with the parallel hybrid system and continuously variable transmission (cvt) remaining foundational.

Market Dynamics

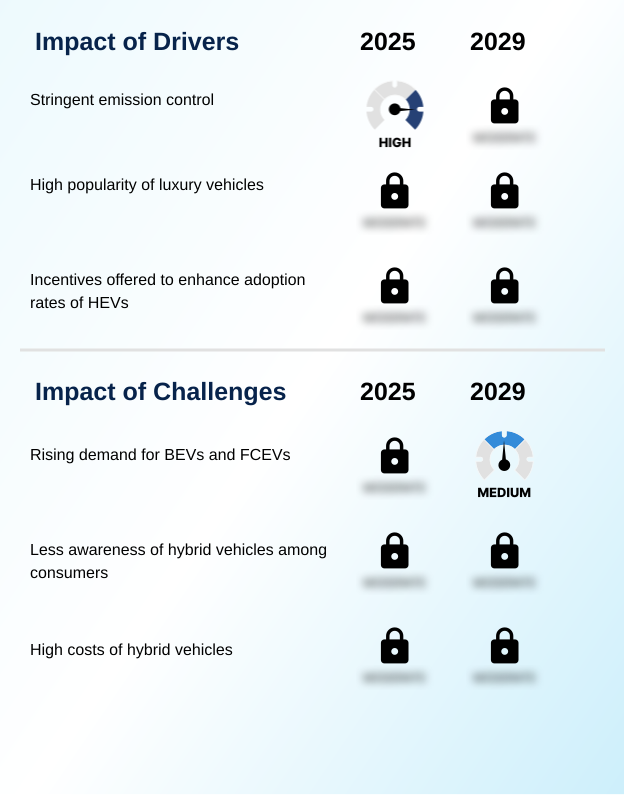
Our researchers analyzed the data with 2024 as the base year, along with the key drivers, trends, and challenges. A holistic analysis of drivers will help companies refine their marketing strategies to gain a competitive advantage.

  • Strategic decision-making in the hybrid vehicle sector requires a deep, granular understanding of complex engineering trade-offs and evolving technological pathways. For example, comparing parallel vs series hybrid efficiency is fundamental to platform development, directly influencing a vehicle's performance profile and cost. The impact of battery size on phev range is another critical consideration, dictating consumer utility and vehicle pricing.
  • In urban environments, optimizing regenerative braking for urban driving can yield significant efficiency gains. A key area of innovation is integrating adas with hybrid powertrain controls to create smoother, more predictive performance. Concurrently, effective thermal management for high-performance hybrids is essential for ensuring battery longevity and safety.
  • A rigorous cost-benefit analysis of fhev vs mhev informs portfolio strategy for mass-market segments, while understanding the role of cvt in power-split hybrids is crucial for optimizing drivetrain performance. Looking forward, advancements in solid-state battery for hybrids promise a leap in energy density.
  • The core mission of reducing emissions with advanced hybrid technology remains paramount, alongside efforts in improving fuel economy in heavy-duty hybrids. From a circular economy perspective, addressing the challenges in recycling hybrid vehicle batteries is a growing priority. OEMs are leveraging software updates for hybrid energy management to enhance vehicle performance over time.
  • The process of designing lightweight hybrid vehicle frames helps offset battery weight. Fleet operators are exploring v2g implementation in phev fleets, while manufacturers focus on delivering superior nvh solutions for silent hybrid operation.
  • Evaluating the long-term reliability of hybrid transmissions and the impact of cafe standards on hybrid design are crucial for risk management, with some firms reporting a 25% reduction in compliance-related redesign costs through early simulation.
  • Finally, strategic planning must consider hybrid system integration in commercial vehicles, the role of predictive maintenance for hybrid components, and the long-term future of fuel cell hybrid vehicles.

What are the key market drivers leading to the rise in the adoption of Hybrid Vehicle Industry?

  • Stringent emission control regulations are a key driver stimulating growth within the hybrid vehicle market.

  • Stringent emission regulations globally serve as a primary catalyst for the market. Governments are enforcing strict standards, compelling OEMs to accelerate development in emissions control technology.
  • This has spurred innovation in the plug-in hybrid electric vehicle (phev) segment, which benefits from regulatory credits and consumer incentives. Advanced components like the dual-clutch transmission (dct) and efficient on-board charger (obc) are becoming standard, improving both performance and convenience.
  • Even the mild hybrid electric vehicle (mhev) segment is expanding as a cost-effective compliance solution, reducing fleet-wide emissions by up to 15%.
  • This regulatory push also impacts engineering choices, such as the implementation of an all-wheel drive hybrid system and the development of next-generation battery chemistry and ultracapacitor energy storage to meet future targets while maintaining a high hybrid vehicle residual value.

What are the market trends shaping the Hybrid Vehicle Industry?

  • The rising adoption of green vehicles emerges as a prominent market trend. This shift is fueled by increasing environmental awareness among consumers and supportive government incentives.

  • Consumers and governments are prioritizing sustainability, driving a preference for green vehicles. The full hybrid electric vehicle (fhev) is a popular choice, with its efficiency further enhanced by advanced powertrain control module logic. Innovations in high-voltage battery pack technology are improving energy management and addressing cold weather hybrid performance issues, which previously deterred some buyers.
  • This trend also supports new urban mobility hybrid solutions, which reduce both congestion and pollution. As adoption grows, so does the focus on the vehicle lifecycle, including lowering hybrid vehicle maintenance costs and establishing a viable battery recycling process.
  • OEMs are deploying hybrid system software updates to improve performance over time, with some exploring range-extended electric vehicle (reev) variants to bridge the gap to full electrification, improving consumer confidence by over 25%.

What challenges does the Hybrid Vehicle Industry face during its growth?

  • The rising demand for battery electric vehicles (BEVs) and fuel cell electric vehicles (FCEVs) presents a key challenge affecting the industry's growth.

  • The increasing consumer and regulatory preference for zero-emission vehicles, particularly BEVs and the emerging fuel cell hybrid vehicle (fchv), presents a significant challenge. This shift diverts R&D investment away from hybrid-specific advancements like in-wheel motor technology. While the overall trend is toward drivetrain electrification, the market is bifurcating, forcing hybrid models to compete on cost and convenience.
  • Issues such as hybrid vehicle battery degradation over time and the still-developing phev charging infrastructure can make BEVs seem like a more future-proof option. To remain competitive, hybrid manufacturers must improve efficiency through advanced thermal management system designs and predictive energy management software, which can enhance fuel economy by 10%.
  • Using lightweight composite materials is also crucial to offset battery weight and boost the appeal of models like those targeting the luxury hybrid sedan performance segment.

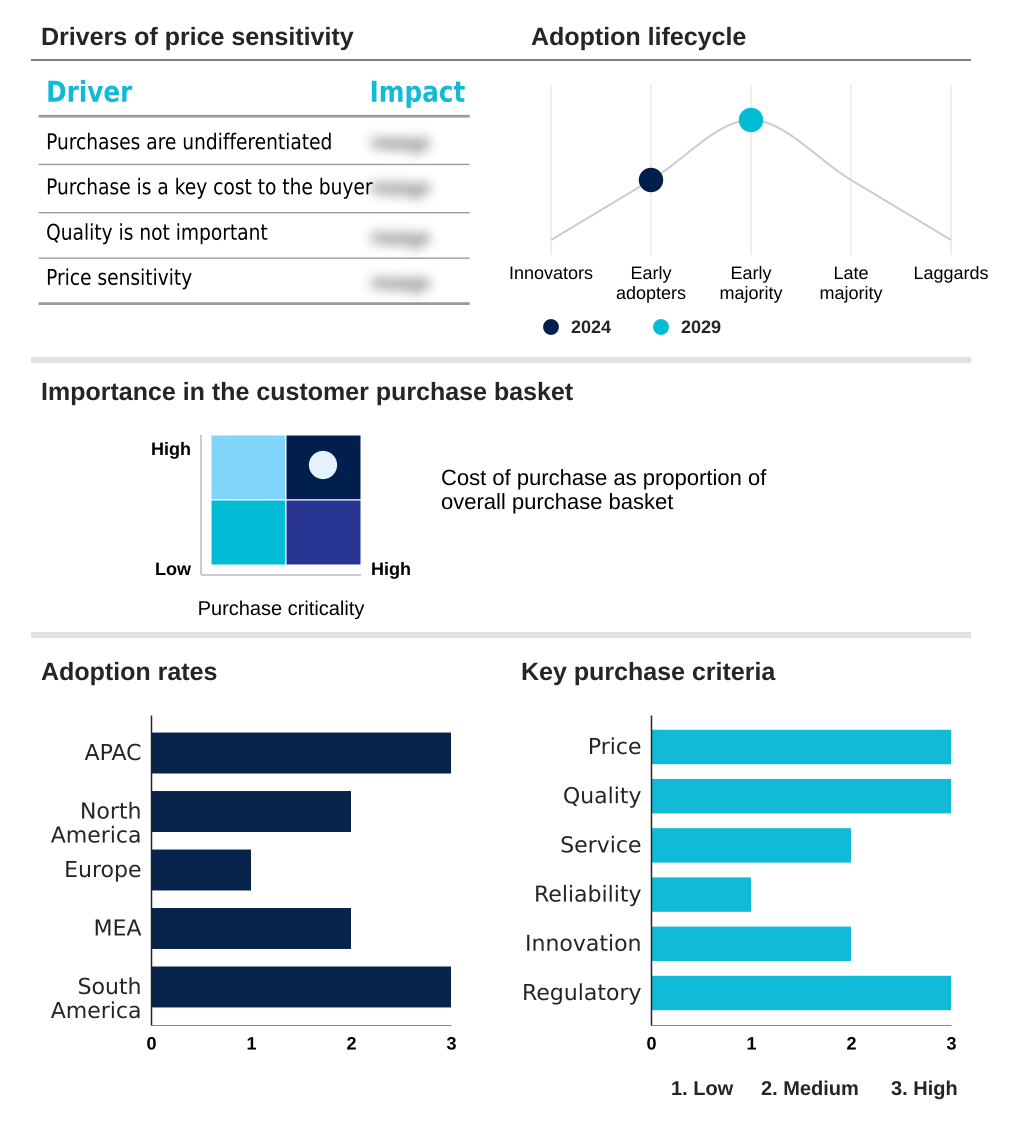
Exclusive Technavio Analysis on Customer Landscape

The hybrid vehicle market forecasting report includes the adoption lifecycle of the market, covering from the innovator’s stage to the laggard’s stage. It focuses on adoption rates in different regions based on penetration. Furthermore, the hybrid vehicle market report also includes key purchase criteria and drivers of price sensitivity to help companies evaluate and develop their market growth analysis strategies.

Customer Landscape of Hybrid Vehicle Industry

Competitive Landscape

Companies are implementing various strategies, such as strategic alliances, hybrid vehicle market forecast, partnerships, mergers and acquisitions, geographical expansion, and product/service launches, to enhance their presence in the industry.

Bayerische Motoren Werke AG - Key offerings range from mild and full hybrid electric vehicles to advanced plug-in hybrids, addressing diverse demands for fuel efficiency, performance, and reduced emissions.

The industry research and growth report includes detailed analyses of the competitive landscape of the market and information about key companies, including:

  • Bayerische Motoren Werke AG
  • BYD Co. Ltd.
  • Chery Automobile Co. Ltd.
  • Ford Motor Co.
  • General Motors Co.
  • Honda Motor Co. Ltd.
  • Hyundai Motor Co.
  • KIA CORP.
  • Mazda Motor Corp.
  • Mercedes Benz Group AG
  • Mitsubishi Motors Corp.
  • Nissan Motor Co. Ltd.
  • Renault SAS
  • SAIC Motor Corp. Ltd.
  • Stellantis NV
  • Suzuki Motor Corp.
  • Toyota Motor Corp.
  • Volkswagen AG
  • Volvo Car Corp.

Qualitative and quantitative analysis of companies has been conducted to help clients understand the wider business environment as well as the strengths and weaknesses of key industry players. Data is qualitatively analyzed to categorize companies as pure play, category-focused, industry-focused, and diversified; it is quantitatively analyzed to categorize companies as dominant, leading, strong, tentative, and weak.

Recent Development and News in Hybrid vehicle market

  • In December 2024, Toyota Motor Corp. announced the launch of its next-generation power-split hybrid powertrain, delivering a 15% improvement in fuel efficiency across its sedan lineup.
  • In January 2025, Volkswagen AG and a leading battery technology firm entered a strategic partnership to co-develop solid-state batteries for their upcoming plug-in hybrid electric vehicle (PHEV) platforms.
  • In April 2025, Ford Motor Co. revealed a significant investment to expand its North American production capacity for hybrid trucks and SUVs, responding to rising consumer demand and stricter emissions regulations.
  • In September 2024, Hyundai Motor Co. unveiled its new e-system with an advanced eco-driving mode algorithm, designed to optimize energy recovery in urban driving conditions by over 10%.

Dive into Technavio’s robust research methodology, blending expert interviews, extensive data synthesis, and validated models for unparalleled Hybrid Vehicle Market insights. See full methodology.

Market Scope
Page number 294
Base year 2024
Historic period 2019-2023
Forecast period 2025-2029
Growth momentum & CAGR Accelerate at a CAGR of 35%
Market growth 2025-2029 USD 1440.2 billion
Market structure Fragmented
YoY growth 2024-2025(%) 26.8%
Key countries China, Japan, India, South Korea, Thailand, Indonesia, US, Canada, Mexico, Germany, UK, France, Italy, Spain, The Netherlands, UAE, Saudi Arabia, South Africa, Egypt, Israel, Brazil, Argentina and Chile
Competitive landscape Leading Companies, Market Positioning of Companies, Competitive Strategies, and Industry Risks

Request Free Sample

Research Analyst Overview

  • The hybrid vehicle market is defined by a rapid convergence of powertrain innovation and stringent regulatory pressures. The evolution from the mild hybrid electric vehicle (mhev) to the full hybrid electric vehicle (fhev) and advanced plug-in hybrid electric vehicle (phev) showcases a commitment to drivetrain electrification.
  • At the core, the internal combustion engine (ice) is now paired with systems featuring high electric motor efficiency and advanced emissions control technology to meet corporate average fuel economy (cafe) standards. Key components driving this shift include lithium-ion battery technology managed by a sophisticated battery management system (bms) and the high-voltage battery pack, supported by an on-board charger (obc).
  • Powertrain configurations like the parallel hybrid system and power-split hybrid powertrain, often paired with a continuously variable transmission (cvt) or dual-clutch transmission (dct), are optimized by the powertrain control module. Innovations in in-wheel motor technology and the regenerative braking system, a key part of the energy recovery system, are crucial.
  • Boardroom decisions now hinge on adopting these technologies; firms investing in advanced thermal management system designs have reported a 15% improvement in battery pack longevity. The integration of advanced driver-assistance systems (adas), the potential of vehicle-to-grid (v2g) capability, and even the niche exploration of the fuel cell hybrid vehicle (fchv) highlight the market's multifaceted nature.

What are the Key Data Covered in this Hybrid Vehicle Market Research and Growth Report?

  • What is the expected growth of the Hybrid Vehicle Market between 2025 and 2029?

    • USD 1440.2 billion, at a CAGR of 35%

  • What segmentation does the market report cover?

    • The report is segmented by Vehicle Type (Passenger cars, Light commercial vehicles, Heavy commercial vehicles), Component (Battery, Electric motor, Transmission, Others), Powertrain Type (Parallel hybrid, Power-split hybrid, Series hybrid) and Geography (APAC, North America, Europe, Middle East and Africa, South America)

  • Which regions are analyzed in the report?

    • APAC, North America, Europe, Middle East and Africa and South America

  • What are the key growth drivers and market challenges?

    • Stringent emission control, Rising demand for BEVs and FCEVs

  • Who are the major players in the Hybrid Vehicle Market?

    • Bayerische Motoren Werke AG, BYD Co. Ltd., Chery Automobile Co. Ltd., Ford Motor Co., General Motors Co., Honda Motor Co. Ltd., Hyundai Motor Co., KIA CORP., Mazda Motor Corp., Mercedes Benz Group AG, Mitsubishi Motors Corp., Nissan Motor Co. Ltd., Renault SAS, SAIC Motor Corp. Ltd., Stellantis NV, Suzuki Motor Corp., Toyota Motor Corp., Volkswagen AG and Volvo Car Corp.

Market Research Insights

  • The market's dynamism is underscored by strategic shifts in OEM portfolios and rapid technological advancements. The challenge of hybrid vehicle battery degradation is being met with next-generation battery chemistry, which promises lifecycle improvements of over 20% compared to previous generations.
  • In response to consumer demand, automakers are focusing on luxury hybrid sedan performance and hybrid suv fuel economy, creating vehicles that offer both power and efficiency. The growing network of phev charging infrastructure is boosting plug-in model adoption by 30% in key urban areas.
  • Furthermore, hybrid system software updates are becoming a key differentiator, allowing for continuous hybrid powertrain optimization and improving efficiency post-purchase. This focus on the entire ownership experience, from performance to hybrid vehicle maintenance costs, is critical for maintaining competitiveness against pure BEV alternatives.

We can help! Our analysts can customize this hybrid vehicle market research report to meet your requirements.

Get in touch

1. Executive Summary

1.1 Market overview

Executive Summary - Chart on Market Overview
Executive Summary - Data Table on Market Overview
Executive Summary - Chart on Global Market Characteristics
Executive Summary - Chart on Market by Geography
Executive Summary - Chart on Market Segmentation by Vehicle Type
Executive Summary - Chart on Market Segmentation by Component
Executive Summary - Chart on Market Segmentation by Powertrain Type
Executive Summary - Chart on Incremental Growth
Executive Summary - Data Table on Incremental Growth
Executive Summary - Chart on Company Market Positioning

2. Technavio Analysis

2.1 Analysis of price sensitivity, lifecycle, customer purchase basket, adoption rates, and purchase criteria

2.2 Criticality of inputs and Factors of differentiation

Chart on Overview on criticality of inputs and factors of differentiation

2.3 Factors of disruption

Chart on Overview on factors of disruption

2.4 Impact of drivers and challenges

Chart on Impact of drivers and challenges in 2024 and 2029

3. Market Landscape

3.1 Market ecosystem

Chart on Parent Market
Data Table on - Parent Market

3.2 Market characteristics

Chart on Market characteristics analysis

3.3 Value chain analysis

Chart on Value chain analysis

4. Market Sizing

4.1 Market definition

Data Table on Offerings of companies included in the market definition

4.2 Market segment analysis

Market segments

4.3 Market size 2024

4.4 Market outlook: Forecast for 2024-2029

Chart on Global - Market size and forecast 2024-2029 ($ billion)
Data Table on Global - Market size and forecast 2024-2029 ($ billion)
Chart on Global Market: Year-over-year growth 2024-2029 (%)
Data Table on Global Market: Year-over-year growth 2024-2029 (%)

5. Historic Market Size

5.1 Global Hybrid Vehicle Market 2019 - 2023

Historic Market Size - Data Table on Global Hybrid Vehicle Market 2019 - 2023 ($ billion)

5.2 Vehicle Type segment analysis 2019 - 2023

Historic Market Size - Vehicle Type Segment 2019 - 2023 ($ billion)

5.3 Component segment analysis 2019 - 2023

Historic Market Size - Component Segment 2019 - 2023 ($ billion)

5.4 Powertrain Type segment analysis 2019 - 2023

Historic Market Size - Powertrain Type Segment 2019 - 2023 ($ billion)

5.5 Geography segment analysis 2019 - 2023

Historic Market Size - Geography Segment 2019 - 2023 ($ billion)

5.6 Country segment analysis 2019 - 2023

Historic Market Size - Country Segment 2019 - 2023 ($ billion)

6. Qualitative Analysis

6.1 The AI impact on Global Hybrid Vehicle Market

7. Five Forces Analysis

7.1 Five forces summary

Five forces analysis - Comparison between 2024 and 2029

7.2 Bargaining power of buyers

Bargaining power of buyers - Impact of key factors 2024 and 2029

7.3 Bargaining power of suppliers

Bargaining power of suppliers - Impact of key factors in 2024 and 2029

7.4 Threat of new entrants

Threat of new entrants - Impact of key factors in 2024 and 2029

7.5 Threat of substitutes

Threat of substitutes - Impact of key factors in 2024 and 2029

7.6 Threat of rivalry

Threat of rivalry - Impact of key factors in 2024 and 2029

7.7 Market condition

Chart on Market condition - Five forces 2024 and 2029

8. Market Segmentation by Vehicle Type

8.1 Market segments

Chart on Vehicle Type - Market share 2024-2029 (%)
Data Table on Vehicle Type - Market share 2024-2029 (%)

8.2 Comparison by Vehicle Type

Chart on Comparison by Vehicle Type
Data Table on Comparison by Vehicle Type

8.3 Passenger cars - Market size and forecast 2024-2029

Chart on Passenger cars - Market size and forecast 2024-2029 ($ billion)
Data Table on Passenger cars - Market size and forecast 2024-2029 ($ billion)
Chart on Passenger cars - Year-over-year growth 2024-2029 (%)
Data Table on Passenger cars - Year-over-year growth 2024-2029 (%)

8.4 Light commercial vehicles - Market size and forecast 2024-2029

Chart on Light commercial vehicles - Market size and forecast 2024-2029 ($ billion)
Data Table on Light commercial vehicles - Market size and forecast 2024-2029 ($ billion)
Chart on Light commercial vehicles - Year-over-year growth 2024-2029 (%)
Data Table on Light commercial vehicles - Year-over-year growth 2024-2029 (%)

8.5 Heavy commercial vehicles - Market size and forecast 2024-2029

Chart on Heavy commercial vehicles - Market size and forecast 2024-2029 ($ billion)
Data Table on Heavy commercial vehicles - Market size and forecast 2024-2029 ($ billion)
Chart on Heavy commercial vehicles - Year-over-year growth 2024-2029 (%)
Data Table on Heavy commercial vehicles - Year-over-year growth 2024-2029 (%)

8.6 Market opportunity by Vehicle Type

Market opportunity by Vehicle Type ($ billion)
Data Table on Market opportunity by Vehicle Type ($ billion)

9. Market Segmentation by Component

9.1 Market segments

Chart on Component - Market share 2024-2029 (%)
Data Table on Component - Market share 2024-2029 (%)

9.2 Comparison by Component

Chart on Comparison by Component
Data Table on Comparison by Component

9.3 Battery - Market size and forecast 2024-2029

Chart on Battery - Market size and forecast 2024-2029 ($ billion)
Data Table on Battery - Market size and forecast 2024-2029 ($ billion)
Chart on Battery - Year-over-year growth 2024-2029 (%)
Data Table on Battery - Year-over-year growth 2024-2029 (%)

9.4 Electric motor - Market size and forecast 2024-2029

Chart on Electric motor - Market size and forecast 2024-2029 ($ billion)
Data Table on Electric motor - Market size and forecast 2024-2029 ($ billion)
Chart on Electric motor - Year-over-year growth 2024-2029 (%)
Data Table on Electric motor - Year-over-year growth 2024-2029 (%)

9.5 Transmission - Market size and forecast 2024-2029

Chart on Transmission - Market size and forecast 2024-2029 ($ billion)
Data Table on Transmission - Market size and forecast 2024-2029 ($ billion)
Chart on Transmission - Year-over-year growth 2024-2029 (%)
Data Table on Transmission - Year-over-year growth 2024-2029 (%)

9.6 Others - Market size and forecast 2024-2029

Chart on Others - Market size and forecast 2024-2029 ($ billion)
Data Table on Others - Market size and forecast 2024-2029 ($ billion)
Chart on Others - Year-over-year growth 2024-2029 (%)
Data Table on Others - Year-over-year growth 2024-2029 (%)

9.7 Market opportunity by Component

Market opportunity by Component ($ billion)
Data Table on Market opportunity by Component ($ billion)

10. Market Segmentation by Powertrain Type

10.1 Market segments

Chart on Powertrain Type - Market share 2024-2029 (%)
Data Table on Powertrain Type - Market share 2024-2029 (%)

10.2 Comparison by Powertrain Type

Chart on Comparison by Powertrain Type
Data Table on Comparison by Powertrain Type

10.3 Parallel hybrid - Market size and forecast 2024-2029

Chart on Parallel hybrid - Market size and forecast 2024-2029 ($ billion)
Data Table on Parallel hybrid - Market size and forecast 2024-2029 ($ billion)
Chart on Parallel hybrid - Year-over-year growth 2024-2029 (%)
Data Table on Parallel hybrid - Year-over-year growth 2024-2029 (%)

10.4 Power-split hybrid - Market size and forecast 2024-2029

Chart on Power-split hybrid - Market size and forecast 2024-2029 ($ billion)
Data Table on Power-split hybrid - Market size and forecast 2024-2029 ($ billion)
Chart on Power-split hybrid - Year-over-year growth 2024-2029 (%)
Data Table on Power-split hybrid - Year-over-year growth 2024-2029 (%)

10.5 Series hybrid - Market size and forecast 2024-2029

Chart on Series hybrid - Market size and forecast 2024-2029 ($ billion)
Data Table on Series hybrid - Market size and forecast 2024-2029 ($ billion)
Chart on Series hybrid - Year-over-year growth 2024-2029 (%)
Data Table on Series hybrid - Year-over-year growth 2024-2029 (%)

10.6 Market opportunity by Powertrain Type

Market opportunity by Powertrain Type ($ billion)
Data Table on Market opportunity by Powertrain Type ($ billion)

11. Customer Landscape

11.1 Customer landscape overview

Analysis of price sensitivity, lifecycle, customer purchase basket, adoption rates, and purchase criteria

12. Geographic Landscape

12.1 Geographic segmentation

Chart on Market share by geography 2024-2029 (%)
Data Table on Market share by geography 2024-2029 (%)

12.2 Geographic comparison

Chart on Geographic comparison
Data Table on Geographic comparison

12.3 APAC - Market size and forecast 2024-2029

Chart on APAC - Market size and forecast 2024-2029 ($ billion)
Data Table on APAC - Market size and forecast 2024-2029 ($ billion)
Chart on APAC - Year-over-year growth 2024-2029 (%)
Data Table on APAC - Year-over-year growth 2024-2029 (%)
Chart on Regional Comparison - APAC
Data Table on Regional Comparison - APAC

12.3.1 China - Market size and forecast 2024-2029

Chart on China - Market size and forecast 2024-2029 ($ billion)
Data Table on China - Market size and forecast 2024-2029 ($ billion)
Chart on China - Year-over-year growth 2024-2029 (%)
Data Table on China - Year-over-year growth 2024-2029 (%)

12.3.2 Japan - Market size and forecast 2024-2029

Chart on Japan - Market size and forecast 2024-2029 ($ billion)
Data Table on Japan - Market size and forecast 2024-2029 ($ billion)
Chart on Japan - Year-over-year growth 2024-2029 (%)
Data Table on Japan - Year-over-year growth 2024-2029 (%)

12.3.3 India - Market size and forecast 2024-2029

Chart on India - Market size and forecast 2024-2029 ($ billion)
Data Table on India - Market size and forecast 2024-2029 ($ billion)
Chart on India - Year-over-year growth 2024-2029 (%)
Data Table on India - Year-over-year growth 2024-2029 (%)

12.3.4 South Korea - Market size and forecast 2024-2029

Chart on South Korea - Market size and forecast 2024-2029 ($ billion)
Data Table on South Korea - Market size and forecast 2024-2029 ($ billion)
Chart on South Korea - Year-over-year growth 2024-2029 (%)
Data Table on South Korea - Year-over-year growth 2024-2029 (%)

12.3.5 Thailand - Market size and forecast 2024-2029

Chart on Thailand - Market size and forecast 2024-2029 ($ billion)
Data Table on Thailand - Market size and forecast 2024-2029 ($ billion)
Chart on Thailand - Year-over-year growth 2024-2029 (%)
Data Table on Thailand - Year-over-year growth 2024-2029 (%)

12.3.6 Indonesia - Market size and forecast 2024-2029

Chart on Indonesia - Market size and forecast 2024-2029 ($ billion)
Data Table on Indonesia - Market size and forecast 2024-2029 ($ billion)
Chart on Indonesia - Year-over-year growth 2024-2029 (%)
Data Table on Indonesia - Year-over-year growth 2024-2029 (%)

12.4 North America - Market size and forecast 2024-2029

Chart on North America - Market size and forecast 2024-2029 ($ billion)
Data Table on North America - Market size and forecast 2024-2029 ($ billion)
Chart on North America - Year-over-year growth 2024-2029 (%)
Data Table on North America - Year-over-year growth 2024-2029 (%)
Chart on Regional Comparison - North America
Data Table on Regional Comparison - North America

12.4.1 US - Market size and forecast 2024-2029

Chart on US - Market size and forecast 2024-2029 ($ billion)
Data Table on US - Market size and forecast 2024-2029 ($ billion)
Chart on US - Year-over-year growth 2024-2029 (%)
Data Table on US - Year-over-year growth 2024-2029 (%)

12.4.2 Canada - Market size and forecast 2024-2029

Chart on Canada - Market size and forecast 2024-2029 ($ billion)
Data Table on Canada - Market size and forecast 2024-2029 ($ billion)
Chart on Canada - Year-over-year growth 2024-2029 (%)
Data Table on Canada - Year-over-year growth 2024-2029 (%)

12.4.3 Mexico - Market size and forecast 2024-2029

Chart on Mexico - Market size and forecast 2024-2029 ($ billion)
Data Table on Mexico - Market size and forecast 2024-2029 ($ billion)
Chart on Mexico - Year-over-year growth 2024-2029 (%)
Data Table on Mexico - Year-over-year growth 2024-2029 (%)

12.5 Europe - Market size and forecast 2024-2029

Chart on Europe - Market size and forecast 2024-2029 ($ billion)
Data Table on Europe - Market size and forecast 2024-2029 ($ billion)
Chart on Europe - Year-over-year growth 2024-2029 (%)
Data Table on Europe - Year-over-year growth 2024-2029 (%)
Chart on Regional Comparison - Europe
Data Table on Regional Comparison - Europe

12.5.1 Germany - Market size and forecast 2024-2029

Chart on Germany - Market size and forecast 2024-2029 ($ billion)
Data Table on Germany - Market size and forecast 2024-2029 ($ billion)
Chart on Germany - Year-over-year growth 2024-2029 (%)
Data Table on Germany - Year-over-year growth 2024-2029 (%)

12.5.2 UK - Market size and forecast 2024-2029

Chart on UK - Market size and forecast 2024-2029 ($ billion)
Data Table on UK - Market size and forecast 2024-2029 ($ billion)
Chart on UK - Year-over-year growth 2024-2029 (%)
Data Table on UK - Year-over-year growth 2024-2029 (%)

12.5.3 France - Market size and forecast 2024-2029

Chart on France - Market size and forecast 2024-2029 ($ billion)
Data Table on France - Market size and forecast 2024-2029 ($ billion)
Chart on France - Year-over-year growth 2024-2029 (%)
Data Table on France - Year-over-year growth 2024-2029 (%)

12.5.4 Italy - Market size and forecast 2024-2029

Chart on Italy - Market size and forecast 2024-2029 ($ billion)
Data Table on Italy - Market size and forecast 2024-2029 ($ billion)
Chart on Italy - Year-over-year growth 2024-2029 (%)
Data Table on Italy - Year-over-year growth 2024-2029 (%)

12.5.5 Spain - Market size and forecast 2024-2029

Chart on Spain - Market size and forecast 2024-2029 ($ billion)
Data Table on Spain - Market size and forecast 2024-2029 ($ billion)
Chart on Spain - Year-over-year growth 2024-2029 (%)
Data Table on Spain - Year-over-year growth 2024-2029 (%)

12.5.6 The Netherlands - Market size and forecast 2024-2029

Chart on The Netherlands - Market size and forecast 2024-2029 ($ billion)
Data Table on The Netherlands - Market size and forecast 2024-2029 ($ billion)
Chart on The Netherlands - Year-over-year growth 2024-2029 (%)
Data Table on The Netherlands - Year-over-year growth 2024-2029 (%)

12.6 Middle East and Africa - Market size and forecast 2024-2029

Chart on Middle East and Africa - Market size and forecast 2024-2029 ($ billion)
Data Table on Middle East and Africa - Market size and forecast 2024-2029 ($ billion)
Chart on Middle East and Africa - Year-over-year growth 2024-2029 (%)
Data Table on Middle East and Africa - Year-over-year growth 2024-2029 (%)
Chart on Regional Comparison - Middle East and Africa
Data Table on Regional Comparison - Middle East and Africa

12.6.1 UAE - Market size and forecast 2024-2029

Chart on UAE - Market size and forecast 2024-2029 ($ billion)
Data Table on UAE - Market size and forecast 2024-2029 ($ billion)
Chart on UAE - Year-over-year growth 2024-2029 (%)
Data Table on UAE - Year-over-year growth 2024-2029 (%)

12.6.2 Saudi Arabia - Market size and forecast 2024-2029

Chart on Saudi Arabia - Market size and forecast 2024-2029 ($ billion)
Data Table on Saudi Arabia - Market size and forecast 2024-2029 ($ billion)
Chart on Saudi Arabia - Year-over-year growth 2024-2029 (%)
Data Table on Saudi Arabia - Year-over-year growth 2024-2029 (%)

12.6.3 South Africa - Market size and forecast 2024-2029

Chart on South Africa - Market size and forecast 2024-2029 ($ billion)
Data Table on South Africa - Market size and forecast 2024-2029 ($ billion)
Chart on South Africa - Year-over-year growth 2024-2029 (%)
Data Table on South Africa - Year-over-year growth 2024-2029 (%)

12.6.4 Egypt - Market size and forecast 2024-2029

Chart on Egypt - Market size and forecast 2024-2029 ($ billion)
Data Table on Egypt - Market size and forecast 2024-2029 ($ billion)
Chart on Egypt - Year-over-year growth 2024-2029 (%)
Data Table on Egypt - Year-over-year growth 2024-2029 (%)

12.6.5 Israel - Market size and forecast 2024-2029

Chart on Israel - Market size and forecast 2024-2029 ($ billion)
Data Table on Israel - Market size and forecast 2024-2029 ($ billion)
Chart on Israel - Year-over-year growth 2024-2029 (%)
Data Table on Israel - Year-over-year growth 2024-2029 (%)

12.7 South America - Market size and forecast 2024-2029

Chart on South America - Market size and forecast 2024-2029 ($ billion)
Data Table on South America - Market size and forecast 2024-2029 ($ billion)
Chart on South America - Year-over-year growth 2024-2029 (%)
Data Table on South America - Year-over-year growth 2024-2029 (%)
Chart on Regional Comparison - South America
Data Table on Regional Comparison - South America

12.7.1 Brazil - Market size and forecast 2024-2029

Chart on Brazil - Market size and forecast 2024-2029 ($ billion)
Data Table on Brazil - Market size and forecast 2024-2029 ($ billion)
Chart on Brazil - Year-over-year growth 2024-2029 (%)
Data Table on Brazil - Year-over-year growth 2024-2029 (%)

12.7.2 Argentina - Market size and forecast 2024-2029

Chart on Argentina - Market size and forecast 2024-2029 ($ billion)
Data Table on Argentina - Market size and forecast 2024-2029 ($ billion)
Chart on Argentina - Year-over-year growth 2024-2029 (%)
Data Table on Argentina - Year-over-year growth 2024-2029 (%)

12.7.3 Chile - Market size and forecast 2024-2029

Chart on Chile - Market size and forecast 2024-2029 ($ billion)
Data Table on Chile - Market size and forecast 2024-2029 ($ billion)
Chart on Chile - Year-over-year growth 2024-2029 (%)
Data Table on Chile - Year-over-year growth 2024-2029 (%)

12.8 Market opportunity by geography

Market opportunity by geography ($ billion)
Data Tables on Market opportunity by geography ($ billion)

13. Drivers, Challenges, and Opportunity

13.1 Market drivers

Stringent emission control
High popularity of luxury vehicles
Incentives offered to enhance adoption rates of HEVs

13.2 Market challenges

Rising demand for BEVs and FCEVs
Less awareness of hybrid vehicles among consumers
High costs of hybrid vehicles

13.3 Impact of drivers and challenges

Impact of drivers and challenges in 2024 and 2029

13.4 Market opportunities

Rising adoption of green vehicles
Rising demand for lightweight vehicles
Recent developments in hybrid vehicles

14. Competitive Landscape

14.1 Overview

14.2

Overview on criticality of inputs and factors of differentiation

14.3 Landscape disruption

Overview on factors of disruption

14.4 Industry risks

Impact of key risks on business

15. Competitive Analysis

15.1 Companies profiled

Companies covered

15.2 Company ranking index

15.3 Market positioning of companies

Matrix on companies position and classification

15.4 Bayerische Motoren Werke AG

Bayerische Motoren Werke AG - Overview
Bayerische Motoren Werke AG - Business segments
Bayerische Motoren Werke AG - Key offerings
Bayerische Motoren Werke AG - Segment focus
SWOT

15.5 Chery Automobile Co. Ltd.

Chery Automobile Co. Ltd. - Overview
Chery Automobile Co. Ltd. - Product / Service
Chery Automobile Co. Ltd. - Key offerings
SWOT

15.6 Ford Motor Co.

Ford Motor Co. - Overview
Ford Motor Co. - Business segments
Ford Motor Co. - Key offerings
Ford Motor Co. - Segment focus
SWOT

15.7 General Motors Co.

General Motors Co. - Overview
General Motors Co. - Business segments
General Motors Co. - Key news
General Motors Co. - Key offerings
General Motors Co. - Segment focus
SWOT

15.8 Honda Motor Co. Ltd.

Honda Motor Co. Ltd. - Overview
Honda Motor Co. Ltd. - Business segments
Honda Motor Co. Ltd. - Key news
Honda Motor Co. Ltd. - Key offerings
Honda Motor Co. Ltd. - Segment focus
SWOT

15.9 Hyundai Motor Co.

Hyundai Motor Co. - Overview
Hyundai Motor Co. - Business segments
Hyundai Motor Co. - Key news
Hyundai Motor Co. - Key offerings
Hyundai Motor Co. - Segment focus
SWOT

15.10 KIA CORP.

KIA CORP. - Overview
KIA CORP. - Product / Service
KIA CORP. - Key offerings
SWOT

15.11 Mazda Motor Corp.

Mazda Motor Corp. - Overview
Mazda Motor Corp. - Business segments
Mazda Motor Corp. - Key offerings
Mazda Motor Corp. - Segment focus
SWOT

15.12 Mercedes Benz Group AG

Mercedes Benz Group AG - Overview
Mercedes Benz Group AG - Product / Service
Mercedes Benz Group AG - Key offerings
SWOT

15.13 Mitsubishi Motors Corp.

Mitsubishi Motors Corp. - Overview
Mitsubishi Motors Corp. - Business segments
Mitsubishi Motors Corp. - Key news
Mitsubishi Motors Corp. - Key offerings
Mitsubishi Motors Corp. - Segment focus
SWOT

15.14 Nissan Motor Co. Ltd.

Nissan Motor Co. Ltd. - Overview
Nissan Motor Co. Ltd. - Business segments
Nissan Motor Co. Ltd. - Key news
Nissan Motor Co. Ltd. - Key offerings
Nissan Motor Co. Ltd. - Segment focus
SWOT

15.15 SAIC Motor Corp. Ltd.

SAIC Motor Corp. Ltd. - Overview
SAIC Motor Corp. Ltd. - Business segments
SAIC Motor Corp. Ltd. - Key offerings
SAIC Motor Corp. Ltd. - Segment focus
SWOT

15.16 Toyota Motor Corp.

Toyota Motor Corp. - Overview
Toyota Motor Corp. - Business segments
Toyota Motor Corp. - Key news
Toyota Motor Corp. - Key offerings
Toyota Motor Corp. - Segment focus
SWOT

15.17 Volkswagen AG

Volkswagen AG - Overview
Volkswagen AG - Business segments
Volkswagen AG - Key news
Volkswagen AG - Key offerings
Volkswagen AG - Segment focus
SWOT

15.18 Volvo Car Corp.

Volvo Car Corp. - Overview
Volvo Car Corp. - Product / Service
Volvo Car Corp. - Key offerings
SWOT

16. Appendix

16.1 Scope of the report

Market definition
Objectives
Notes and caveats

16.2 Inclusions and exclusions checklist

Inclusions checklist
Exclusions checklist

16.3 Currency conversion rates for US$

16.4 Research methodology

16.5 Data procurement

Information sources

16.6 Data validation

16.7 Validation techniques employed for market sizing

16.8 Data synthesis

16.9 360 degree market analysis

16.10 List of abbreviations

Research Methodology

Technavio presents a detailed picture of the market by way of study, synthesis, and summation of data from multiple sources. The analysts have presented the various facets of the market with a particular focus on identifying the key industry influencers. The data thus presented is comprehensive, reliable, and the result of extensive research, both primary and secondary.

INFORMATION SOURCES

Primary sources

  • Manufacturers and suppliers
  • Channel partners
  • Industry experts
  • Strategic decision makers

Secondary sources

  • Industry journals and periodicals
  • Government data
  • Financial reports of key industry players
  • Historical data
  • Press releases

DATA ANALYSIS

Data Synthesis

  • Collation of data
  • Estimation of key figures
  • Analysis of derived insights

Data Validation

  • Triangulation with data models
  • Reference against proprietary databases
  • Corroboration with industry experts

REPORT WRITING

Qualitative

  • Market drivers
  • Market challenges
  • Market trends
  • Five forces analysis

Quantitative

  • Market size and forecast
  • Market segmentation
  • Geographical insights
  • Competitive landscape

Interested in this report?

Get your sample now to see our research methodology and insights!

Download Now

Frequently Asked Questions

Hybrid Vehicle market growth will increase by USD 1440.2 billion during 2025-2029 .

The Hybrid Vehicle market is expected to grow at a CAGR of 35% during 2025-2029 .

Hybrid Vehicle market is segmented by Vehicle type (Passenger cars, Light commercial vehicles, Heavy commercial vehicles) Component (Battery, Electric motor, Transmission, Others) Powertrain type (Parallel hybrid, Power-split hybrid, Series hybrid)

Bayerische Motoren Werke AG, BYD Co. Ltd., Chery Automobile Co. Ltd., Ford Motor Co., General Motors Co., Honda Motor Co. Ltd., Hyundai Motor Co., KIA CORP., Mazda Motor Corp., Mercedes Benz Group AG, Mitsubishi Motors Corp., Nissan Motor Co. Ltd., Renault SAS, SAIC Motor Corp. Ltd., Stellantis NV, Suzuki Motor Corp., Toyota Motor Corp., Volkswagen AG, Volvo Car Corp. are a few of the key vendors in the Hybrid Vehicle market.

APAC will register the highest growth rate of 48.5% among the other regions. Therefore, the Hybrid Vehicle market in APAC is expected to garner significant business opportunities for the vendors during the forecast period.

China, Japan, India, South Korea, Thailand, Indonesia, US, Canada, Mexico, Germany, UK, France, Italy, Spain, The Netherlands, UAE, Saudi Arabia, South Africa, Egypt, Israel, Brazil, Argentina, Chile

  • Stringent emission control is the driving factor this market.

The Hybrid Vehicle market vendors should focus on grabbing business opportunities from the Vehicle type segment as it accounted for the largest market share in the base year.