Hydrogen Pipeline Monitoring Systems Market Size and Growth Forecast 2026-2030
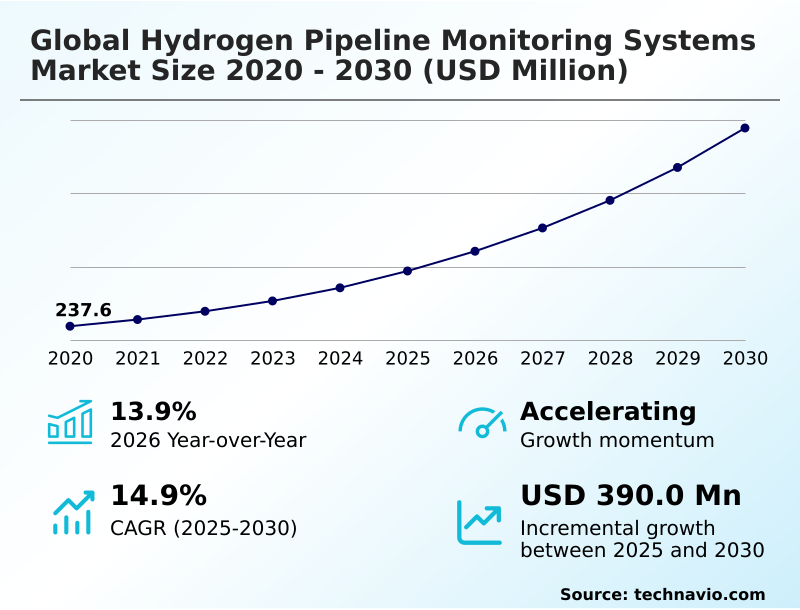
The Hydrogen Pipeline Monitoring Systems Market size was valued at USD 388.2 million in 2025 growing at a CAGR of 14.9% during the forecast period 2026-2030.
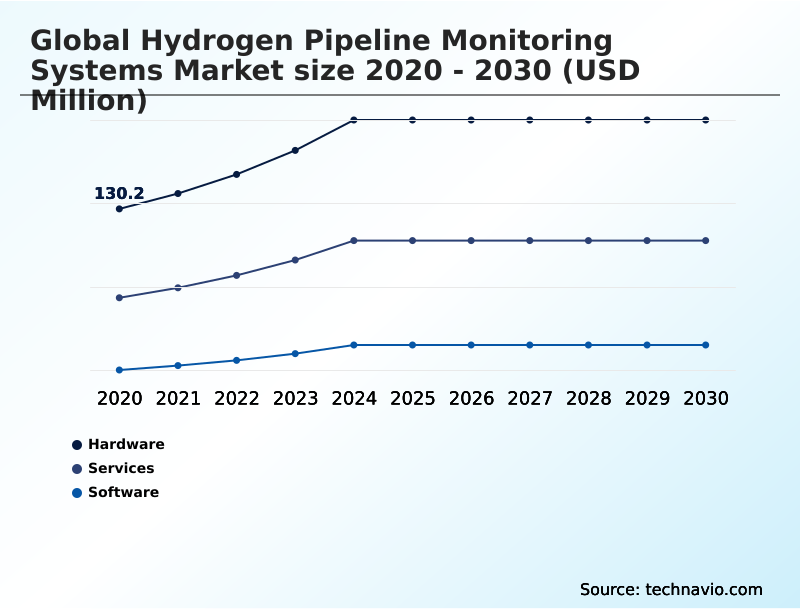
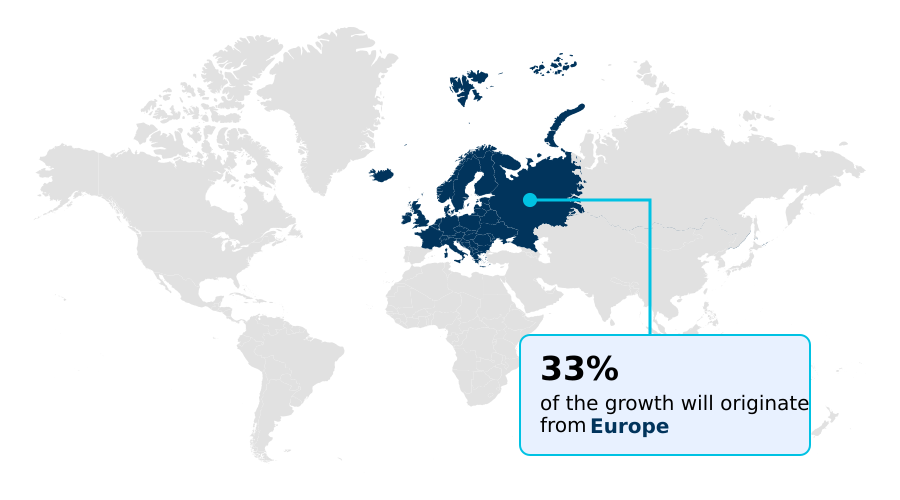
Europe accounts for 33% of incremental growth during the forecast period. The Hardware segment by Component was valued at USD 184.6 million in 2024, while the Fiber optic segment holds the largest revenue share by Technology.
The market is projected to grow by USD 540.6 million from 2020 to 2030, with USD 390 million of the growth expected during the forecast period of 2025 to 2030.
Get Key Insights on Market Forecast (PDF) Request Free Sample
Hydrogen Pipeline Monitoring Systems Market Overview
The hydrogen pipeline monitoring systems market is defined by the urgent need for operational safety and regulatory compliance in transporting a highly volatile energy carrier. The market is projected to see year-over-year growth of 13.9%, driven by massive investments in energy transition infrastructure. Operators of repurposed natural gas pipelines, for instance, are compelled to deploy advanced surveillance technologies to manage the risks of hydrogen embrittlement. A typical scenario involves a utility company retrofitting a legacy steel pipeline with a distributed acoustic sensing system; by analyzing the acoustic signatures along the line, the operator can detect microscopic leaks and third-party intrusion in real time, preventing catastrophic failures and ensuring compliance with stringent safety protocols. This shift from periodic inspection to continuous, data-driven oversight, utilizing tools like digital twin technology and predictive maintenance algorithms, is fundamental. The adoption of such systems is no longer a choice but a necessity for maintaining a license to operate within the burgeoning green hydrogen transport economy, where asset integrity management is directly linked to public safety and commercial viability.
Drivers, Trends, and Challenges in the Hydrogen Pipeline Monitoring Systems Market
The strategic deployment of monitoring systems for repurposed gas pipelines is a central theme, as operators balance the cost of hydrogen pipeline monitoring systems against the risks of structural failure. The technical hurdles, particularly addressing challenges in monitoring hydrogen gas leaks, are significant due to hydrogen's unique properties.
For instance, a chemical plant implementing real-time monitoring of hydrogen purity for its processes must use technologies like gas chromatography to prevent catalyst poisoning, a far more precise requirement than simple leak detection. The widespread adoption of AI in hydrogen pipeline leak detection is enabling this shift, with predictive maintenance for hydrogen compressors becoming standard practice.
Operators using hydrogen pipeline integrity management software can now leverage algorithms that analyze data from fiber optic sensors for hydrogen pipelines, moving beyond reactive repairs. Compliance with evolving regulatory standards for hydrogen pipelines, such as those under the European Union's updated directives, is non-negotiable.
An operational analysis shows that while ultrasonic testing for hydrogen embrittlement is critical, the total cost of ownership for a comprehensive system is often lower than the potential financial and reputational cost of a single significant incident, making advanced monitoring a sound capital investment.
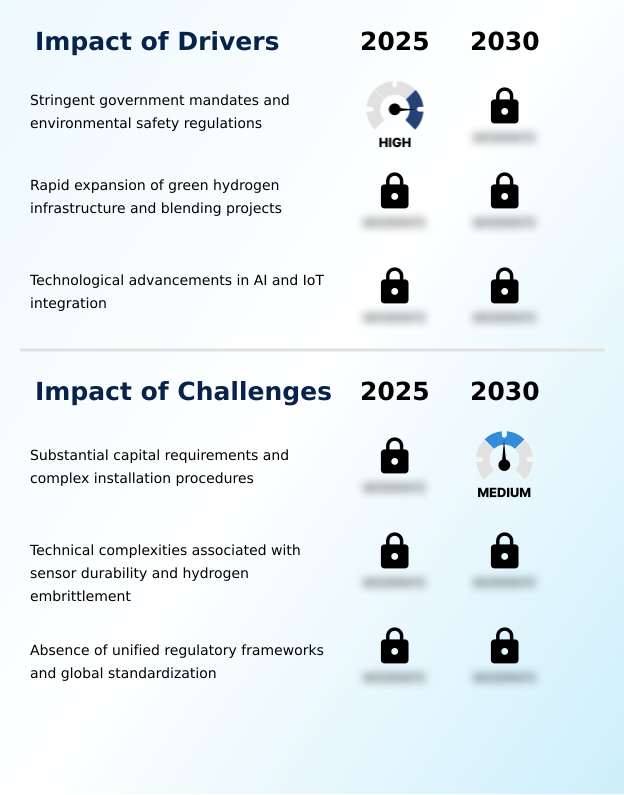
Primary Growth Driver: Stringent government mandates and environmental safety regulations are a key driver for the global hydrogen pipeline monitoring systems market.
Stringent government mandates and environmental safety regulations are the primary market drivers. With a projected year-over-year growth of 13.9%, the expansion is directly linked to compliance pressures and the build-out of new energy transition infrastructure.
Governments are compelling operators to invest in sophisticated surveillance, including real-time transient modeling and advanced leak detection and repair systems, to ensure public safety and prevent fugitive emissions.
The rapid development of green hydrogen production facilities necessitates secure distribution networks, pushing operators to adopt technologies like supervisory control and data acquisition (SCADA) systems and comprehensive pipeline integrity management software from the outset to mitigate the inherent risks of transporting hydrogen.
Emerging Market Trend: The evolution toward advanced acoustic emission and fiber optic sensor hardware is a significant market trend. This shift addresses the unique challenges of hydrogen detection, improving sensitivity and reliability in pipeline monitoring.
A significant trend is the formation of strategic partnerships to retrofit legacy natural gas infrastructure for hydrogen service, a process demanding advanced monitoring to manage hydrogen embrittlement. This involves integrating technologies like distributed acoustic sensing and ultrasonic flow meters. Concurrently, the industry is moving toward standardized calibration protocols for instrumentation, ensuring that systems perform reliably across different operational contexts.
This push for standardization, particularly active in high-growth regions like APAC, is critical for ensuring the interoperability of systems from different vendors. The evolution of sensor hardware, particularly in fiber optic sensing and acoustic emission monitoring, is enabling more precise and proactive pipeline integrity management, which is essential as the volume of green hydrogen transport increases.
Key Industry Challenge: Substantial capital requirements and complex installation procedures present a key challenge to the growth of the hydrogen pipeline monitoring systems market.
The market's growth is constrained by substantial capital requirements and technical complexities. The high cost of advanced hardware, such as corrosion-resistant materials and specialized fiber optic sensing arrays, acts as a barrier, particularly for retrofitting aging infrastructure. The technical challenge of hydrogen embrittlement requires continuous innovation in non-destructive testing and material science, increasing R&D expenses.
Furthermore, the absence of globally unified regulatory frameworks creates uncertainty for operators and technology providers, forcing customization and hindering economies of scale. These factors are particularly acute in regions like South America, which exhibit a slower growth trajectory, partly due to these financial and technical hurdles.
Explore Full Market Dynamics Analysis Request Free Sample
Hydrogen Pipeline Monitoring Systems Market Segmentation
The hydrogen pipeline monitoring systems industry research report provides comprehensive data including region-wise segment analysis, with forecasts and analysis for the period 2026-2030, as well as historical data from 2020-2024 for the following segments.
Component Segment Analysis
The hardware segment is estimated to witness significant growth during the forecast period.
The hardware segment is foundational, comprising physical devices essential for safe hydrogen transport. This includes advanced fiber optic sensing cables, acoustic emission monitoring detectors, and specialized ultrasonic flow meters designed to withstand hydrogen embrittlement.
Given that hydrogen's small molecular size and high diffusivity pose significant leak risks, the reliability of these physical components is paramount.
Procurement decisions are driven by the need for durable, corrosion-resistant materials and adherence to intrinsic safety standards to prevent ignition in volatile environments.
This segment accounts for the largest portion of capital expenditure, reflecting the critical nature of robust hardware in overall pipeline integrity management. The hardware segment's market size is projected to be 208.4 million in 2025, underscoring its significance.
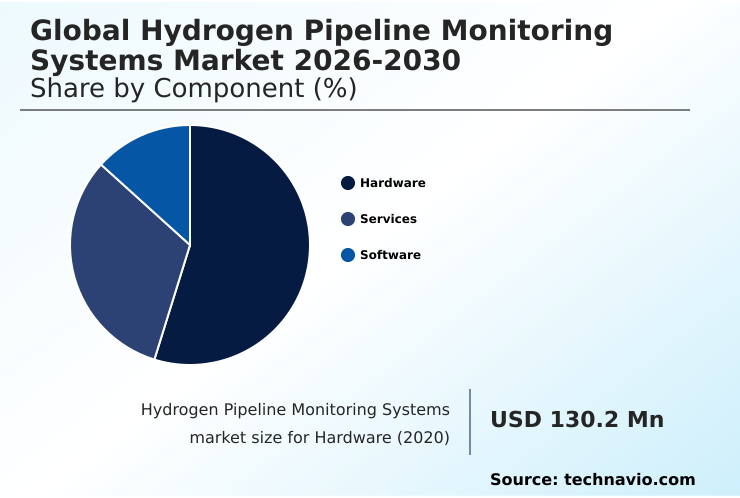
The Hardware segment was valued at USD 184.6 million in 2024 and showed a gradual increase during the forecast period.
Hydrogen Pipeline Monitoring Systems Market by Region: Europe Leads with 33% Growth Share
Europe is estimated to contribute 33% to the growth of the global market during the forecast period.
The geographic landscape is dominated by regions with aggressive decarbonization policies and substantial infrastructure projects.
Europe is set to account for approximately 33% of the market's incremental growth, with nations like Germany investing heavily in new hydrogen corridors and repurposing existing gas grids.
North America follows closely, contributing over 31% to growth, driven by federal initiatives in the United States to establish regional clean hydrogen hubs. These efforts necessitate advanced cross-border pipeline security and robust energy transition infrastructure.
In contrast, the APAC region, while contributing nearly 25% of growth, sees a focus on developing new green hydrogen transport networks, particularly in Australia and China, to support industrial demand and export ambitions.
This regional divergence underscores a global market where investment in supervisory control and data acquisition and pipeline integrity management is tied directly to national energy strategies.
Customer Landscape Analysis for the Hydrogen Pipeline Monitoring Systems Market
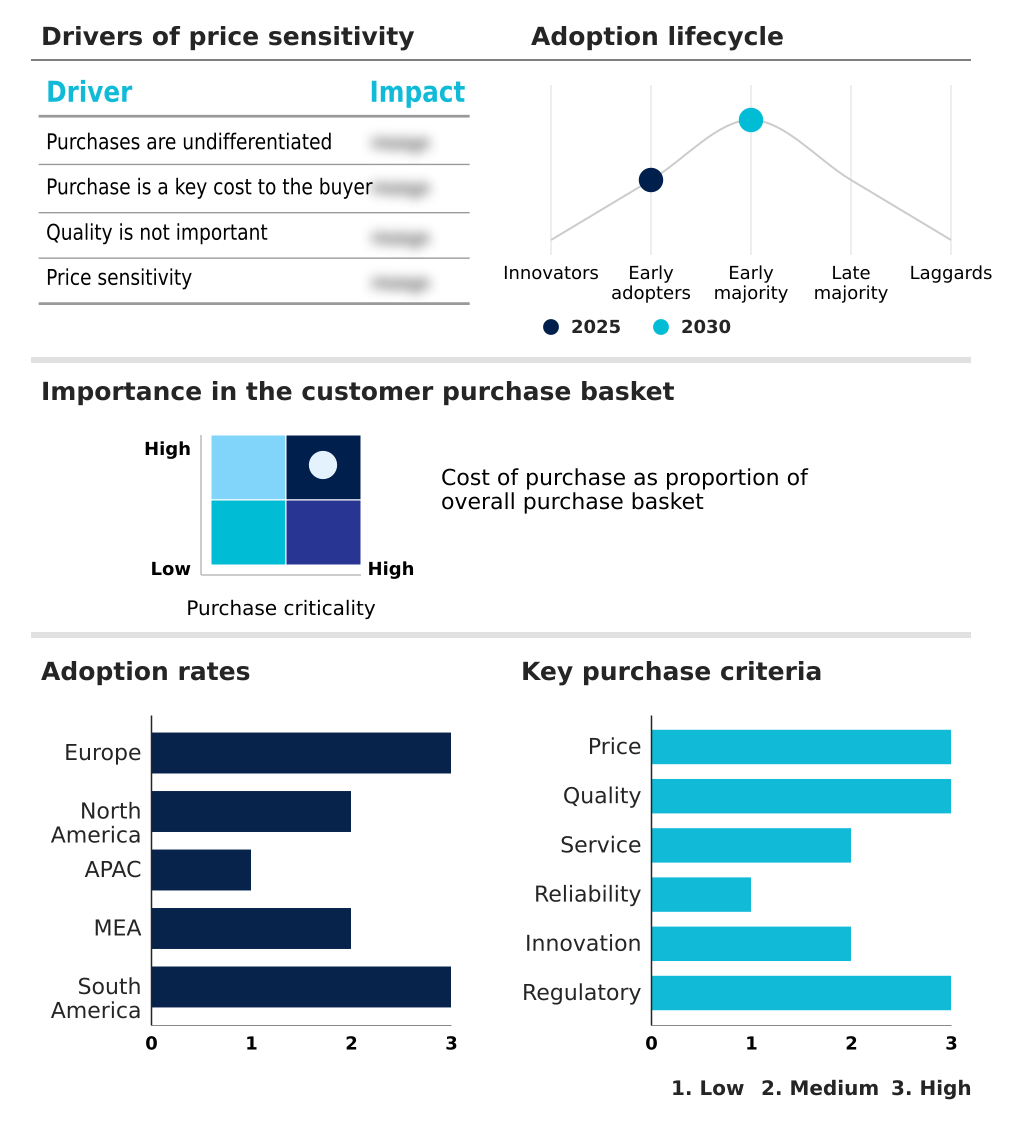
The hydrogen pipeline monitoring systems market forecasting report includes the adoption lifecycle of the market, covering from the innovator’s stage to the laggard’s stage. It focuses on adoption rates in different regions based on penetration. Furthermore, the hydrogen pipeline monitoring systems market report also includes key purchase criteria and drivers of price sensitivity to help companies evaluate and develop their market growth analysis strategies.
Competitive Landscape of the Hydrogen Pipeline Monitoring Systems Market
Companies are implementing various strategies, such as strategic alliances, partnerships, mergers and acquisitions, geographical expansion, and product/service launches, to enhance their presence in the hydrogen pipeline monitoring systems market industry.
ABB Ltd. - Offerings include fiber-optic distributed acoustic sensing (DAS) and distributed temperature sensing (DTS) technologies, providing real-time pipeline leak detection and integrity monitoring.
The industry research and growth report includes detailed analyses of the competitive landscape of the market and information about key companies, including:
- ABB Ltd.
- AP Sensing GmbH
- Baker Hughes Co.
- DNV Group AS
- Dragerwerk AG and Co. KGaA
- Emerson Electric Co.
- Endress Hauser Grp Services
- Honeywell International Inc.
- KROHNE Group
- MSA Safety Inc.
- ROSEN Swiss AG
- Schneider Electric SE
- SICK AG
- Siemens AG
- T.D. Williamson Inc.
- Teledyne Technologies Inc.
- Yokogawa Electric Corp.
Qualitative and quantitative analysis of companies has been conducted to help clients understand the wider business environment as well as the strengths and weaknesses of key industry players. Data is qualitatively analyzed to categorize companies as pure play, category-focused, industry-focused, and diversified; it is quantitatively analyzed to categorize companies as dominant, leading, strong, tentative, and weak.
Recent Developments in the Hydrogen Pipeline Monitoring Systems Market
- In May, 2025, Sinopec launched a $690 million venture capital fund targeting innovations across the hydrogen value chain, including advanced pipeline monitoring technologies, next-generation sensors, and safety systems.
- In March, 2025, Baker Hughes reinforced its commitment to the hydrogen economy by participating in the Clean Hydrogen Partnership, contributing to projects valued at approximately $33 million focused on infrastructure technologies and pipeline safety.
- In March, 2025, Fluxys announced the commencement of construction for the initial phase of its hydrogen pipeline network, a significant project advancing the transition toward a sustainable, low-carbon energy system in Europe.
- In February, 2025, Dai Nippon Printing, in collaboration with Yokohama National University, introduced a novel hydrogen leak detection system that integrates RFID tags with a specialized sensing film, detecting hydrogen via resistance variation without generating heat.
Research Analyst Overview: Hydrogen Pipeline Monitoring Systems Market
The market's trajectory is fundamentally tied to managing the material science challenge of hydrogen embrittlement. Boardroom decisions on capital expenditure are increasingly influenced by the need for sophisticated non-destructive testing and pipeline integrity management to mitigate this risk.
While the hardware segment, including specialized sensors and corrosion-resistant materials, represents a significant upfront investment, its 208.4 million market size in 2025 highlights its critical role. A key focus for procurement decision-makers is the integration of predictive maintenance algorithms with SCADA automation platforms.
Compliance with standards like ASME B31.12 for hydrogen piping and pipelines dictates the use of technologies such as distributed acoustic sensing and inline inspection. Operators are moving beyond basic leak detection and repair, adopting digital twin technology and real-time transient modeling to simulate stress scenarios and validate the safety of their networks.
This proactive approach, combining physical hardware with advanced analytics, is becoming the new benchmark for operational excellence in green hydrogen transport.
Dive into Technavio’s robust research methodology, blending expert interviews, extensive data synthesis, and validated models for unparalleled Hydrogen Pipeline Monitoring Systems Market insights. See full methodology.
| Market Scope | |
|---|---|
| Page number | 314 |
| Base year | 2025 |
| Historic period | 2020-2024 |
| Forecast period | 2026-2030 |
| Growth momentum & CAGR | Accelerate at a CAGR of 14.9% |
| Market growth 2026-2030 | USD 390.0 million |
| Market structure | Fragmented |
| YoY growth 2025-2026(%) | 13.9% |
| Key countries | Germany, Spain, France, The Netherlands, UK, Italy, US, Canada, Mexico, China, Japan, Australia, South Korea, India, Indonesia, Saudi Arabia, UAE, Oman, Egypt, Algeria, Brazil, Chile and Argentina |
| Competitive landscape | Leading Companies, Market Positioning of Companies, Competitive Strategies, and Industry Risks |
Hydrogen Pipeline Monitoring Systems Market: Key Questions Answered in This Report
-
What is the expected growth of the Hydrogen Pipeline Monitoring Systems Market between 2026 and 2030?
-
The Hydrogen Pipeline Monitoring Systems Market is expected to grow by USD 390 million during 2026-2030, registering a CAGR of 14.9%. Year-over-year growth in 2026 is estimated at 13.9%%. This acceleration is shaped by stringent government mandates and environmental safety regulations, which is intensifying demand across multiple end-use verticals covered in the report.
-
-
What segmentation does the market report cover?
-
The report is segmented by Component (Hardware, Services, and Software), Technology (Fiber optic, Ultrasonic, Acoustic emission, and Others), End-user (Oil and gas, Chemical, Power generation, Industrial, and Others) and Geography (Europe, North America, APAC, Middle East and Africa, South America). Among these, the Hardware segment is estimated to witness significant growth during the forecast period, driven by rising adoption across key application areas. Each segment includes detailed qualitative and quantitative analysis, along with historical data from 2020-2024 and forecasts through 2030 with year-over-year growth rates.
-
-
Which regions are analyzed in the report?
-
The report covers Europe, North America, APAC, Middle East and Africa and South America. Europe is estimated to contribute 33% to market growth during the forecast period. Country-level analysis includes Germany, Spain, France, The Netherlands, UK, Italy, US, Canada, Mexico, China, Japan, Australia, South Korea, India, Indonesia, Saudi Arabia, UAE, Oman, Egypt, Algeria, Brazil, Chile and Argentina, with dedicated market size tables and year-over-year growth for each.
-
-
What are the key growth drivers and market challenges?
-
The primary driver is stringent government mandates and environmental safety regulations, which is accelerating investment and industry demand. The main challenge is substantial capital requirements and complex installation procedures, creating operational barriers for key market participants. The report quantifies the impact of each driver and challenge across 2026 and 2030 with comparative analysis.
-
-
Who are the major players in the Hydrogen Pipeline Monitoring Systems Market?
-
Key vendors include ABB Ltd., AP Sensing GmbH, Baker Hughes Co., DNV Group AS, Dragerwerk AG and Co. KGaA, Emerson Electric Co., Endress Hauser Grp Services, Honeywell International Inc., KROHNE Group, MSA Safety Inc., ROSEN Swiss AG, Schneider Electric SE, SICK AG, Siemens AG, T.D. Williamson Inc., Teledyne Technologies Inc. and Yokogawa Electric Corp.. The report provides qualitative and quantitative analysis categorizing companies as dominant, leading, strong, tentative, and weak based on their market positioning. Company profiles include business segment analysis, SWOT assessment, key offerings, and recent strategic developments.
-
Hydrogen Pipeline Monitoring Systems Market Research Insights
Market dynamics are shaped by the imperative for asset integrity management and adherence to stringent operational safety protocols. The varying growth rates across regions, with APAC projected to grow at 16.0% compared to South America's 13.3%, highlight differing speeds of infrastructure investment and regulatory enforcement.
Under frameworks like the EU's green energy initiatives, operators must implement certified fugitive emission control and robust emergency response planning. In practice, a cross-border pipeline operator might deploy smart pigging technology for internal inspection while using satellite-based geospatial information systems for right-of-way monitoring.
This multi-layered approach, combining internal and external surveillance, is crucial for securing hazardous area certification and ensuring the security of critical energy transition infrastructure.
We can help! Our analysts can customize this hydrogen pipeline monitoring systems market research report to meet your requirements.
 RIA -
RIA - 
