Impact Investing Market Analysis, Size, and Forecast 2026-2030: North America (US, Mexico, and Canada), Europe (UK, France, and Germany), APAC (China, India, and Japan), South America (Brazil and Colombia), Middle East and Africa (UAE, Saudi Arabia, and South Africa), and Rest of World (ROW)

Impact Investing Market Analysis, Size, and Forecast 2026-2030:
North America (US, Mexico, and Canada), Europe (UK, France, and Germany), APAC (China, India, and Japan), South America (Brazil and Colombia), Middle East and Africa (UAE, Saudi Arabia, and South Africa), and Rest of World (ROW)

Published: Mar 2026 298 Pages SKU: IRTNTR75618

Market Overview at a Glance

$1,566.42 B
Market Opportunity
26.6%
CAGR 2025 - 2030
56.6%
North America Growth
$440.18 B
Institutional investor segment 2024

Impact Investing Market Size 2026-2030

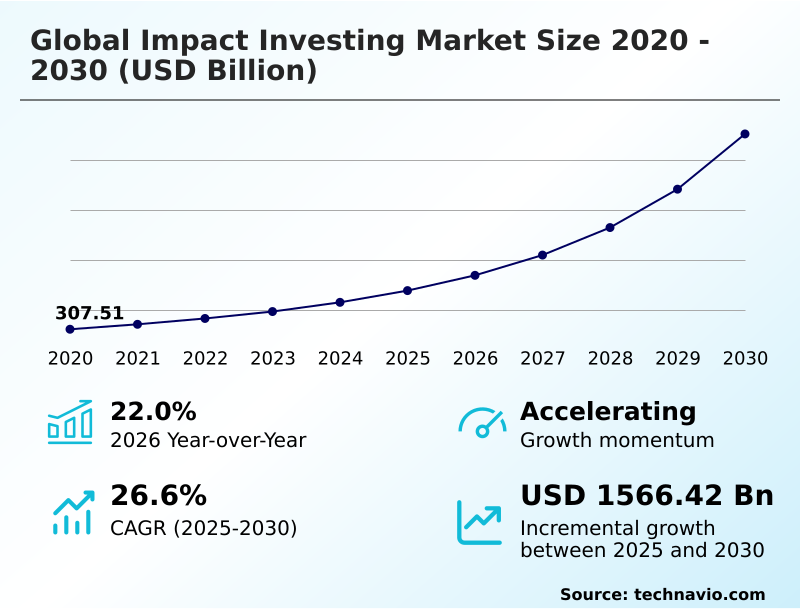
The impact investing market size is valued to increase by USD 1,566.42 billion, at a CAGR of 26.6% from 2025 to 2030. Institutionalization of capital and expansion of fiduciary mandates will drive the impact investing market.

Major Market Trends & Insights

  • North America dominated the market and accounted for a 56.6% growth during the forecast period.
  • By Type - Institutional investor segment was valued at USD 440.18 billion in 2024
  • By Sector - Education segment accounted for the largest market revenue share in 2024

Market Size & Forecast

  • Market Opportunities: USD 1,952.93 billion
  • Market Future Opportunities: USD 1,566.42 billion
  • CAGR from 2025 to 2030 : 26.6%

Market Summary

  • The Impact Investing Market is evolving beyond niche applications to become a core component of mainstream financial strategy. This shift is propelled by the institutionalization of capital, where investors recognize that robust impact measurement and management is integral to fulfilling expanded fiduciary duties.
  • A primary trend is the adoption of sophisticated blended finance structures, which leverage catalytic capital deployment to de-risk investments in areas like sustainable infrastructure projects and attract private funding. This creates a pathway for addressing global challenges such as climate change and social inequality.
  • For instance, an asset manager might structure a fund for climate resilience investing using a theory of change framework. By implementing rigorous impact verification protocols and demonstrating a clear social return on investment, the fund can attract capital from large pension funds. However, the market faces challenges from inconsistent regulatory landscapes and the risk of greenwashing, which undermines investor confidence.
  • Overcoming this requires greater standardization in corporate sustainability reporting and a commitment to intentionality and additionality in all investment decisions, ensuring that capital generates genuine, measurable positive change alongside financial returns.

What will be the Size of the Impact Investing Market during the forecast period?

Get Key Insights on Market Forecast (PDF) Request Free Sample

How is the Impact Investing Market Segmented?

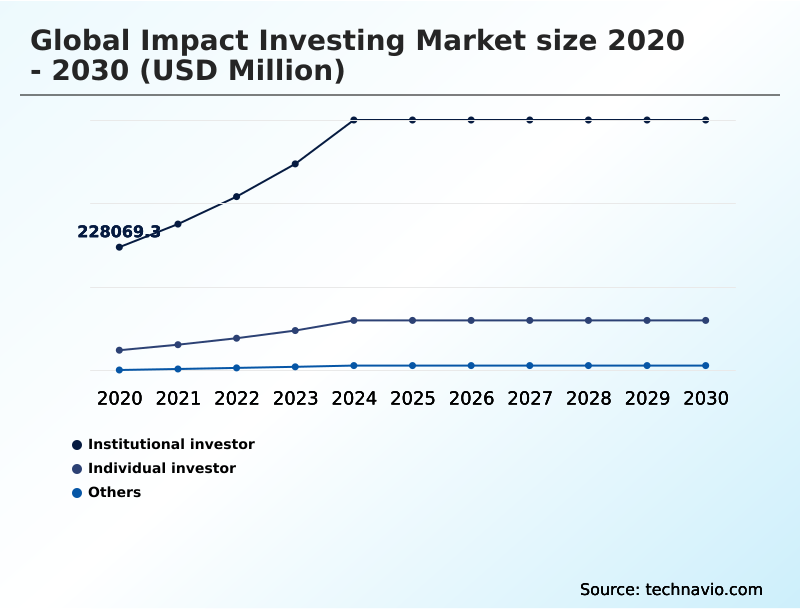
The impact investing industry research report provides comprehensive data (region-wise segment analysis), with forecasts and estimates in "USD million" for the period 2026-2030, as well as historical data from 2020-2024 for the following segments.

  • Type
    • Institutional investor
    • Individual investor
    • Others
  • Sector
    • Education
    • Agriculture
    • Healthcare
    • Energy
    • Others
  • Product
    • Equity
    • Fixed income
    • Multi-asset
    • Alternatives
  • Geography
    • North America
      • US
      • Mexico
      • Canada
    • Europe
      • UK
      • France
      • Germany
    • APAC
      • China
      • India
      • Japan
    • South America
      • Brazil
      • Colombia
    • Middle East and Africa
      • UAE
      • Saudi Arabia
      • South Africa
    • Rest of World (ROW)

By Type Insights

The institutional investor segment is estimated to witness significant growth during the forecast period.

The institutional investor segment is pivotal, driven by a fundamental shift in capital allocation strategies.

Large asset owners are moving beyond traditional financial metrics, embracing an esg integration strategy and recognizing that fiduciary duty expansion now includes mitigating long-term systemic risks.

This has led to the integration of impact asset classes across portfolios, with a focus on sustainable infrastructure projects and private equity impact funds that meet market-rate return expectations.

The impact due diligence process and portfolio impact analysis have become standard, supported by improved non-financial performance reporting.

With capital deployment increasing by 22% year-over-year, these investors now utilize diverse fixed-income impact products, direct impact deals, and other illiquid impact investments to achieve both financial and societal goals.

Request Free Sample

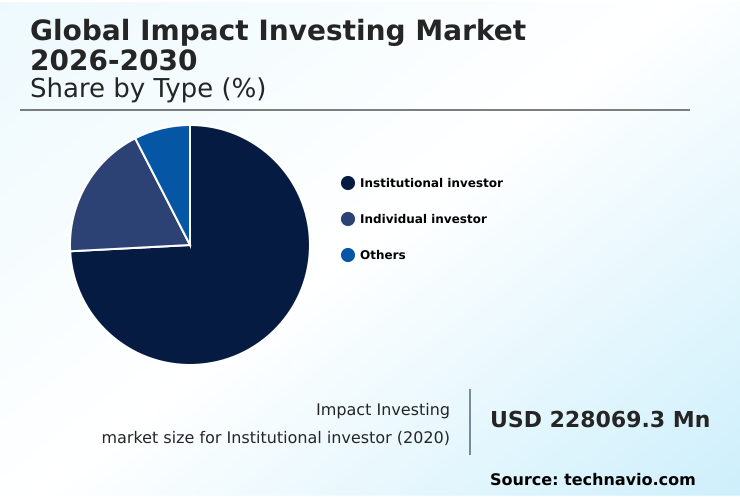
The Institutional investor segment was valued at USD 440.18 billion in 2024 and showed a gradual increase during the forecast period.

Request Free Sample

Regional Analysis

North America is estimated to contribute 56.6% to the growth of the global market during the forecast period.Technavio’s analysts have elaborately explained the regional trends and drivers that shape the market during the forecast period.

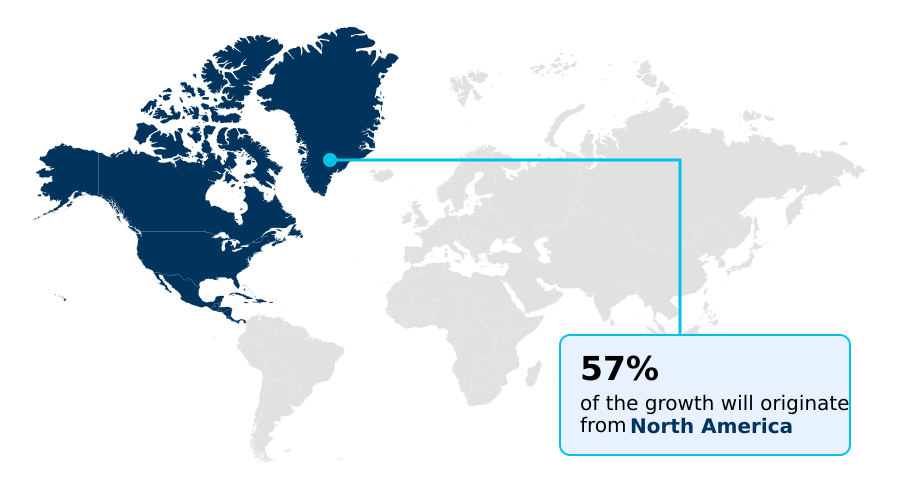
See How Impact Investing Market Demand is Rising in North America Request Free Sample

The geographic landscape is characterized by varied maturity levels and strategic priorities. North America leads in sophisticated private equity impact funds, while the APAC region shows the highest growth trajectory, nearly 3% greater than mature markets.

A key focus is climate resilience investing, with significant capital directed toward sustainable infrastructure projects. The strategy of place-based impact investing is gaining traction for community development finance, especially in emerging markets impact investing.

Multilateral organizations are providing catalytic capital deployment and first-loss capital provisions to attract private investors, who may otherwise be deterred by perceived risks or concessionary financial returns.

Investments in renewable energy project finance and sustainable forestry investment are common, with investors increasingly seeking direct impact deals that offer greater control and transparency while pursuing nature-positive outcomes.

Market Dynamics

Our researchers analyzed the data with 2025 as the base year, along with the key drivers, trends, and challenges. A holistic analysis of drivers will help companies refine their marketing strategies to gain a competitive advantage.

  • The sophistication of the impact investing market is evident in the detailed approaches firms now employ. The process begins with creating a theory of change for funds, which provides a strategic roadmap. A critical task is measuring social impact of investments through robust frameworks, a process that addresses the persistent challenges of impact data collection.
  • For corporate sustainability reporting directive compliance and genuine transparency, impact verification for green bonds has become non-negotiable. Investment committees are increasingly applying strict esg criteria for private equity firms and aligning investments with un sdgs. A key strategy involves decarbonization strategies for portfolios to address climate risk.
  • In high-impact sectors, impact investing for affordable housing and financial inclusion through fintech are gaining momentum. Venture philanthropy funding models and the work of community development financial institutions are vital for seeding innovation. The market also utilizes complex instruments, with social impact bond success factors and outcomes-based contracts in public sector being closely studied.
  • In emerging economies, risk mitigation in blended finance deals and the role of catalytic capital in development are paramount. Thematic investing is deepening, with a focus on gender-lens investing in emerging markets and scaling circular economy private equity funds.
  • A natural capital impact investment strategy also shows that funds integrating these deep ESG factors can outperform benchmarks on a risk-adjusted basis by over 5%.

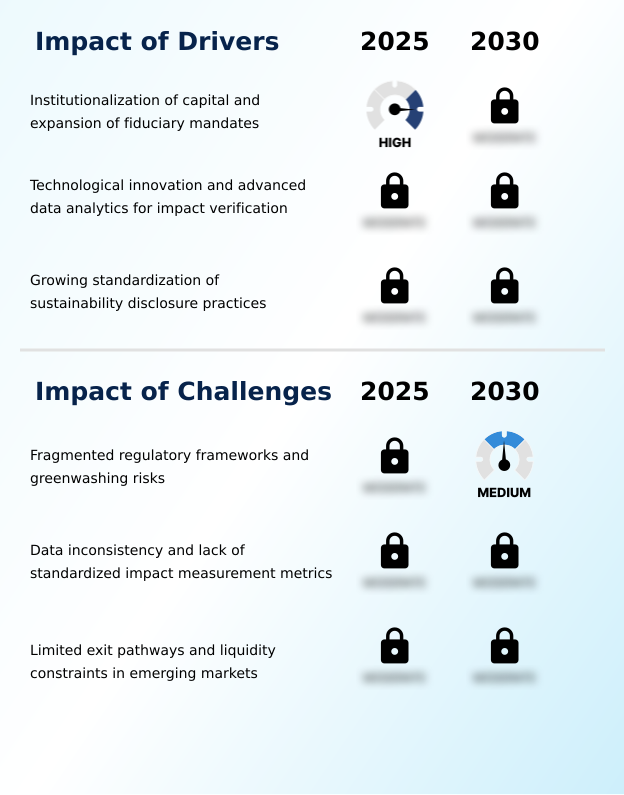
What are the key market drivers leading to the rise in the adoption of Impact Investing Industry?

  • The institutionalization of capital and expansion of fiduciary mandates are key drivers of market growth.

  • Market growth is fundamentally driven by an evolving investor mindset and expanded mandates. A core driver is the widespread adoption of sustainable development goals alignment as a strategic imperative, with firms leveraging impact-weighted accounts to quantify their contributions.
  • The concept of social return on investment is no longer peripheral, influencing decisions from venture philanthropy to large-scale asset allocation. This is reinforced by a redefined understanding of fiduciary duty expansion, compelling managers to consider non-financial outcomes.
  • Strategies now include natural capital valuation and backing financial inclusion initiatives. This triple-bottom-line accounting is becoming standard, fueled by shareholder advocacy for impact and a focus on supply chain sustainability finance.
  • Investments in global health investment funds and education technology investing have seen a 25% increase in capital flow, while sustainable agriculture finance improves food security.

What are the market trends shaping the Impact Investing Industry?

  • The proliferation of blended finance structures is an emerging market trend. These frameworks are designed to mobilize commercial capital for sustainable development.

  • Key trends are reshaping the market, with innovative financial instruments gaining significant traction. The use of blended finance structures is accelerating, with these models showing a 4x improvement in leveraging private capital for development goals. Sophisticated mechanisms like social impact bonds and outcomes-based financing are being deployed to fund social programs, where payments are tied to verified results.
  • This move towards impact-linked finance ensures accountability. Investors are also targeting thematic goals, such as decarbonization pathways, gender-lens investing for social equity, and circular economy financing to promote sustainability. This double-bottom-line investing approach is supported by vehicles focused on climate transition finance and blue economy investments, aligning mission-related investments and program-related investments with just transition principles.

What challenges does the Impact Investing Industry face during its growth?

  • Fragmented regulatory frameworks and the associated risks of greenwashing present a key challenge affecting industry growth.

  • Navigating challenges is crucial for sustaining market integrity and growth. The primary issue remains effective greenwashing risk mitigation, which is directly tied to the need for universally accepted standardized impact metrics and robust impact measurement and management systems. The lack of consistent corporate sustainability reporting frameworks across jurisdictions increases compliance costs by up to 20%.
  • Implementing strong impact verification protocols is essential to prove intentionality and additionality. Other hurdles include applying public equity impact screening effectively and generating consistent impact alpha generation without compromising on mission. A thorough portfolio impact analysis is complex, and evolving impact investing policy frameworks create uncertainty.
  • This affects capital flows into crucial sectors like water and sanitation financing, affordable housing finance, and digital inclusion investments.

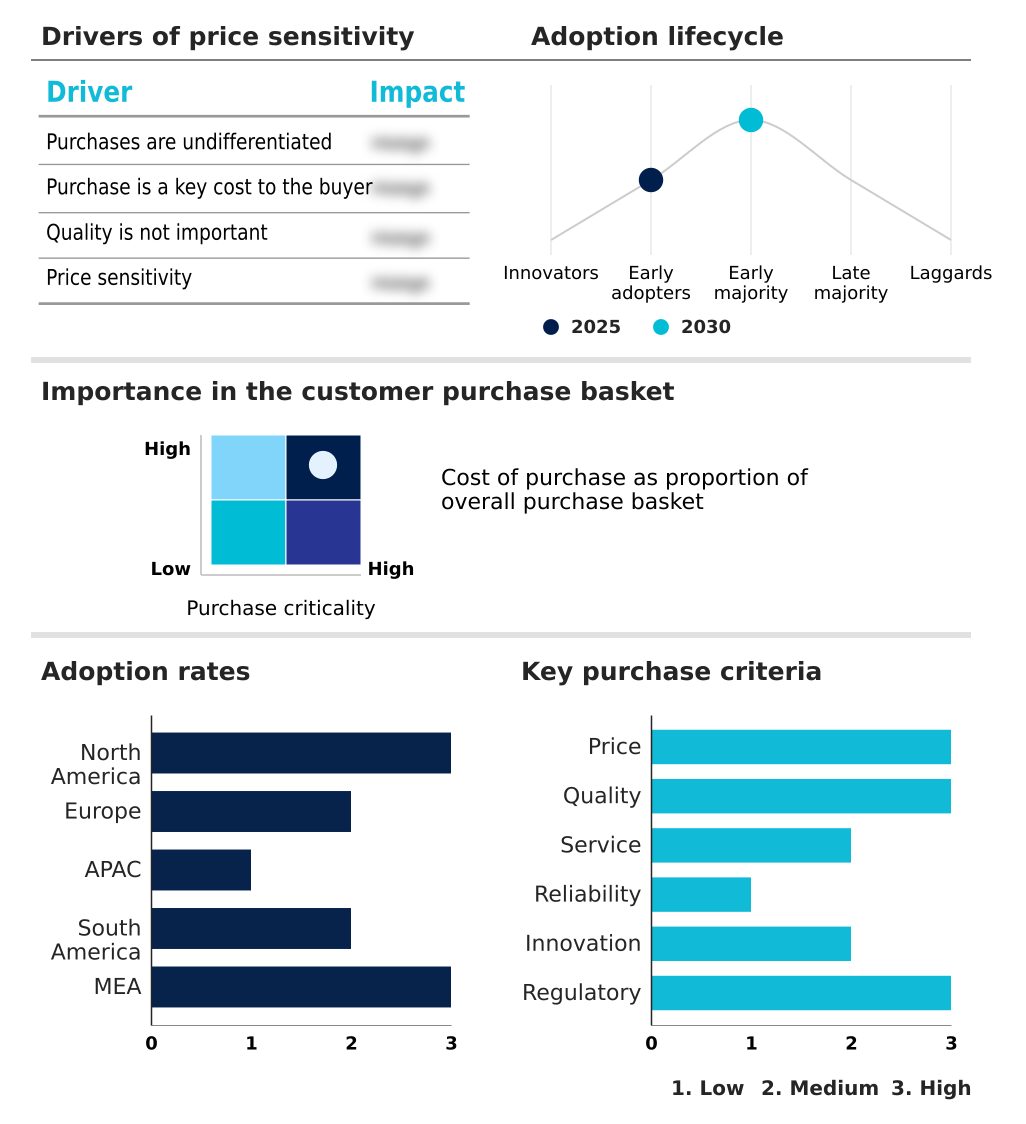
Exclusive Technavio Analysis on Customer Landscape

The impact investing market forecasting report includes the adoption lifecycle of the market, covering from the innovator’s stage to the laggard’s stage. It focuses on adoption rates in different regions based on penetration. Furthermore, the impact investing market report also includes key purchase criteria and drivers of price sensitivity to help companies evaluate and develop their market growth analysis strategies.

Customer Landscape of Impact Investing Industry

Competitive Landscape

Companies are implementing various strategies, such as strategic alliances, impact investing market forecast, partnerships, mergers and acquisitions, geographical expansion, and product/service launches, to enhance their presence in the industry.

Amundi Group - Offers impact investment solutions, including social and environmental funds, sustainable private equity, and financing for key community and environmental transitions.

The industry research and growth report includes detailed analyses of the competitive landscape of the market and information about key companies, including:

  • Amundi Group
  • Apollo Asset Management Inc.
  • Bain Capital LP
  • Bamboo Capital Partners
  • BlackRock Inc.
  • BlueOrchard Finance Ltd.
  • Bridges Fund Management Ltd.
  • Elevar Equity
  • Generation Investment Management
  • KKR and Co. Inc.
  • LeapFrog Investments Group
  • Mirova
  • Nuveen LLC
  • Quona Capital
  • responsAbility Investments AG
  • Symbiotics Group
  • TPG Inc
  • Triodos Investment Management
  • Vital Capital
  • Wellington Management Co. LLP

Qualitative and quantitative analysis of companies has been conducted to help clients understand the wider business environment as well as the strengths and weaknesses of key industry players. Data is qualitatively analyzed to categorize companies as pure play, category-focused, industry-focused, and diversified; it is quantitatively analyzed to categorize companies as dominant, leading, strong, tentative, and weak.

Recent Development and News in Impact investing market

  • In May 2025, KKR and Co. Inc. successfully finalized the capital raise for its Global Impact Fund III, securing over $4 billion to invest in companies that contribute to the United Nations Sustainable Development Goals.
  • In May 2025, the Japan Government Pension Investment Fund announced a strategic partnership with the Global Impact Investing Network, allocating $15 billion toward social infrastructure and climate resilience projects across the Asia-Pacific region.
  • In July 2025, the Asian Development Bank and the Rockefeller Foundation launched the Asia-Pacific Climate and Social Resilience Fund, a $2 billion blended finance vehicle designed to attract private capital for climate-resilient infrastructure.
  • In September 2025, Acumen announced it had successfully raised $246 million for its Hardest-to-Reach Initiative, a fund designed to finance small-scale solar energy enterprises.

Dive into Technavio’s robust research methodology, blending expert interviews, extensive data synthesis, and validated models for unparalleled Impact Investing Market insights. See full methodology.

Market Scope
Page number 298
Base year 2025
Historic period 2020-2024
Forecast period 2026-2030
Growth momentum & CAGR Accelerate at a CAGR of 26.6%
Market growth 2026-2030 USD 1566423.9 million
Market structure Fragmented
YoY growth 2025-2026(%) 22.0%
Key countries US, Mexico, Canada, UK, France, Germany, The Netherlands, Italy, Spain, China, India, Japan, Australia, Singapore, South Korea, Brazil, Chile, Colombia, UAE, Saudi Arabia, South Africa, Israel and Egypt
Competitive landscape Leading Companies, Market Positioning of Companies, Competitive Strategies, and Industry Risks

Request Free Sample

Research Analyst Overview

  • The impact investing market has matured into a strategic discipline, integrating robust analytical frameworks and diverse financial instruments. The adherence to established standards, such as the green bond principles and social bond principles, provides the transparency and consistency necessary for large-scale institutional participation.
  • This move toward standardization is a critical boardroom consideration, influencing capital allocation strategies and risk management protocols related to long-term sustainability. For instance, the increasing use of sustainability-linked loans directly ties a company's cost of capital to its performance on predefined ESG targets, making sustainability a core component of financial planning.
  • The market is demonstrating a 22% increase in capital deployment year-over-year, signifying strong investor confidence. This growth reflects a fundamental shift where creating positive, measurable social and environmental outcomes is recognized as a key driver of long-term financial value and corporate resilience.

What are the Key Data Covered in this Impact Investing Market Research and Growth Report?

  • What is the expected growth of the Impact Investing Market between 2026 and 2030?

    • USD 1,566.42 billion, at a CAGR of 26.6%

  • What segmentation does the market report cover?

    • The report is segmented by Type (Institutional investor, Individual investor, and Others), Sector (Education, Agriculture, Healthcare, Energy, and Others), Product (Equity, Fixed income, Multi-asset, and Alternatives) and Geography (North America, Europe, APAC, South America, Middle East and Africa)

  • Which regions are analyzed in the report?

    • North America, Europe, APAC, South America and Middle East and Africa

  • What are the key growth drivers and market challenges?

    • Institutionalization of capital and expansion of fiduciary mandates, Fragmented regulatory frameworks and greenwashing risks

  • Who are the major players in the Impact Investing Market?

    • Amundi Group, Apollo Asset Management Inc., Bain Capital LP, Bamboo Capital Partners, BlackRock Inc., BlueOrchard Finance Ltd., Bridges Fund Management Ltd., Elevar Equity, Generation Investment Management, KKR and Co. Inc., LeapFrog Investments Group, Mirova, Nuveen LLC, Quona Capital, responsAbility Investments AG, Symbiotics Group, TPG Inc, Triodos Investment Management, Vital Capital and Wellington Management Co. LLP

Market Research Insights

  • The market's dynamism is driven by the diversification of investment vehicles and a focus on measurable outcomes. Firms that adopt rigorous impact investing policy frameworks report a 15% faster capital deployment cycle. The landscape now includes specialized instruments like microfinance investment vehicles, which have proven to increase financial inclusion initiatives by over 30% in target regions.
  • The rise of the impact fund of funds structure allows for broader diversification and risk mitigation for institutional allocators. Moreover, public equity impact screening is no longer a niche strategy, with screened portfolios demonstrating comparable or superior risk-adjusted returns to conventional benchmarks. This strategic evolution is enabling investors to build more resilient portfolios while addressing critical social and environmental goals.

We can help! Our analysts can customize this impact investing market research report to meet your requirements.

Get in touch

1. Executive Summary

1.1 Market overview

Executive Summary - Chart on Market Overview
Executive Summary - Data Table on Market Overview
Executive Summary - Chart on Global Market Characteristics
Executive Summary - Chart on Market by Geography
Executive Summary - Chart on Market Segmentation by Type
Executive Summary - Chart on Market Segmentation by Sector
Executive Summary - Chart on Market Segmentation by Product
Executive Summary - Chart on Incremental Growth
Executive Summary - Data Table on Incremental Growth
Executive Summary - Chart on Company Market Positioning

2. Technavio Analysis

2.1 Analysis of price sensitivity, lifecycle, customer purchase basket, adoption rates, and purchase criteria

2.2 Criticality of inputs and Factors of differentiation

Chart on Overview on criticality of inputs and factors of differentiation

2.3 Factors of disruption

Chart on Overview on factors of disruption

2.4 Impact of drivers and challenges

Chart on Impact of drivers and challenges in 2025 and 2030

3. Market Landscape

3.1 Market ecosystem

Chart on Parent Market
Data Table on - Parent Market

3.2 Market characteristics

Chart on Market characteristics analysis

3.3 Value chain analysis

Chart on Value chain analysis

4. Market Sizing

4.1 Market definition

Data Table on Offerings of companies included in the market definition

4.2 Market segment analysis

Market segments

4.3 Market size 2025

4.4 Market outlook: Forecast for 2025-2030

Chart on Global - Market size and forecast 2025-2030 ($ million)
Data Table on Global - Market size and forecast 2025-2030 ($ million)
Chart on Global Market: Year-over-year growth 2025-2030 (%)
Data Table on Global Market: Year-over-year growth 2025-2030 (%)

5. Historic Market Size

5.1 Global Impact Investing Market 2020 - 2024

Historic Market Size - Data Table on Global Impact Investing Market 2020 - 2024 ($ million)

5.2 Type segment analysis 2020 - 2024

Historic Market Size - Type Segment 2020 - 2024 ($ million)

5.3 Sector segment analysis 2020 - 2024

Historic Market Size - Sector Segment 2020 - 2024 ($ million)

5.4 Product segment analysis 2020 - 2024

Historic Market Size - Product Segment 2020 - 2024 ($ million)

5.5 Geography segment analysis 2020 - 2024

Historic Market Size - Geography Segment 2020 - 2024 ($ million)

5.6 Country segment analysis 2020 - 2024

Historic Market Size - Country Segment 2020 - 2024 ($ million)

6. Qualitative Analysis

6.1 Impact of AI in Global Impact Investing Market

6.2 Impact of Geopolitical Conflict on Global Impact Investing Market

7. Five Forces Analysis

7.1 Five forces summary

Five forces analysis - Comparison between 2025 and 2030

7.2 Bargaining power of buyers

Bargaining power of buyers - Impact of key factors 2025 and 2030

7.3 Bargaining power of suppliers

Bargaining power of suppliers - Impact of key factors in 2025 and 2030

7.4 Threat of new entrants

Threat of new entrants - Impact of key factors in 2025 and 2030

7.5 Threat of substitutes

Threat of substitutes - Impact of key factors in 2025 and 2030

7.6 Threat of rivalry

Threat of rivalry - Impact of key factors in 2025 and 2030

7.7 Market condition

Chart on Market condition - Five forces 2025 and 2030

8. Market Segmentation by Type

8.1 Market segments

Chart on Type - Market share 2025-2030 (%)
Data Table on Type - Market share 2025-2030 (%)

8.2 Comparison by Type

Chart on Comparison by Type
Data Table on Comparison by Type

8.3 Institutional investor - Market size and forecast 2025-2030

Chart on Institutional investor - Market size and forecast 2025-2030 ($ million)
Data Table on Institutional investor - Market size and forecast 2025-2030 ($ million)
Chart on Institutional investor - Year-over-year growth 2025-2030 (%)
Data Table on Institutional investor - Year-over-year growth 2025-2030 (%)

8.4 Individual investor - Market size and forecast 2025-2030

Chart on Individual investor - Market size and forecast 2025-2030 ($ million)
Data Table on Individual investor - Market size and forecast 2025-2030 ($ million)
Chart on Individual investor - Year-over-year growth 2025-2030 (%)
Data Table on Individual investor - Year-over-year growth 2025-2030 (%)

8.5 Others - Market size and forecast 2025-2030

Chart on Others - Market size and forecast 2025-2030 ($ million)
Data Table on Others - Market size and forecast 2025-2030 ($ million)
Chart on Others - Year-over-year growth 2025-2030 (%)
Data Table on Others - Year-over-year growth 2025-2030 (%)

8.6 Market opportunity by Type

Market opportunity by Type ($ million)
Data Table on Market opportunity by Type ($ million)

9. Market Segmentation by Sector

9.1 Market segments

Chart on Sector - Market share 2025-2030 (%)
Data Table on Sector - Market share 2025-2030 (%)

9.2 Comparison by Sector

Chart on Comparison by Sector
Data Table on Comparison by Sector

9.3 Education - Market size and forecast 2025-2030

Chart on Education - Market size and forecast 2025-2030 ($ million)
Data Table on Education - Market size and forecast 2025-2030 ($ million)
Chart on Education - Year-over-year growth 2025-2030 (%)
Data Table on Education - Year-over-year growth 2025-2030 (%)

9.4 Agriculture - Market size and forecast 2025-2030

Chart on Agriculture - Market size and forecast 2025-2030 ($ million)
Data Table on Agriculture - Market size and forecast 2025-2030 ($ million)
Chart on Agriculture - Year-over-year growth 2025-2030 (%)
Data Table on Agriculture - Year-over-year growth 2025-2030 (%)

9.5 Healthcare - Market size and forecast 2025-2030

Chart on Healthcare - Market size and forecast 2025-2030 ($ million)
Data Table on Healthcare - Market size and forecast 2025-2030 ($ million)
Chart on Healthcare - Year-over-year growth 2025-2030 (%)
Data Table on Healthcare - Year-over-year growth 2025-2030 (%)

9.6 Energy - Market size and forecast 2025-2030

Chart on Energy - Market size and forecast 2025-2030 ($ million)
Data Table on Energy - Market size and forecast 2025-2030 ($ million)
Chart on Energy - Year-over-year growth 2025-2030 (%)
Data Table on Energy - Year-over-year growth 2025-2030 (%)

9.7 Others - Market size and forecast 2025-2030

Chart on Others - Market size and forecast 2025-2030 ($ million)
Data Table on Others - Market size and forecast 2025-2030 ($ million)
Chart on Others - Year-over-year growth 2025-2030 (%)
Data Table on Others - Year-over-year growth 2025-2030 (%)

9.8 Market opportunity by Sector

Market opportunity by Sector ($ million)
Data Table on Market opportunity by Sector ($ million)

10. Market Segmentation by Product

10.1 Market segments

Chart on Product - Market share 2025-2030 (%)
Data Table on Product - Market share 2025-2030 (%)

10.2 Comparison by Product

Chart on Comparison by Product
Data Table on Comparison by Product

10.3 Equity - Market size and forecast 2025-2030

Chart on Equity - Market size and forecast 2025-2030 ($ million)
Data Table on Equity - Market size and forecast 2025-2030 ($ million)
Chart on Equity - Year-over-year growth 2025-2030 (%)
Data Table on Equity - Year-over-year growth 2025-2030 (%)

10.4 Fixed income - Market size and forecast 2025-2030

Chart on Fixed income - Market size and forecast 2025-2030 ($ million)
Data Table on Fixed income - Market size and forecast 2025-2030 ($ million)
Chart on Fixed income - Year-over-year growth 2025-2030 (%)
Data Table on Fixed income - Year-over-year growth 2025-2030 (%)

10.5 Multi-asset - Market size and forecast 2025-2030

Chart on Multi-asset - Market size and forecast 2025-2030 ($ million)
Data Table on Multi-asset - Market size and forecast 2025-2030 ($ million)
Chart on Multi-asset - Year-over-year growth 2025-2030 (%)
Data Table on Multi-asset - Year-over-year growth 2025-2030 (%)

10.6 Alternatives - Market size and forecast 2025-2030

Chart on Alternatives - Market size and forecast 2025-2030 ($ million)
Data Table on Alternatives - Market size and forecast 2025-2030 ($ million)
Chart on Alternatives - Year-over-year growth 2025-2030 (%)
Data Table on Alternatives - Year-over-year growth 2025-2030 (%)

10.7 Market opportunity by Product

Market opportunity by Product ($ million)
Data Table on Market opportunity by Product ($ million)

11. Customer Landscape

11.1 Customer landscape overview

Analysis of price sensitivity, lifecycle, customer purchase basket, adoption rates, and purchase criteria

12. Geographic Landscape

12.1 Geographic segmentation

Chart on Market share by geography 2025-2030 (%)
Data Table on Market share by geography 2025-2030 (%)

12.2 Geographic comparison

Chart on Geographic comparison
Data Table on Geographic comparison

12.3 North America - Market size and forecast 2025-2030

Chart on North America - Market size and forecast 2025-2030 ($ million)
Data Table on North America - Market size and forecast 2025-2030 ($ million)
Chart on North America - Year-over-year growth 2025-2030 (%)
Data Table on North America - Year-over-year growth 2025-2030 (%)
Chart on Regional Comparison - North America
Data Table on Regional Comparison - North America

12.3.1 US - Market size and forecast 2025-2030

Chart on US - Market size and forecast 2025-2030 ($ million)
Data Table on US - Market size and forecast 2025-2030 ($ million)
Chart on US - Year-over-year growth 2025-2030 (%)
Data Table on US - Year-over-year growth 2025-2030 (%)

12.3.2 Mexico - Market size and forecast 2025-2030

Chart on Mexico - Market size and forecast 2025-2030 ($ million)
Data Table on Mexico - Market size and forecast 2025-2030 ($ million)
Chart on Mexico - Year-over-year growth 2025-2030 (%)
Data Table on Mexico - Year-over-year growth 2025-2030 (%)

12.3.3 Canada - Market size and forecast 2025-2030

Chart on Canada - Market size and forecast 2025-2030 ($ million)
Data Table on Canada - Market size and forecast 2025-2030 ($ million)
Chart on Canada - Year-over-year growth 2025-2030 (%)
Data Table on Canada - Year-over-year growth 2025-2030 (%)

12.4 Europe - Market size and forecast 2025-2030

Chart on Europe - Market size and forecast 2025-2030 ($ million)
Data Table on Europe - Market size and forecast 2025-2030 ($ million)
Chart on Europe - Year-over-year growth 2025-2030 (%)
Data Table on Europe - Year-over-year growth 2025-2030 (%)
Chart on Regional Comparison - Europe
Data Table on Regional Comparison - Europe

12.4.1 UK - Market size and forecast 2025-2030

Chart on UK - Market size and forecast 2025-2030 ($ million)
Data Table on UK - Market size and forecast 2025-2030 ($ million)
Chart on UK - Year-over-year growth 2025-2030 (%)
Data Table on UK - Year-over-year growth 2025-2030 (%)

12.4.2 France - Market size and forecast 2025-2030

Chart on France - Market size and forecast 2025-2030 ($ million)
Data Table on France - Market size and forecast 2025-2030 ($ million)
Chart on France - Year-over-year growth 2025-2030 (%)
Data Table on France - Year-over-year growth 2025-2030 (%)

12.4.3 Germany - Market size and forecast 2025-2030

Chart on Germany - Market size and forecast 2025-2030 ($ million)
Data Table on Germany - Market size and forecast 2025-2030 ($ million)
Chart on Germany - Year-over-year growth 2025-2030 (%)
Data Table on Germany - Year-over-year growth 2025-2030 (%)

12.4.4 The Netherlands - Market size and forecast 2025-2030

Chart on The Netherlands - Market size and forecast 2025-2030 ($ million)
Data Table on The Netherlands - Market size and forecast 2025-2030 ($ million)
Chart on The Netherlands - Year-over-year growth 2025-2030 (%)
Data Table on The Netherlands - Year-over-year growth 2025-2030 (%)

12.4.5 Italy - Market size and forecast 2025-2030

Chart on Italy - Market size and forecast 2025-2030 ($ million)
Data Table on Italy - Market size and forecast 2025-2030 ($ million)
Chart on Italy - Year-over-year growth 2025-2030 (%)
Data Table on Italy - Year-over-year growth 2025-2030 (%)

12.4.6 Spain - Market size and forecast 2025-2030

Chart on Spain - Market size and forecast 2025-2030 ($ million)
Data Table on Spain - Market size and forecast 2025-2030 ($ million)
Chart on Spain - Year-over-year growth 2025-2030 (%)
Data Table on Spain - Year-over-year growth 2025-2030 (%)

12.5 APAC - Market size and forecast 2025-2030

Chart on APAC - Market size and forecast 2025-2030 ($ million)
Data Table on APAC - Market size and forecast 2025-2030 ($ million)
Chart on APAC - Year-over-year growth 2025-2030 (%)
Data Table on APAC - Year-over-year growth 2025-2030 (%)
Chart on Regional Comparison - APAC
Data Table on Regional Comparison - APAC

12.5.1 China - Market size and forecast 2025-2030

Chart on China - Market size and forecast 2025-2030 ($ million)
Data Table on China - Market size and forecast 2025-2030 ($ million)
Chart on China - Year-over-year growth 2025-2030 (%)
Data Table on China - Year-over-year growth 2025-2030 (%)

12.5.2 India - Market size and forecast 2025-2030

Chart on India - Market size and forecast 2025-2030 ($ million)
Data Table on India - Market size and forecast 2025-2030 ($ million)
Chart on India - Year-over-year growth 2025-2030 (%)
Data Table on India - Year-over-year growth 2025-2030 (%)

12.5.3 Japan - Market size and forecast 2025-2030

Chart on Japan - Market size and forecast 2025-2030 ($ million)
Data Table on Japan - Market size and forecast 2025-2030 ($ million)
Chart on Japan - Year-over-year growth 2025-2030 (%)
Data Table on Japan - Year-over-year growth 2025-2030 (%)

12.5.4 Australia - Market size and forecast 2025-2030

Chart on Australia - Market size and forecast 2025-2030 ($ million)
Data Table on Australia - Market size and forecast 2025-2030 ($ million)
Chart on Australia - Year-over-year growth 2025-2030 (%)
Data Table on Australia - Year-over-year growth 2025-2030 (%)

12.5.5 Singapore - Market size and forecast 2025-2030

Chart on Singapore - Market size and forecast 2025-2030 ($ million)
Data Table on Singapore - Market size and forecast 2025-2030 ($ million)
Chart on Singapore - Year-over-year growth 2025-2030 (%)
Data Table on Singapore - Year-over-year growth 2025-2030 (%)

12.5.6 South Korea - Market size and forecast 2025-2030

Chart on South Korea - Market size and forecast 2025-2030 ($ million)
Data Table on South Korea - Market size and forecast 2025-2030 ($ million)
Chart on South Korea - Year-over-year growth 2025-2030 (%)
Data Table on South Korea - Year-over-year growth 2025-2030 (%)

12.6 South America - Market size and forecast 2025-2030

Chart on South America - Market size and forecast 2025-2030 ($ million)
Data Table on South America - Market size and forecast 2025-2030 ($ million)
Chart on South America - Year-over-year growth 2025-2030 (%)
Data Table on South America - Year-over-year growth 2025-2030 (%)
Chart on Regional Comparison - South America
Data Table on Regional Comparison - South America

12.6.1 Brazil - Market size and forecast 2025-2030

Chart on Brazil - Market size and forecast 2025-2030 ($ million)
Data Table on Brazil - Market size and forecast 2025-2030 ($ million)
Chart on Brazil - Year-over-year growth 2025-2030 (%)
Data Table on Brazil - Year-over-year growth 2025-2030 (%)

12.6.2 Chile - Market size and forecast 2025-2030

Chart on Chile - Market size and forecast 2025-2030 ($ million)
Data Table on Chile - Market size and forecast 2025-2030 ($ million)
Chart on Chile - Year-over-year growth 2025-2030 (%)
Data Table on Chile - Year-over-year growth 2025-2030 (%)

12.6.3 Colombia - Market size and forecast 2025-2030

Chart on Colombia - Market size and forecast 2025-2030 ($ million)
Data Table on Colombia - Market size and forecast 2025-2030 ($ million)
Chart on Colombia - Year-over-year growth 2025-2030 (%)
Data Table on Colombia - Year-over-year growth 2025-2030 (%)

12.7 Middle East and Africa - Market size and forecast 2025-2030

Chart on Middle East and Africa - Market size and forecast 2025-2030 ($ million)
Data Table on Middle East and Africa - Market size and forecast 2025-2030 ($ million)
Chart on Middle East and Africa - Year-over-year growth 2025-2030 (%)
Data Table on Middle East and Africa - Year-over-year growth 2025-2030 (%)
Chart on Regional Comparison - Middle East and Africa
Data Table on Regional Comparison - Middle East and Africa

12.7.1 UAE - Market size and forecast 2025-2030

Chart on UAE - Market size and forecast 2025-2030 ($ million)
Data Table on UAE - Market size and forecast 2025-2030 ($ million)
Chart on UAE - Year-over-year growth 2025-2030 (%)
Data Table on UAE - Year-over-year growth 2025-2030 (%)

12.7.2 Saudi Arabia - Market size and forecast 2025-2030

Chart on Saudi Arabia - Market size and forecast 2025-2030 ($ million)
Data Table on Saudi Arabia - Market size and forecast 2025-2030 ($ million)
Chart on Saudi Arabia - Year-over-year growth 2025-2030 (%)
Data Table on Saudi Arabia - Year-over-year growth 2025-2030 (%)

12.7.3 South Africa - Market size and forecast 2025-2030

Chart on South Africa - Market size and forecast 2025-2030 ($ million)
Data Table on South Africa - Market size and forecast 2025-2030 ($ million)
Chart on South Africa - Year-over-year growth 2025-2030 (%)
Data Table on South Africa - Year-over-year growth 2025-2030 (%)

12.7.4 Israel - Market size and forecast 2025-2030

Chart on Israel - Market size and forecast 2025-2030 ($ million)
Data Table on Israel - Market size and forecast 2025-2030 ($ million)
Chart on Israel - Year-over-year growth 2025-2030 (%)
Data Table on Israel - Year-over-year growth 2025-2030 (%)

12.7.5 Egypt - Market size and forecast 2025-2030

Chart on Egypt - Market size and forecast 2025-2030 ($ million)
Data Table on Egypt - Market size and forecast 2025-2030 ($ million)
Chart on Egypt - Year-over-year growth 2025-2030 (%)
Data Table on Egypt - Year-over-year growth 2025-2030 (%)

12.8 Market opportunity by geography

Market opportunity by geography ($ million)
Data Tables on Market opportunity by geography ($ million)

13. Drivers, Challenges, and Opportunity

13.1 Market drivers

Institutionalization of capital and expansion of fiduciary mandates
Technological innovation and advanced data analytics for impact verification
Growing standardization of sustainability disclosure practices

13.2 Market challenges

Fragmented regulatory frameworks and greenwashing risks
Data inconsistency and lack of standardized impact measurement metrics
Limited exit pathways and liquidity constraints in emerging markets

13.3 Impact of drivers and challenges

Impact of drivers and challenges in 2025 and 2030

13.4 Market opportunities

Proliferation of blended finance structures for sustainable development
Integration of biodiversity and nature-positive outcomes
Adoption of AI for real-time impact verification

14. Competitive Landscape

14.1 Overview

14.2

Overview on criticality of inputs and factors of differentiation

14.3 Landscape disruption

Overview on factors of disruption

14.4 Industry risks

Impact of key risks on business

15. Competitive Analysis

15.1 Companies profiled

Companies covered

15.2 Company ranking index

15.3 Market positioning of companies

Matrix on companies position and classification

15.4 Amundi Group

Amundi Group - Overview
Amundi Group - Business segments
Amundi Group - Key offerings
Amundi Group - Segment focus
SWOT

15.5 Apollo Asset Management Inc.

Apollo Asset Management Inc. - Overview
Apollo Asset Management Inc. - Business segments
Apollo Asset Management Inc. - Key offerings
Apollo Asset Management Inc. - Segment focus
SWOT

15.6 Bain Capital LP

Bain Capital LP - Overview
Bain Capital LP - Product / Service
Bain Capital LP - Key offerings
SWOT

15.7 Bamboo Capital Partners

Bamboo Capital Partners - Overview
Bamboo Capital Partners - Product / Service
Bamboo Capital Partners - Key offerings
SWOT

15.8 BlackRock Inc.

BlackRock Inc. - Overview
BlackRock Inc. - Product / Service
BlackRock Inc. - Key offerings
SWOT

15.9 BlueOrchard Finance Ltd.

BlueOrchard Finance Ltd. - Overview
BlueOrchard Finance Ltd. - Product / Service
BlueOrchard Finance Ltd. - Key offerings
SWOT

15.10 Generation Investment Management

Generation Investment Management - Overview
Generation Investment Management - Product / Service
Generation Investment Management - Key offerings
SWOT

15.11 KKR and Co. Inc.

KKR and Co. Inc. - Overview
KKR and Co. Inc. - Business segments
KKR and Co. Inc. - Key offerings
KKR and Co. Inc. - Segment focus
SWOT

15.12 LeapFrog Investments Group

LeapFrog Investments Group - Overview
LeapFrog Investments Group - Product / Service
LeapFrog Investments Group - Key offerings
SWOT

15.13 Mirova

Mirova - Overview
Mirova - Product / Service
Mirova - Key offerings
SWOT

15.14 Nuveen LLC

Nuveen LLC - Overview
Nuveen LLC - Product / Service
Nuveen LLC - Key offerings
SWOT

15.15 Symbiotics Group

Symbiotics Group - Overview
Symbiotics Group - Product / Service
Symbiotics Group - Key offerings
SWOT

15.16 TPG Inc

TPG Inc - Overview
TPG Inc - Product / Service
TPG Inc - Key offerings
SWOT

15.17 Vital Capital

Vital Capital - Overview
Vital Capital - Product / Service
Vital Capital - Key offerings
SWOT

15.18 Wellington Management Co. LLP

Wellington Management Co. LLP - Overview
Wellington Management Co. LLP - Product / Service
Wellington Management Co. LLP - Key offerings
SWOT

16. Appendix

16.1 Scope of the report

Market definition
Objectives
Notes and caveats

16.2 Inclusions and exclusions checklist

Inclusions checklist
Exclusions checklist

16.3 Currency conversion rates for US$

16.4 Research methodology

16.5 Data procurement

Information sources

16.6 Data validation

16.7 Validation techniques employed for market sizing

16.8 Data synthesis

16.9 360 degree market analysis

16.10 List of abbreviations

Research Methodology

Technavio presents a detailed picture of the market by way of study, synthesis, and summation of data from multiple sources. The analysts have presented the various facets of the market with a particular focus on identifying the key industry influencers. The data thus presented is comprehensive, reliable, and the result of extensive research, both primary and secondary.

INFORMATION SOURCES

Primary sources

  • Manufacturers and suppliers
  • Channel partners
  • Industry experts
  • Strategic decision makers

Secondary sources

  • Industry journals and periodicals
  • Government data
  • Financial reports of key industry players
  • Historical data
  • Press releases

DATA ANALYSIS

Data Synthesis

  • Collation of data
  • Estimation of key figures
  • Analysis of derived insights

Data Validation

  • Triangulation with data models
  • Reference against proprietary databases
  • Corroboration with industry experts

REPORT WRITING

Qualitative

  • Market drivers
  • Market challenges
  • Market trends
  • Five forces analysis

Quantitative

  • Market size and forecast
  • Market segmentation
  • Geographical insights
  • Competitive landscape

Interested in this report?

Get your sample now to see our research methodology and insights!

Download Now

Frequently Asked Questions

Impact Investing market growth will increase by USD 1566423.9 million during 2026-2030.

The Impact Investing market is expected to grow at a CAGR of 26.6% during 2026-2030.

Impact Investing market is segmented by Type (Institutional investor, Individual investor, Others) Sector (Education, Agriculture, Healthcare, Energy, Others) Product (Equity, Fixed income, Multi-asset, Alternatives)

Amundi Group, Apollo Asset Management Inc., Bain Capital LP, Bamboo Capital Partners, BlackRock Inc., BlueOrchard Finance Ltd., Bridges Fund Management Ltd., Elevar Equity, Generation Investment Management, KKR and Co. Inc., LeapFrog Investments Group, Mirova, Nuveen LLC, Quona Capital, responsAbility Investments AG, Symbiotics Group, TPG Inc, Triodos Investment Management, Vital Capital, Wellington Management Co. LLP are a few of the key vendors in the Impact Investing market.

North America will register the highest growth rate of 56.6% among the other regions. Therefore, the Impact Investing market in North America is expected to garner significant business opportunities for the vendors during the forecast period.

US, Mexico, Canada, UK, France, Germany, The Netherlands, Italy, Spain, China, India, Japan, Australia, Singapore, South Korea, Brazil, Chile, Colombia, UAE, Saudi Arabia, South Africa, Israel, Egypt

  • Institutionalization of capital and expansion of fiduciary mandates is the driving factor this market.

The Impact Investing market vendors should focus on grabbing business opportunities from the Type segment as it accounted for the largest market share in the base year.
RIA - Research AI Assistant
Ask RIA