In-App Advertising Market Analysis North America, Europe, APAC, South America, Middle East and Africa - US, China, India, Germany, UK - Size and Forecast 2024-2028

In-App Advertising Market Analysis North America, Europe, APAC, South America, Middle East and Africa - US, China, India, Germany, UK - Size and Forecast 2024-2028

Published: Aug 2024 163 Pages SKU: IRTNTR75265

Market Overview at a Glance

$338.3 B
Market Opportunity
26.06%
CAGR
21.63
YoY growth 2023-2024(%)

In-App Advertising Market Size 2024-2028

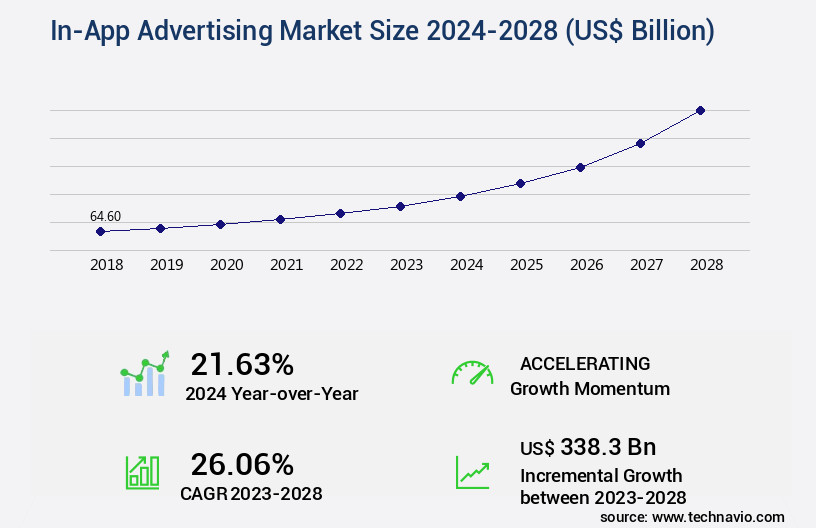
The in-app advertising market size is valued to increase USD 338.3 billion, at a CAGR of 26.06% from 2023 to 2028. Growing use of smartphones will drive the in-app advertising market.

Major Market Trends & Insights

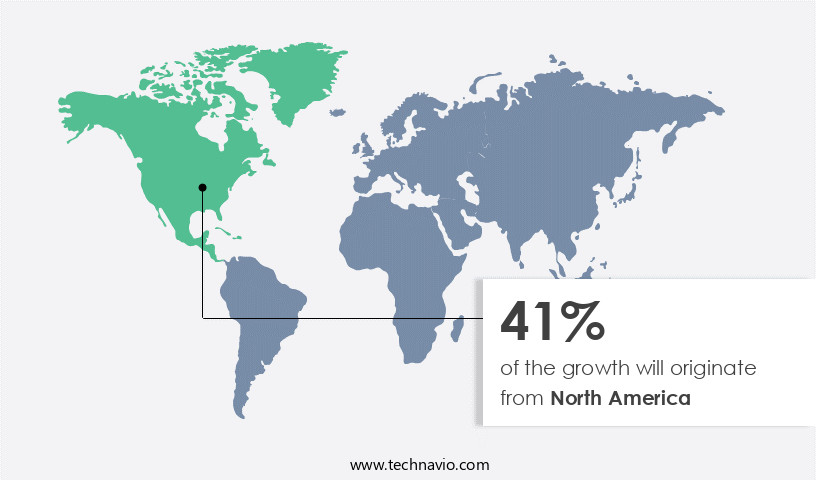
  • North America dominated the market and accounted for a 41% growth during the forecast period.
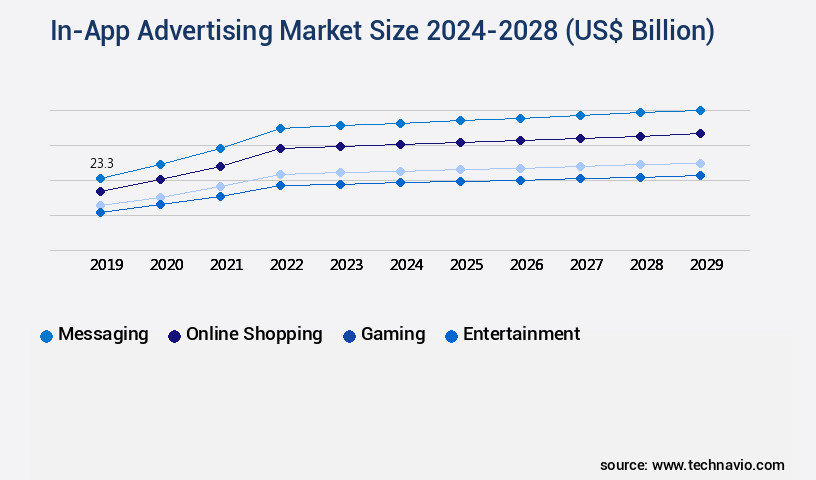
  • By Application - Messaging segment was valued at USD 19.60 billion in 2022
  • By Type - Banner ads segment accounted for the largest market revenue share in 2022

Market Size & Forecast

  • Market Opportunities: USD 663.47 billion
  • Market Future Opportunities: USD 338.30 billion
  • CAGR from 2023 to 2028 : 26.06%

Market Summary

  • The market represents a dynamic and continually evolving landscape, driven by the increasing use of smartphones and the surge in in-app purchases. According to recent data, mobile apps are projected to generate over 50% of all digital advertising spend by 2023. However, this market also faces challenges, such as the growing adoption of ad-blocking software, which restricts the reach of in-app ads. Core technologies like location-based targeting and programmatic advertising are transforming the way brands engage with consumers within apps.
  • Service types, such as rewarded ads and native ads, are gaining popularity due to their non-intrusive nature. Regulations, such as the General Data Protection Regulation (GDPR) and the Children's Online Privacy Protection Act (COPPA), are shaping the market by enforcing stricter privacy guidelines. These trends and challenges create a complex ecosystem, requiring businesses to stay informed and adapt to the ever-changing market conditions.

What will be the Size of the In-App Advertising Market during the forecast period?

In-App Advertising Market Size

Get Key Insights on Market Forecast (PDF) Request Free Sample

How is the In-App Advertising Market Segmented ?

The in-app advertising industry research report provides comprehensive data (region-wise segment analysis), with forecasts and estimates in "USD billion" for the period 2024-2028, as well as historical data from 2018-2022 for the following segments.

  • Application
    • Messaging
    • Online shopping
    • Gaming
    • Entertainment
    • Others
  • Type
    • Banner ads
    • Interstitial ads
    • Rich media ads
    • Video ads
    • Native ads
  • Geography
    • North America
      • US
    • Europe
      • Germany
      • UK
    • APAC
      • China
      • India
    • Rest of World (ROW)

By Application Insights

The messaging segment is estimated to witness significant growth during the forecast period.

In-app advertising within messaging applications, encompassing social, business, and chat platforms, has witnessed significant growth due to their substantial user bases and high engagement rates. Messaging apps have emerged as a popular advertising venue, with strategies such as sponsored messages, chatbots, and influencer marketing gaining traction. Sponsored messages involve advertisers paying to display their content within a user's messaging app, like a company's message appearing atop a WhatsApp or Facebook Messenger conversation list. Cost per click (CPC) plays a crucial role in in-app advertising, with real-time bidding (RTB) and programmatic advertising enabling efficient ad placement based on audience targeting and conversion rate optimization.

Ad fraud detection is essential to maintaining trust and transparency within the market, while playable ads and native ads enhance user experience. Fill rate, interstitial ads, and ad creative optimization are essential components of monetization strategies. Attribution modeling, ad mediation, app install ads, banner ads, and user engagement metrics are other essential aspects of the in-app advertising landscape. Click-through rate (CTR) and cost per mille (CPM) are crucial performance indicators, with rich media ads and video ads offering enhanced user engagement. A/B testing and ad personalization further optimize ad performance, while impression tracking and rewarded video ads cater to user preferences.

The market is projected to expand further, with conversion rates expected to increase by 18.3% in the next year. Additionally, the industry anticipates a 21.5% rise in programmatic advertising adoption. These trends underscore the ongoing evolution and dynamic nature of the market.

In-App Advertising Market Size

Request Free Sample

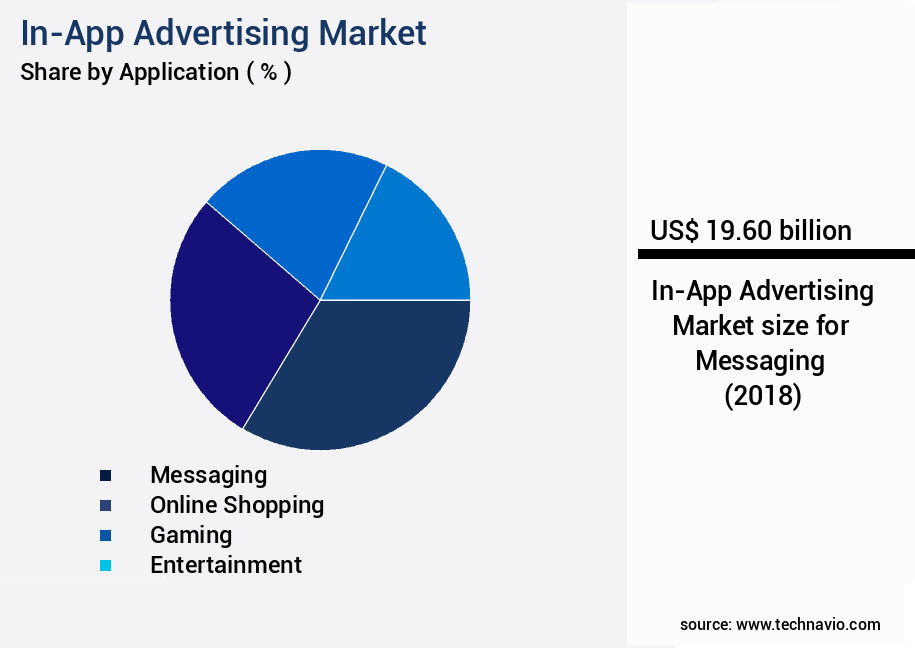
The Messaging segment was valued at USD 19.60 billion in 2018 and showed a gradual increase during the forecast period.

In-App Advertising Market Size

Request Free Sample

Regional Analysis

North America is estimated to contribute 41% to the growth of the global market during the forecast period.Technavio's analysts have elaborately explained the regional trends and drivers that shape the market during the forecast period.

In-App Advertising Market Share by Geography

See How In-App Advertising Market Demand is Rising in North America Request Free Sample

The market in North America is a significant and established sector, fueled by the widespread use of smartphones and the increasing reliance on mobile applications. A report by App Annie reveals that the average North American user spends approximately 3 hours daily on mobile devices, with 90% of this engagement occurring within mobile apps. This high level of engagement creates a valuable opportunity for advertisers to connect with their intended audience through in-app advertising.

The market's growth is underpinned by the increasing popularity of mobile apps and the substantial time users spend engaging with them.

Market Dynamics

Our researchers analyzed the data with 2023 as the base year, along with the key drivers, trends, and challenges. A holistic analysis of drivers will help companies refine their marketing strategies to gain a competitive advantage.

The market is a dynamic and intricate landscape, encompassing various mobile ad formats and monetization strategies. Effective rewarded video ad strategies continue to outperform other formats, offering users value in exchange for engagement. Banner ads, meanwhile, require meticulous optimization to boost click-through rates. In-app purchase ads present unique challenges, necessitating rigorous performance measurement. Interstitial ads, when strategically placed, can generate substantial revenue for app developers. However, excessive ad frequency can negatively impact user retention. Targeting techniques play a crucial role in mobile ad formats, with personalized ads based on user behavior driving higher engagement. A/B testing is an effective tool for optimizing ad performance, while ad fraud detection and prevention are essential for maintaining trust and revenue.

Programmatic advertising maximizes ad revenue, enabling real-time bidding and automated ad placements. Building a robust ad tech stack for mobile apps is essential for staying competitive, ensuring compliance with advertising regulations for mobile games, and measuring the effectiveness of in-app ad campaigns. Contextual ads improve user experience by delivering relevant content, while analyzing user engagement metrics for different ad formats provides valuable insights. Data security best practices and user privacy considerations are paramount in mobile advertising, with the industrial application segment accounting for a significantly larger share than the academic segment in terms of investment.

Adoption rates for in-app advertising in the gaming sector are nearly double those in non-gaming apps, underscoring the sector's potential. As the market continues to evolve, staying informed and adaptive will be key to success.

In-App Advertising Market Size

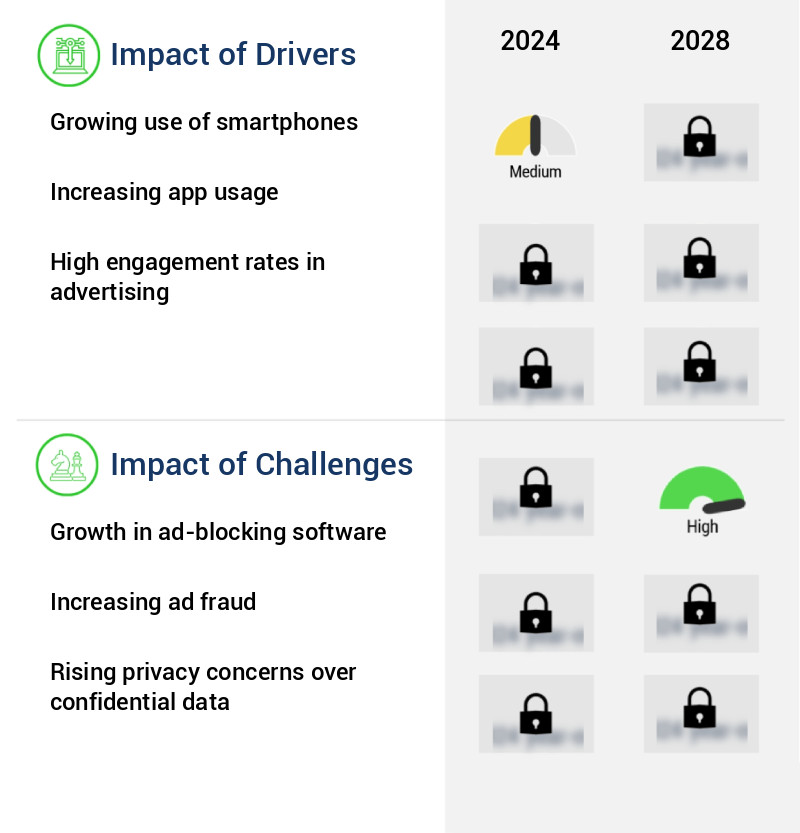
What are the key market drivers leading to the rise in the adoption of In-App Advertising Industry?

  • The increasing prevalence of smartphone usage serves as the primary catalyst for market growth. 
  • The mobile application market has experienced remarkable expansion, driven by the widespread adoption of smartphones. This growth trend significantly benefits in-app advertising, which has emerged as the leading mobile advertising format. EMarketer projects that in-app advertising will constitute 68% of US mobile advertising expenditures in 2021.
  • This data underscores the immense potential for businesses to engage consumers through in-app advertising, making it an essential strategy for reaching a vast and diverse audience.

What are the market trends shaping the In-App Advertising Industry?

  • The trend in the market is toward increasing in-app purchases. In-app purchases are experiencing significant growth.
  • The in-app purchasing trend has significantly fueled the expansion of the market. In-app purchases enable users to buy digital commodities or services within applications, including virtual items, premium content, and subscriptions. This new revenue avenue has expanded the scope for in-app advertising, generating increased opportunities for businesses to engage consumers. According to App Annie's data, consumer spending on in-app purchases is projected to reach USD270 billion by 2025, representing a substantial increase from the USD120 billion recorded in 2019.
  • The burgeoning popularity of in-app purchases has created a substantial market for companies to tap into through in-app advertising. 

What challenges does the In-App Advertising Industry face during its growth?

  • The increasing adoption of ad-blocking software poses a significant challenge to the growth of the digital advertising industry. 
  • Ad-blocking software usage has significantly impacted the market. According to recent data, approximately 780 million devices worldwide employed ad-blocking technology in 2021, representing a substantial increase from the 650 million reported in 2018. This trend poses a challenge for advertisers attempting to reach their intended audiences within mobile applications. Ad-blocking software integration into mobile web browsers complicates matters further, as it restricts advertisements from being displayed. Moreover, the growing adoption of ad-blocking software on devices indicates a shift in user behavior, with many individuals opting to avoid seeing ads while browsing or using applications.
  • This trend has far-reaching consequences for the advertising industry. In-app advertising, a crucial segment of the digital advertising market, faces a decline in effectiveness due to the increasing use of ad-blocking software. As the market continues to evolve, advertisers must adapt to this changing landscape and explore new strategies to engage audiences effectively.

Exclusive Technavio Analysis on Customer Landscape

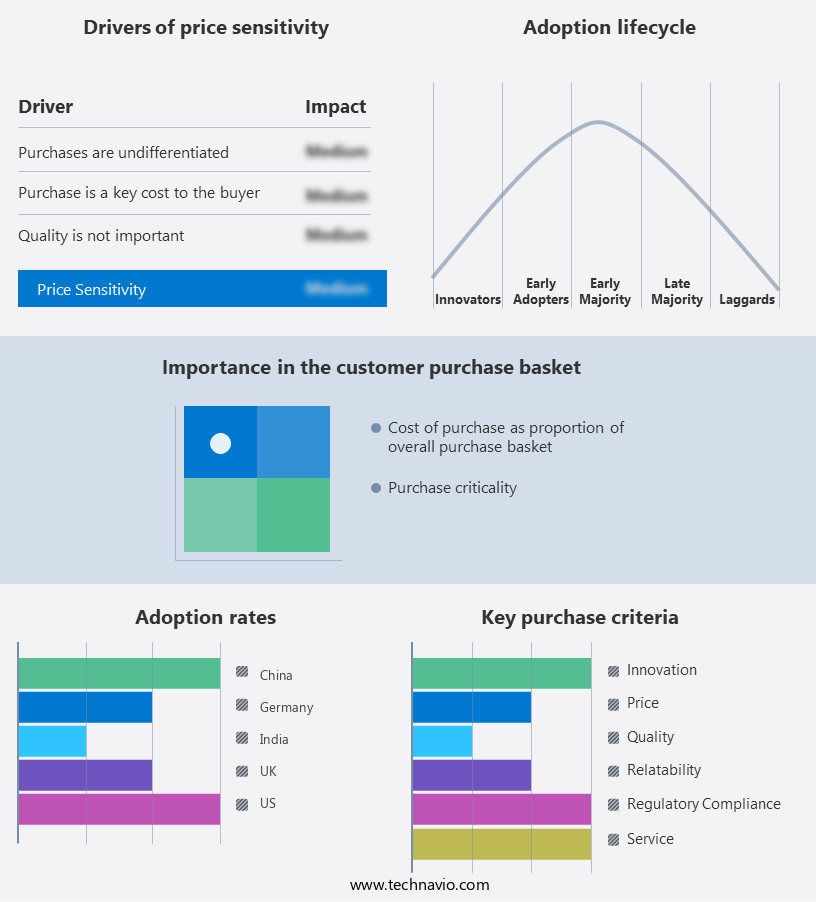
The in-app advertising market forecasting report includes the adoption lifecycle of the market, covering from the innovator's stage to the laggard's stage. It focuses on adoption rates in different regions based on penetration. Furthermore, the in-app advertising market report also includes key purchase criteria and drivers of price sensitivity to help companies evaluate and develop their market growth analysis strategies.

In-App Advertising Market Share by Geography

 Customer Landscape of In-App Advertising Industry

Competitive Landscape

Companies are implementing various strategies, such as strategic alliances, in-app advertising market forecast, partnerships, mergers and acquisitions, geographical expansion, and product/service launches, to enhance their presence in the industry.

Adscompass - The company provides advertisers with a range of effective and compelling advertising solutions, catering to both brand and performance marketing objectives. These options showcase unique value propositions, enhancing marketing campaigns' overall impact.

The industry research and growth report includes detailed analyses of the competitive landscape of the market and information about key companies, including:

  • Adscompass
  • Alphabet Inc.
  • Amazon.com Inc.
  • Azerion Group N.V
  • Bidease inc.
  • BYYD Inc
  • Coalition Technologies LLC
  • Digital Hamster SL
  • Dot Com Infoway
  • Flatline Agency
  • Hitapps 
  • IDS Logic
  • InMobi Pte. Ltd.
  • Mobio Global Ltd.
  • PubMatic Inc.
  • RevX 
  • Tremor International Ltd.
  • TUNE Inc.
  • Yahoo
  • zoomd technologies Ltd.

Qualitative and quantitative analysis of companies has been conducted to help clients understand the wider business environment as well as the strengths and weaknesses of key industry players. Data is qualitatively analyzed to categorize companies as pure play, category-focused, industry-focused, and diversified; it is quantitatively analyzed to categorize companies as dominant, leading, strong, tentative, and weak.

Recent Development and News in In-App Advertising Market

  • In January 2024, mobile gaming giant Tencent Holdings Ltd. Announced the launch of its new in-app advertising platform, "Tencent AdEx," which allows small and medium-sized enterprises (SMEs) to target ads to specific demographics within its popular mobile games (Reuters).
  • In March 2024, Google and Microsoft formed a strategic partnership to integrate Microsoft's advertising technology into Google Ads, expanding Microsoft's reach in the market (Google Press Release).
  • In April 2024, mobile advertising platform InMobi raised USD200 million in a Series F funding round, bringing its total funding to over USD1.3 billion and solidifying its position as a major player in the market (TechCrunch).
  • In May 2025, Apple unveiled its latest iOS update, introducing new privacy features that limit the collection and use of user data for targeted in-app advertising, potentially disrupting the market and forcing advertisers to adapt their strategies (Apple Press Release).

Dive into Technavio's robust research methodology, blending expert interviews, extensive data synthesis, and validated models for unparalleled In-App Advertising Market insights. See full methodology.

Market Scope

Report Coverage

Details

Page number

163

Base year

2023

Historic period

2018-2022

Forecast period

2024-2028

Growth momentum & CAGR

Accelerate at a CAGR of 26.06%

Market growth 2024-2028

USD 338.3 billion

Market structure

Fragmented

YoY growth 2023-2024(%)

21.63

Key countries

US, China, India, Germany, and UK

Competitive landscape

Leading Companies, Market Positioning of Companies, Competitive Strategies, and Industry Risks

Request Free Sample

Research Analyst Overview

  • In the ever-evolving landscape of in-app advertising, cost per click (CPC) continues to be a significant metric shaping market dynamics. Real-time bidding (RTB) and programmatic advertising have revolutionized the way brands reach their target audience, enabling more efficient and data-driven ad placements. Audience targeting has become increasingly sophisticated, with conversion rate serving as a crucial performance indicator. Ad fraud detection is a critical concern, with advanced technologies continually emerging to combat fraudulent activities. Playable ads and native ads have gained traction due to their user-friendly nature and high engagement rates. Fill rate and impression tracking are essential components of ad serving platforms and ad networks, ensuring optimal ad delivery and maximizing revenue.
  • Interstitial ads, ad creative optimization, and ad personalization have seen varying adoption rates, with user experience playing a pivotal role in their success. Incentivized ads, app install ads, and banner ads remain popular monetization strategies, while attribution modeling and ad mediation help marketers understand the impact of their campaigns. Rich media ads, cost per mille (CPM), and video ads are essential formats, each offering unique advantages. A/B testing and user engagement metrics are integral to continuous improvement and optimization. Ad exchanges and rewarded video ads are other evolving trends, shaping the future of in-app advertising. Ad networks and ad serving platforms play a vital role in facilitating the buying and selling of ad inventory, enabling brands to reach their desired audience effectively.
  • Click-through rate and user experience are essential performance indicators, with ad personalization and ad optimization strategies playing a crucial role in enhancing user engagement. In summary, the market is characterized by continuous innovation and adaptation, with various trends and metrics shaping its evolution. From cost per click to user engagement metrics, each component plays a vital role in optimizing ad performance and driving revenue growth.

What are the Key Data Covered in this In-App Advertising Market Research and Growth Report?

  • What is the expected growth of the In-App Advertising Market between 2024 and 2028?

    • USD 338.3 billion, at a CAGR of 26.06%

  • What segmentation does the market report cover?

    • The report is segmented by Application (Messaging, Online shopping, Gaming, Entertainment, and Others), Type (Banner ads, Interstitial ads, Rich media ads, Video ads, and Native ads), and Geography (North America, Europe, APAC, South America, and Middle East and Africa)

  • Which regions are analyzed in the report?

    • North America, Europe, APAC, South America, and Middle East and Africa

  • What are the key growth drivers and market challenges?

    • Growing use of smartphones, Growth in ad-blocking software

  • Who are the major players in the In-App Advertising Market?

    • Adscompass, Alphabet Inc., Amazon.com Inc., Azerion Group N.V, Bidease inc., BYYD Inc, Coalition Technologies LLC, Digital Hamster SL, Dot Com Infoway, Flatline Agency, Hitapps , IDS Logic, InMobi Pte. Ltd., Mobio Global Ltd., PubMatic Inc., RevX , Tremor International Ltd., TUNE Inc., Yahoo, and zoomd technologies Ltd.

Market Research Insights

  • In-app advertising continues to be a dynamic and essential component of digital marketing strategies. According to recent estimates, global in-app advertising spend is projected to reach USD250 billion by 2025, representing a significant compound annual growth rate. This growth is driven by the increasing prevalence of interactive ads, including campaign management, social media ads, behavioral ads, and in-app purchase ads, among others. Moreover, advanced targeting parameters, such as user segmentation and ad scheduling, enable businesses to reach their desired audience effectively. Inventory management, supply-side platforms, and demand-side platforms facilitate efficient ad delivery and revenue generation.
  • Cross-promotion ads and ad tech stacks further optimize return on investment (ROI) and personalize user experiences. Ad relevance, ad quality, and frequency capping are crucial factors ensuring user engagement and ad compliance. Mobile ad formats, such as gamified ads and contextual ads, cater to diverse user preferences. Measurement tools and analytics dashboards provide valuable insights for continuous optimization and improvement. Data security and user privacy are also prioritized through robust ad tech solutions, ensuring a secure and ethical advertising ecosystem. Click fraud prevention and location-based ads further enhance the overall effectiveness of in-app advertising campaigns.

We can help! Our analysts can customize this in-app advertising market research report to meet your requirements.

Get in touch

1 Executive Summary

  • 1.1 Market overview
    • Executive Summary - Chart on Market Overview
    • Executive Summary - Data Table on Market Overview
    • Executive Summary - Chart on Global Market Characteristics
    • Executive Summary - Chart on Market by Geography
    • Executive Summary - Chart on Market Segmentation by Application
    • Executive Summary - Chart on Market Segmentation by Type
    • Executive Summary - Chart on Incremental Growth
    • Executive Summary - Data Table on Incremental Growth
    • Executive Summary - Chart on Company Market Positioning

2 Market Landscape

  • 2.1 Market ecosystem
    • Parent Market
    • Data Table on - Parent Market
  • 2.2 Market characteristics
    • Market characteristics analysis
  • 2.3 Value chain analysis
    • Value Chain Analysis

3 Market Sizing

  • 3.1 Market definition
    • Offerings of companies included in the market definition
  • 3.2 Market segment analysis
    • Market segments
  • 3.3 Market size 2023
    • 3.4 Market outlook: Forecast for 2023-2028
      • Chart on Global - Market size and forecast 2023-2028 ($ billion)
      • Data Table on Global - Market size and forecast 2023-2028 ($ billion)
      • Chart on Global Market: Year-over-year growth 2023-2028 (%)
      • Data Table on Global Market: Year-over-year growth 2023-2028 (%)

    4 Historic Market Size

    • 4.1 Global In-App Advertising Market 2018 - 2022
      • Historic Market Size - Data Table on Global In-App Advertising Market 2018 - 2022 ($ billion)
    • 4.2 Application segment analysis 2018 - 2022
      • Historic Market Size - Application Segment 2018 - 2022 ($ billion)
    • 4.3 Type segment analysis 2018 - 2022
      • Historic Market Size - Type Segment 2018 - 2022 ($ billion)
    • 4.4 Geography segment analysis 2018 - 2022
      • Historic Market Size - Geography Segment 2018 - 2022 ($ billion)
    • 4.5 Country segment analysis 2018 - 2022
      • Historic Market Size - Country Segment 2018 - 2022 ($ billion)

    5 Five Forces Analysis

    • 5.1 Five forces summary
      • Five forces analysis - Comparison between 2023 and 2028
    • 5.2 Bargaining power of buyers
      • Bargaining power of buyers - Impact of key factors 2023 and 2028
    • 5.3 Bargaining power of suppliers
      • Bargaining power of suppliers - Impact of key factors in 2023 and 2028
    • 5.4 Threat of new entrants
      • Threat of new entrants - Impact of key factors in 2023 and 2028
    • 5.5 Threat of substitutes
      • Threat of substitutes - Impact of key factors in 2023 and 2028
    • 5.6 Threat of rivalry
      • Threat of rivalry - Impact of key factors in 2023 and 2028
    • 5.7 Market condition
      • Chart on Market condition - Five forces 2023 and 2028

    6 Market Segmentation by Application

    • 6.1 Market segments
      • Chart on Application - Market share 2023-2028 (%)
      • Data Table on Application - Market share 2023-2028 (%)
    • 6.2 Comparison by Application
      • Chart on Comparison by Application
      • Data Table on Comparison by Application
    • 6.3 Messaging - Market size and forecast 2023-2028
      • Chart on Messaging - Market size and forecast 2023-2028 ($ billion)
      • Data Table on Messaging - Market size and forecast 2023-2028 ($ billion)
      • Chart on Messaging - Year-over-year growth 2023-2028 (%)
      • Data Table on Messaging - Year-over-year growth 2023-2028 (%)
    • 6.4 Online shopping - Market size and forecast 2023-2028
      • Chart on Online shopping - Market size and forecast 2023-2028 ($ billion)
      • Data Table on Online shopping - Market size and forecast 2023-2028 ($ billion)
      • Chart on Online shopping - Year-over-year growth 2023-2028 (%)
      • Data Table on Online shopping - Year-over-year growth 2023-2028 (%)
    • 6.5 Gaming - Market size and forecast 2023-2028
      • Chart on Gaming - Market size and forecast 2023-2028 ($ billion)
      • Data Table on Gaming - Market size and forecast 2023-2028 ($ billion)
      • Chart on Gaming - Year-over-year growth 2023-2028 (%)
      • Data Table on Gaming - Year-over-year growth 2023-2028 (%)
    • 6.6 Entertainment - Market size and forecast 2023-2028
      • Chart on Entertainment - Market size and forecast 2023-2028 ($ billion)
      • Data Table on Entertainment - Market size and forecast 2023-2028 ($ billion)
      • Chart on Entertainment - Year-over-year growth 2023-2028 (%)
      • Data Table on Entertainment - Year-over-year growth 2023-2028 (%)
    • 6.7 Others - Market size and forecast 2023-2028
      • Chart on Others - Market size and forecast 2023-2028 ($ billion)
      • Data Table on Others - Market size and forecast 2023-2028 ($ billion)
      • Chart on Others - Year-over-year growth 2023-2028 (%)
      • Data Table on Others - Year-over-year growth 2023-2028 (%)
    • 6.8 Market opportunity by Application
      • Market opportunity by Application ($ billion)
      • Data Table on Market opportunity by Application ($ billion)

    7 Market Segmentation by Type

    • 7.1 Market segments
      • Chart on Type - Market share 2023-2028 (%)
      • Data Table on Type - Market share 2023-2028 (%)
    • 7.2 Comparison by Type
      • Chart on Comparison by Type
      • Data Table on Comparison by Type
    • 7.3 Banner ads - Market size and forecast 2023-2028
      • Chart on Banner ads - Market size and forecast 2023-2028 ($ billion)
      • Data Table on Banner ads - Market size and forecast 2023-2028 ($ billion)
      • Chart on Banner ads - Year-over-year growth 2023-2028 (%)
      • Data Table on Banner ads - Year-over-year growth 2023-2028 (%)
    • 7.4 Interstitial ads - Market size and forecast 2023-2028
      • Chart on Interstitial ads - Market size and forecast 2023-2028 ($ billion)
      • Data Table on Interstitial ads - Market size and forecast 2023-2028 ($ billion)
      • Chart on Interstitial ads - Year-over-year growth 2023-2028 (%)
      • Data Table on Interstitial ads - Year-over-year growth 2023-2028 (%)
    • 7.5 Rich media ads - Market size and forecast 2023-2028
      • Chart on Rich media ads - Market size and forecast 2023-2028 ($ billion)
      • Data Table on Rich media ads - Market size and forecast 2023-2028 ($ billion)
      • Chart on Rich media ads - Year-over-year growth 2023-2028 (%)
      • Data Table on Rich media ads - Year-over-year growth 2023-2028 (%)
    • 7.6 Video ads - Market size and forecast 2023-2028
      • Chart on Video ads - Market size and forecast 2023-2028 ($ billion)
      • Data Table on Video ads - Market size and forecast 2023-2028 ($ billion)
      • Chart on Video ads - Year-over-year growth 2023-2028 (%)
      • Data Table on Video ads - Year-over-year growth 2023-2028 (%)
    • 7.7 Native ads - Market size and forecast 2023-2028
      • Chart on Native ads - Market size and forecast 2023-2028 ($ billion)
      • Data Table on Native ads - Market size and forecast 2023-2028 ($ billion)
      • Chart on Native ads - Year-over-year growth 2023-2028 (%)
      • Data Table on Native ads - Year-over-year growth 2023-2028 (%)
    • 7.8 Market opportunity by Type
      • Market opportunity by Type ($ billion)
      • Data Table on Market opportunity by Type ($ billion)

    8 Customer Landscape

    • 8.1 Customer landscape overview
      • Analysis of price sensitivity, lifecycle, customer purchase basket, adoption rates, and purchase criteria

    9 Geographic Landscape

    • 9.1 Geographic segmentation
      • Chart on Market share by geography 2023-2028 (%)
      • Data Table on Market share by geography 2023-2028 (%)
    • 9.2 Geographic comparison
      • Chart on Geographic comparison
      • Data Table on Geographic comparison
    • 9.3 North America - Market size and forecast 2023-2028
      • Chart on North America - Market size and forecast 2023-2028 ($ billion)
      • Data Table on North America - Market size and forecast 2023-2028 ($ billion)
      • Chart on North America - Year-over-year growth 2023-2028 (%)
      • Data Table on North America - Year-over-year growth 2023-2028 (%)
    • 9.4 Europe - Market size and forecast 2023-2028
      • Chart on Europe - Market size and forecast 2023-2028 ($ billion)
      • Data Table on Europe - Market size and forecast 2023-2028 ($ billion)
      • Chart on Europe - Year-over-year growth 2023-2028 (%)
      • Data Table on Europe - Year-over-year growth 2023-2028 (%)
    • 9.5 APAC - Market size and forecast 2023-2028
      • Chart on APAC - Market size and forecast 2023-2028 ($ billion)
      • Data Table on APAC - Market size and forecast 2023-2028 ($ billion)
      • Chart on APAC - Year-over-year growth 2023-2028 (%)
      • Data Table on APAC - Year-over-year growth 2023-2028 (%)
    • 9.6 South America - Market size and forecast 2023-2028
      • Chart on South America - Market size and forecast 2023-2028 ($ billion)
      • Data Table on South America - Market size and forecast 2023-2028 ($ billion)
      • Chart on South America - Year-over-year growth 2023-2028 (%)
      • Data Table on South America - Year-over-year growth 2023-2028 (%)
    • 9.7 Middle East and Africa - Market size and forecast 2023-2028
      • Chart on Middle East and Africa - Market size and forecast 2023-2028 ($ billion)
      • Data Table on Middle East and Africa - Market size and forecast 2023-2028 ($ billion)
      • Chart on Middle East and Africa - Year-over-year growth 2023-2028 (%)
      • Data Table on Middle East and Africa - Year-over-year growth 2023-2028 (%)
    • 9.8 US - Market size and forecast 2023-2028
      • Chart on US - Market size and forecast 2023-2028 ($ billion)
      • Data Table on US - Market size and forecast 2023-2028 ($ billion)
      • Chart on US - Year-over-year growth 2023-2028 (%)
      • Data Table on US - Year-over-year growth 2023-2028 (%)
    • 9.9 China - Market size and forecast 2023-2028
      • Chart on China - Market size and forecast 2023-2028 ($ billion)
      • Data Table on China - Market size and forecast 2023-2028 ($ billion)
      • Chart on China - Year-over-year growth 2023-2028 (%)
      • Data Table on China - Year-over-year growth 2023-2028 (%)
    • 9.10 India - Market size and forecast 2023-2028
      • Chart on India - Market size and forecast 2023-2028 ($ billion)
      • Data Table on India - Market size and forecast 2023-2028 ($ billion)
      • Chart on India - Year-over-year growth 2023-2028 (%)
      • Data Table on India - Year-over-year growth 2023-2028 (%)
    • 9.11 Germany - Market size and forecast 2023-2028
      • Chart on Germany - Market size and forecast 2023-2028 ($ billion)
      • Data Table on Germany - Market size and forecast 2023-2028 ($ billion)
      • Chart on Germany - Year-over-year growth 2023-2028 (%)
      • Data Table on Germany - Year-over-year growth 2023-2028 (%)
    • 9.12 UK - Market size and forecast 2023-2028
      • Chart on UK - Market size and forecast 2023-2028 ($ billion)
      • Data Table on UK - Market size and forecast 2023-2028 ($ billion)
      • Chart on UK - Year-over-year growth 2023-2028 (%)
      • Data Table on UK - Year-over-year growth 2023-2028 (%)
    • 9.13 Market opportunity by geography
      • Market opportunity by geography ($ billion)
      • Data Tables on Market opportunity by geography ($ billion)

    10 Drivers, Challenges, and Opportunity/Restraints

    • 10.1 Market drivers
      • 10.2 Market challenges
        • 10.3 Impact of drivers and challenges
          • Impact of drivers and challenges in 2023 and 2028
        • 10.4 Market opportunities/restraints

          11 Competitive Landscape

          • 11.1 Overview
            • 11.2 Competitive Landscape
              • Overview on criticality of inputs and factors of differentiation
            • 11.3 Landscape disruption
              • Overview on factors of disruption
            • 11.4 Industry risks
              • Impact of key risks on business

            12 Competitive Analysis

            • 12.1 Companies profiled
              • Companies covered
            • 12.2 Market positioning of companies
              • Matrix on companies position and classification
            • 12.3 Adscompass
              • Adscompass - Overview
              • Adscompass - Product / Service
              • Adscompass - Key offerings
            • 12.4 Alphabet Inc.
              • Alphabet Inc. - Overview
              • Alphabet Inc. - Business segments
              • Alphabet Inc. - Key offerings
              • Alphabet Inc. - Segment focus
            • 12.5 Bidease inc.
              • Bidease inc. - Overview
              • Bidease inc. - Product / Service
              • Bidease inc. - Key offerings
            • 12.6 BYYD Inc
              • BYYD Inc - Overview
              • BYYD Inc - Product / Service
              • BYYD Inc - Key offerings
            • 12.7 Coalition Technologies LLC
              • Coalition Technologies LLC - Overview
              • Coalition Technologies LLC - Product / Service
              • Coalition Technologies LLC - Key offerings
            • 12.8 Digital Hamster SL
              • Digital Hamster SL - Overview
              • Digital Hamster SL - Product / Service
              • Digital Hamster SL - Key offerings
            • 12.9 Dot Com Infoway
              • Dot Com Infoway - Overview
              • Dot Com Infoway - Product / Service
              • Dot Com Infoway - Key offerings
            • 12.10 IDS Logic
              • IDS Logic - Overview
              • IDS Logic - Product / Service
              • IDS Logic - Key offerings
            • 12.11 InMobi Pte. Ltd.
              • InMobi Pte. Ltd. - Overview
              • InMobi Pte. Ltd. - Product / Service
              • InMobi Pte. Ltd. - Key offerings
            • 12.12 Mobio Global Ltd.
              • Mobio Global Ltd. - Overview
              • Mobio Global Ltd. - Product / Service
              • Mobio Global Ltd. - Key offerings
            • 12.13 RevX
              • RevX  - Overview
              • RevX  - Product / Service
              • RevX  - Key offerings
            • 12.14 Tremor International Ltd.
              • Tremor International Ltd. - Overview
              • Tremor International Ltd. - Product / Service
              • Tremor International Ltd. - Key offerings
            • 12.15 TUNE Inc.
              • TUNE Inc. - Overview
              • TUNE Inc. - Product / Service
              • TUNE Inc. - Key offerings
            • 12.16 Yahoo
              • Yahoo - Overview
              • Yahoo - Product / Service
              • Yahoo - Key offerings
            • 12.17 zoomd technologies Ltd.
              • zoomd technologies Ltd. - Overview
              • zoomd technologies Ltd. - Product / Service
              • zoomd technologies Ltd. - Key offerings

            13 Appendix

            • 13.1 Scope of the report
              • 13.2 Inclusions and exclusions checklist
                • Inclusions checklist
                • Exclusions checklist
              • 13.3 Currency conversion rates for US$
                • Currency conversion rates for US$
              • 13.4 Research methodology
                • Research methodology
              • 13.5 Data procurement
                • Information sources
              • 13.6 Data validation
                • Data validation
              • 13.7 Validation techniques employed for market sizing
                • Validation techniques employed for market sizing
              • 13.8 Data synthesis
                • Data synthesis
              • 13.9 360 degree market analysis
                • 360 degree market analysis
              • 13.10 List of abbreviations
                • List of abbreviations

              Research Methodology

              Technavio presents a detailed picture of the market by way of study, synthesis, and summation of data from multiple sources. The analysts have presented the various facets of the market with a particular focus on identifying the key industry influencers. The data thus presented is comprehensive, reliable, and the result of extensive research, both primary and secondary.

              INFORMATION SOURCES

              Primary sources

              • Manufacturers and suppliers
              • Channel partners
              • Industry experts
              • Strategic decision makers

              Secondary sources

              • Industry journals and periodicals
              • Government data
              • Financial reports of key industry players
              • Historical data
              • Press releases

              DATA ANALYSIS

              Data Synthesis

              • Collation of data
              • Estimation of key figures
              • Analysis of derived insights

              Data Validation

              • Triangulation with data models
              • Reference against proprietary databases
              • Corroboration with industry experts

              REPORT WRITING

              Qualitative

              • Market drivers
              • Market challenges
              • Market trends
              • Five forces analysis

              Quantitative

              • Market size and forecast
              • Market segmentation
              • Geographical insights
              • Competitive landscape

              Interested in this report?

              Get your sample now to see our research methodology and insights!

              Download Now

              Frequently Asked Questions

              In-App Advertising market growth will increase by $ 338.3 bn during 2024-2028 .

              The In-App Advertising market is expected to grow at a CAGR of 26.06% during 2024-2028 .

              In-App Advertising market is segmented by Application( Messaging, Online shopping, Gaming, Entertainment, Others) Type( Banner ads, Interstitial ads, Rich media ads, Video ads, Native ads)

              Adscompass, Alphabet Inc., Amazon.com Inc., Azerion Group N.V, Bidease inc., BYYD Inc, Coalition Technologies LLC, Digital Hamster SL, Dot Com Infoway, Flatline Agency, Hitapps , IDS Logic, InMobi Pte. Ltd., Mobio Global Ltd., PubMatic Inc., RevX , Tremor International Ltd., TUNE Inc., Yahoo, zoomd technologies Ltd. are a few of the key vendors in the In-App Advertising market.

              North America will register the highest growth rate of 41% among the other regions. Therefore, the In-App Advertising market in North America is expected to garner significant business opportunities for the vendors during the forecast period.

              US, China, India, Germany, UK

              • Growing use of smartphonesThe increasing popularity of smartphones has led to a surge in the number of mobile applications available for download is the driving factor this market.
              • which has is the driving factor this market.
              • in turn is the driving factor this market.
              • led to an increase in the number of opportunities for in-app advertising.According to Statista is the driving factor this market.
              • the number of smartphone users globally was expected to increase by a total of 1.5 billion users is the driving factor this market.
              • representing a significant growth of 30.6 percent is the driving factor this market.
              • between 2024 and 2029. This rapid growth in smartphone usage has created a huge opportunity for companies to reach consumers through in-app advertising. In fact is the driving factor this market.
              • in-app advertising has become the dominant form of mobile advertising is the driving factor this market.
              • with eMarketer estimating that it will account for 69% of all mobile advertising spending in the US in 2021.According to a report from App Annie is the driving factor this market.
              • the average person spent 4.2 hours per day on their smartphone in 2020 is the driving factor this market.
              • up from 3.7 hours in 2019. This increase in screen time has created more opportunities for companies to reach consumers through in-app advertising. Therefore is the driving factor this market.
              • the growing use of smartphones has created a massive opportunity for in-app advertising and will drive the growth of the global in-app advertising market during the forecast period. is the driving factor this market.

              The In-App Advertising market vendors should focus on grabbing business opportunities from the Messaging segment as it accounted for the largest market share in the base year.