In-game Advertising (IGA) Market Analysis, Size, and Forecast 2026-2030: North America (US, Canada, and Mexico), APAC (China, Japan, and South Korea), Europe (Germany, UK, and France), Middle East and Africa (South Africa, Saudi Arabia, and UAE), South America (Brazil, Argentina, and Colombia), and Rest of World (ROW)

In-game Advertising (IGA) Market Analysis, Size, and Forecast 2026-2030:
North America (US, Canada, and Mexico), APAC (China, Japan, and South Korea), Europe (Germany, UK, and France), Middle East and Africa (South Africa, Saudi Arabia, and UAE), South America (Brazil, Argentina, and Colombia), and Rest of World (ROW)

Published: Mar 2026 298 Pages SKU: IRTNTR43136

Market Overview at a Glance

$85.02 B
Market Opportunity
11.2%
CAGR 2025 - 2030
35.6%
North America Growth
$54.71 B
Mobile segment 2024

In-game Advertising (IGA) Market Size 2026-2030

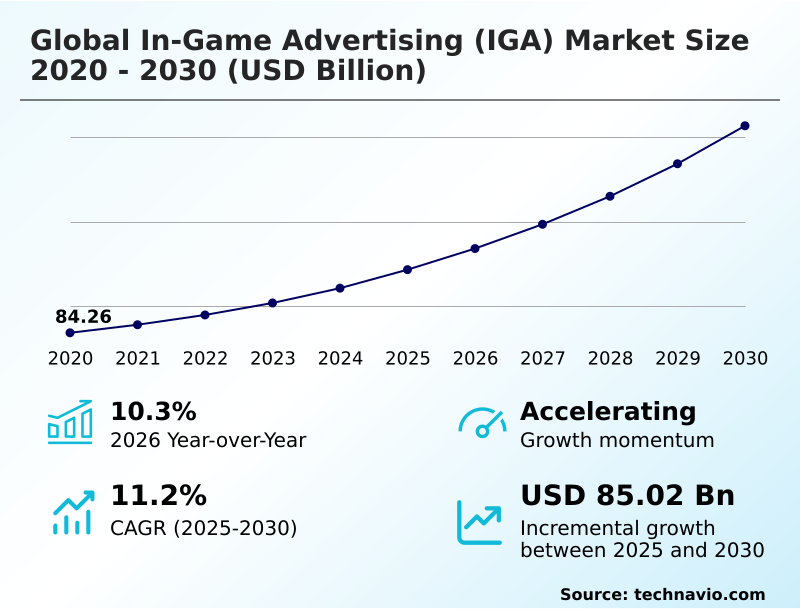
The in-game advertising (iga) market size is valued to increase by USD 85.02 billion, at a CAGR of 11.2% from 2025 to 2030. Proliferation of intrinsic and non-intrusive advertising formats will drive the in-game advertising (iga) market.

Major Market Trends & Insights

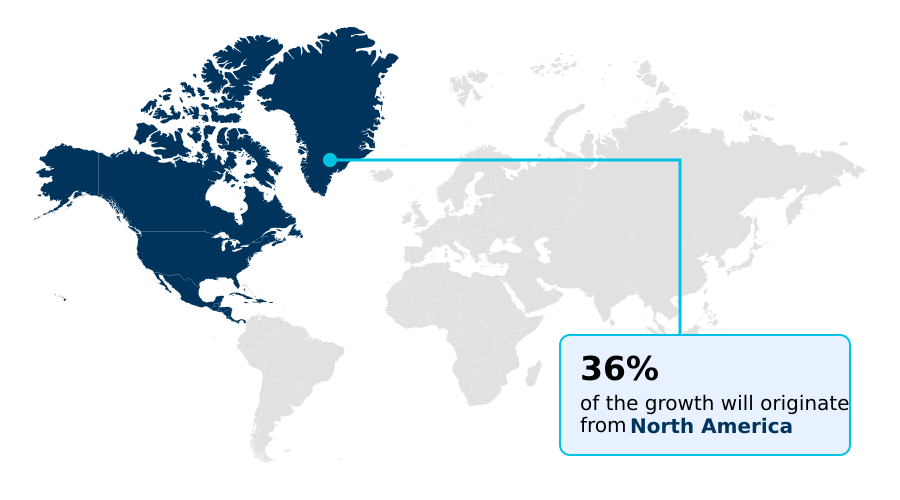
  • North America dominated the market and accounted for a 35.6% growth during the forecast period.
  • By Platform - Mobile segment was valued at USD 54.71 billion in 2024
  • By Type - Static ads segment accounted for the largest market revenue share in 2024

Market Size & Forecast

  • Market Opportunities: USD 122.32 billion
  • Market Future Opportunities: USD 85.02 billion
  • CAGR from 2025 to 2030 : 11.2%

Market Summary

  • The In-game Advertising (IGA) market is undergoing a significant transformation, moving beyond simple banners to sophisticated, integrated brand experiences. A core driver is the adoption of intrinsic ad placements and rewarded video ads, which respect player immersion standards while offering effective monetization.
  • This shift is enabled by programmatic buying through advanced ad mediation platforms, which automate the purchasing of inventory across mobile, console, and PC environments. Key trends include the expansion of metaverse brand integration and the use of dynamic ad insertion in the burgeoning esports sector.
  • For instance, a consumer goods company can leverage real-time bidding to place virtual product placements in a popular racing game, with ad creative personalized using generative AI to match player demographics, ensuring contextual relevance. However, the industry faces challenges in establishing unified cross-platform measurement and navigating complex data privacy compliance regulations.
  • Success depends on balancing monetization with user experience, mitigating ad fatigue, and ensuring robust brand safety protocols are in place across all interactive ad units and software development kits.

What will be the Size of the In-game Advertising (IGA) Market during the forecast period?

Get Key Insights on Market Forecast (PDF) Request Free Sample

How is the In-game Advertising (IGA) Market Segmented?

The in-game advertising (iga) industry research report provides comprehensive data (region-wise segment analysis), with forecasts and estimates in "USD million" for the period 2026-2030, as well as historical data from 2020-2024 for the following segments.
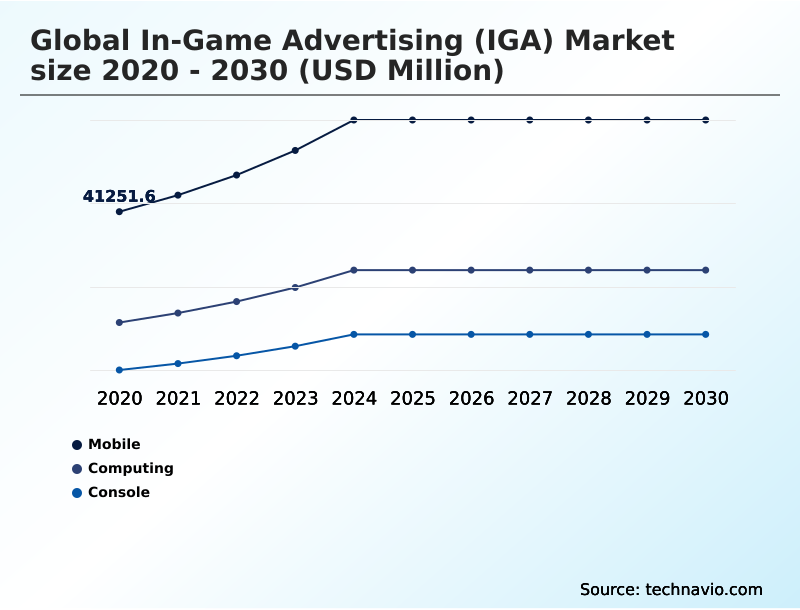
  • Platform
    • Mobile
    • Computing
    • Console
  • Type
    • Static ads
    • Dynamic ads
    • Advergaming
  • Pricing scheme
    • Cost per mille
    • Hybrid or outcome-based
    • Cost per completed view
    • Cost per click
    • Cost per action
  • Geography
    • North America
      • US
      • Canada
      • Mexico
    • APAC
      • China
      • Japan
      • South Korea
    • Europe
      • Germany
      • UK
      • France
    • Middle East and Africa
      • South Africa
      • Saudi Arabia
      • UAE
    • South America
      • Brazil
      • Argentina
      • Colombia
    • Rest of World (ROW)

By Platform Insights

The mobile segment is estimated to witness significant growth during the forecast period.

The mobile segment is the largest and most dynamic platform, driven by the low barrier to entry for casual gaming and widespread smartphone use.

This sector relies on diverse ad monetization strategies, including rewarded video ads and playable ad demonstrations, which provide a clear value exchange for users. Advertisers favor mobile due to sophisticated data for granular, real-time performance tracking and click-through rate optimization.

The prevalence of the free-to-play model necessitates robust ad mediation platforms to sustain developer revenue. As hardware improves, the capacity for high-fidelity, intrinsic ad placements is increasing, with some implementations boosting ad impressions by 20% year-over-year.

This evolution supports deeper brand safety protocols and more immersive user experiences.

Request Free Sample

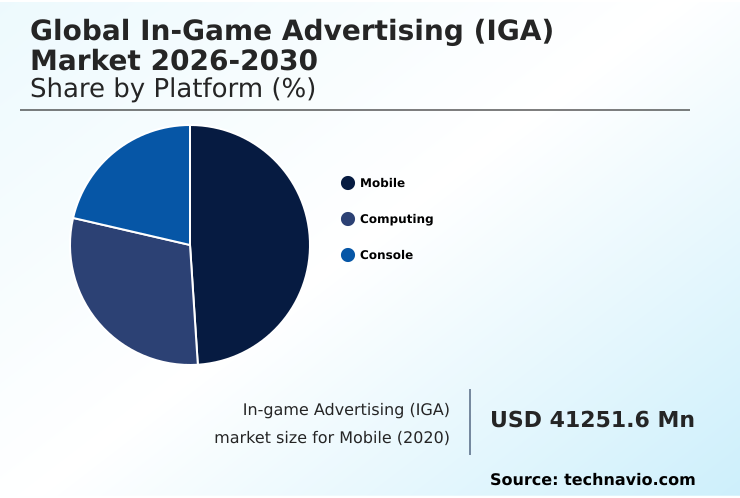
The Mobile segment was valued at USD 54.71 billion in 2024 and showed a gradual increase during the forecast period.

Request Free Sample

Regional Analysis

North America is estimated to contribute 35.6% to the growth of the global market during the forecast period.Technavio’s analysts have elaborately explained the regional trends and drivers that shape the market during the forecast period.

See How In-game Advertising (IGA) Market Demand is Rising in North America Request Free Sample

The market's geographic composition is dynamic, with North America leading in monetization maturity, contributing 35.6% of the incremental growth, while the APAC region is the fastest-growing market, with an expansion rate of 11.5%.

In North America, the focus is on programmatic ad delivery within console and PC gaming, leveraging sophisticated demand-side platform integration. In contrast, APAC's growth is fueled by mobile gaming, where value-exchange advertising models and interactive ad units are paramount.

Europe prioritizes non-intrusive advertising and strict data privacy compliance. Emerging regions like South America and the Middle East are rapidly adopting mobile-first ad monetization strategies, creating new opportunities for cloud gaming ad solutions and in-game storefronts as digital infrastructure improves.

Market Dynamics

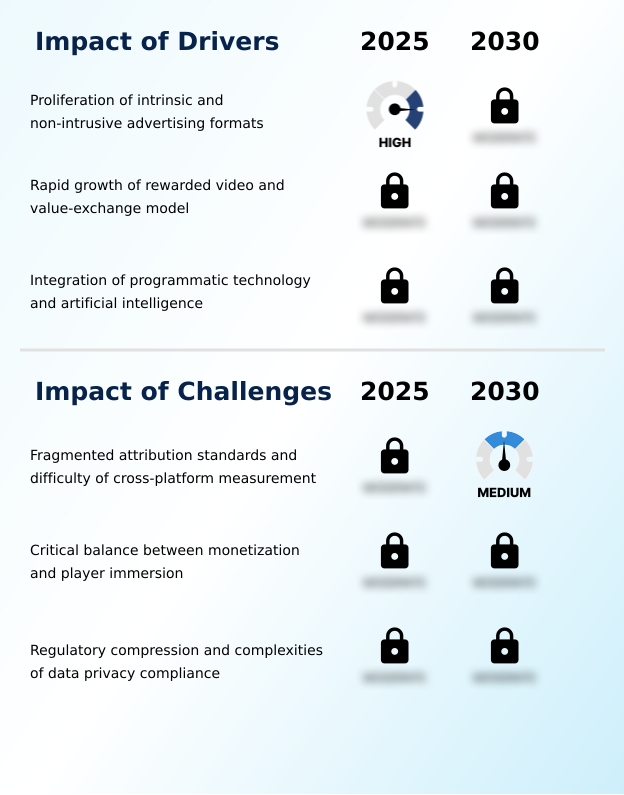
Our researchers analyzed the data with 2025 as the base year, along with the key drivers, trends, and challenges. A holistic analysis of drivers will help companies refine their marketing strategies to gain a competitive advantage.

  • Successfully navigating the in-game advertising landscape requires a deep understanding of its evolving mechanics, moving beyond simple ad placements to strategic ecosystem integration. Key considerations include measuring the ROI of in-game advertising, which remains a complex task due to challenges in attribution for cross-platform gaming.
  • For mobile-first strategies, integrating programmatic ads in mobile games is essential for scalability, but best practices for non-disruptive advertising must be followed to maintain engagement. This involves balancing monetization with the player experience to reduce ad fatigue in hyper-casual games. For premium environments, dynamic ad insertion in esports broadcasts and implementing intrinsic ads in console games offer high-impact visibility.
  • Advergaming strategies for brand engagement and metaverse advertising are creating new frontiers, tying into virtual economies and user-generated content, though this raises concerns about brand safety. The role of DSPs in in-game ad buying is to streamline access to inventory, while publishers focus on optimizing ad fill rates with mediation.
  • A critical shift is leveraging first-party data for targeting, a direct response to privacy compliance for in-game ad targeting. This pivot away from third-party cookies is compelling studios to build direct user relationships. Technologically, the focus is on refining viewability standards for 3D environments and using generative AI for ad personalization to improve the effectiveness of rewarded video ad formats.
  • Firms that automate inventory purchasing through such programmatic pipelines have been shown to reduce campaign launch times by over 40% compared to manual direct-sales models, showcasing a clear operational advantage.

What are the key market drivers leading to the rise in the adoption of In-game Advertising (IGA) Industry?

  • A key market driver is the proliferation of intrinsic and non-intrusive advertising formats designed to enhance player immersion rather than disrupt gameplay.

  • Market growth is fundamentally driven by the adoption of more sophisticated and player-friendly monetization models. The proliferation of intrinsic ad placements that blend into gameplay is reducing player churn, as these non-intrusive advertising formats are preferred over disruptive interstitials.
  • Simultaneously, the value-exchange advertising model, particularly rewarded video ads, has become a core revenue driver, with some mobile-first markets seeing up to a 25% increase in average revenue per daily active user.
  • The integration of programmatic buying and AI-powered real-time ad personalization is streamlining ad delivery. This ad-tech stack consolidation allows for highly effective contextual ad targeting, improving return on investment for cost per action campaigns and other performance-based initiatives.

What are the market trends shaping the In-game Advertising (IGA) Industry?

  • The ascent of programmatic in-game advertising, driven by automated real-time bidding, is an emerging market trend. This shift signals a move toward more efficient, data-driven ad purchasing within virtual environments.

  • Key market trends are centered on technological automation and deeper immersion. The expansion of programmatic in-game ad exchanges is pivotal, with programmatic ad delivery now enabling real-time bidding for dynamic ad insertion across platforms. This trend toward automated ad auctions has resulted in a 20% surge in total ad impressions for some publishers.
  • Concurrently, metaverse brand integration is moving from concept to reality, with brands creating persistent virtual environment advertising. Esports advertising formats are also maturing, becoming a premium channel for brands.
  • This is complemented by the use of generative AI for ad creative, which has accelerated marketing asset production and contributed to a 10% year-on-year increase in paid install share as competition for player visibility intensifies globally.

What challenges does the In-game Advertising (IGA) Industry face during its growth?

  • A key challenge affecting industry growth is the difficulty of cross-platform measurement, compounded by fragmented attribution standards across gaming ecosystems.

  • The market faces significant operational and regulatory headwinds. A primary challenge is the lack of unified cross-platform measurement and attribution modeling techniques, which complicates ROI analysis for advertisers. Poorly implemented intrusive ads can elevate player churn rates by over 15% in the first month, underscoring the critical need to balance monetization and player immersion.
  • Furthermore, tightening data privacy compliance, such as GDPR and other regional mandates, restricts traditional user acquisition funnels. Failure to secure user consent properly for data collection can result in fines representing up to 4% of annual global turnover. This forces a strategic shift toward first-party data strategies and on-device processing to ensure user consent management.

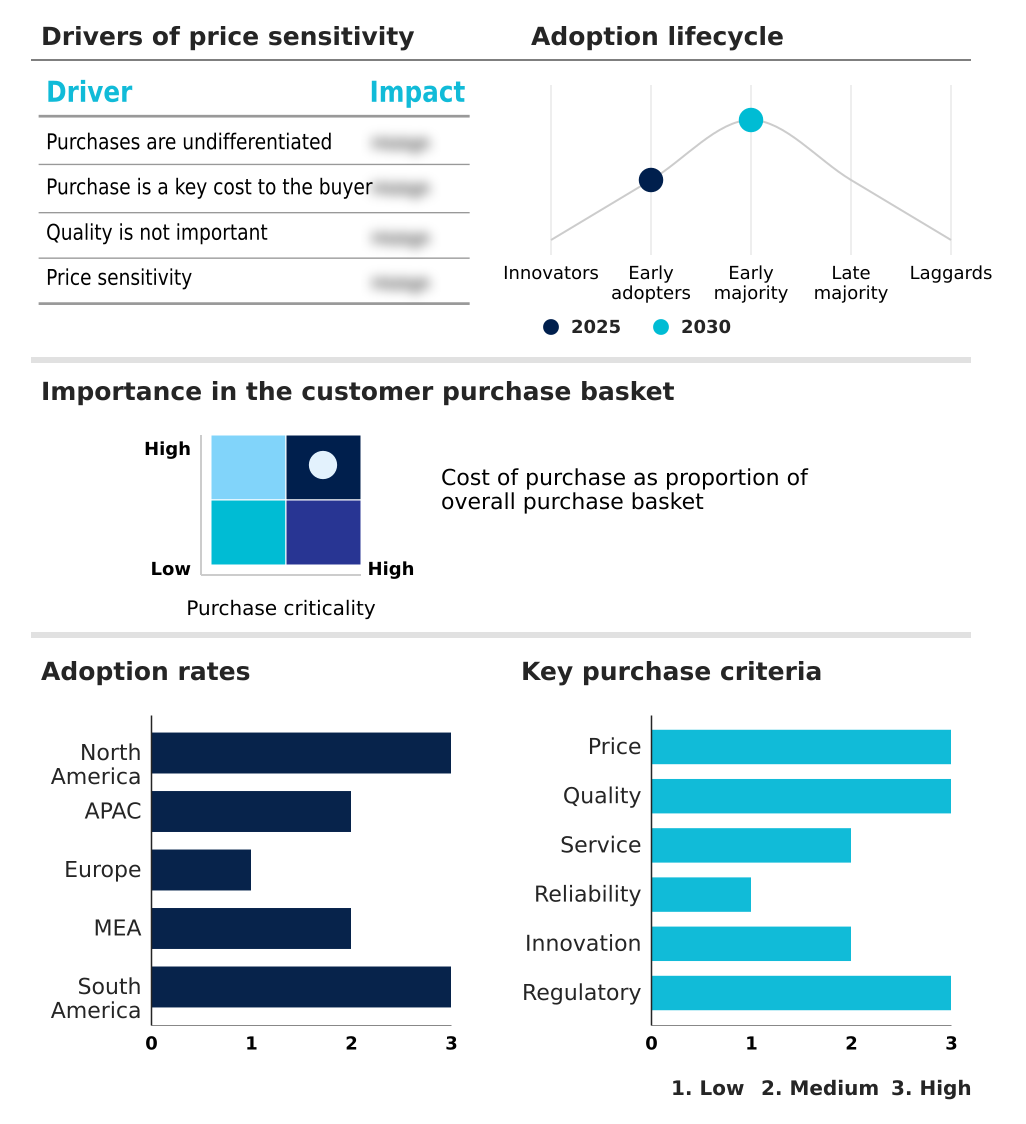
Exclusive Technavio Analysis on Customer Landscape

The in-game advertising (iga) market forecasting report includes the adoption lifecycle of the market, covering from the innovator’s stage to the laggard’s stage. It focuses on adoption rates in different regions based on penetration. Furthermore, the in-game advertising (iga) market report also includes key purchase criteria and drivers of price sensitivity to help companies evaluate and develop their market growth analysis strategies.

Customer Landscape of In-game Advertising (IGA) Industry

Competitive Landscape

Companies are implementing various strategies, such as strategic alliances, in-game advertising (iga) market forecast, partnerships, mergers and acquisitions, geographical expansion, and product/service launches, to enhance their presence in the industry.

Activision Blizzard Inc. - Expertise in patented in-play platforms enables seamless ad integration within interactive game environments, enhancing brand presence without disrupting user experience.

The industry research and growth report includes detailed analyses of the competitive landscape of the market and information about key companies, including:

  • Activision Blizzard Inc.
  • AdInMo Ltd.
  • AdMaven
  • Adverty AB
  • Alphabet Inc.
  • Anzu Virtual Reality Ltd.
  • AppLovin Corp.
  • AppsFlyer Ltd.
  • Azerion Group N.V
  • Bidstack Ltd.
  • Chartboost Inc.
  • Frameplay
  • Gadsme
  • InMobi Pte. Ltd.
  • Liftoff Inc.
  • Mistplay Inc.
  • PubScale
  • Unity Technologies Inc.
  • Verve Group SE

Qualitative and quantitative analysis of companies has been conducted to help clients understand the wider business environment as well as the strengths and weaknesses of key industry players. Data is qualitatively analyzed to categorize companies as pure play, category-focused, industry-focused, and diversified; it is quantitatively analyzed to categorize companies as dominant, leading, strong, tentative, and weak.

Recent Development and News in In-game advertising (iga) market

  • In February, 2025, JBL launched an official branded world on the Roblox platform, allowing millions of players to explore a themed environment and collect virtual currency for branded cosmetic items, showcasing a significant move in advergaming.
  • In January, 2025, Konami revealed a new suite of immersive AI-driven game design tools that enable more natural and contextual placement of brands within its sports and action titles, enhancing dynamic ad insertion capabilities.
  • In November, 2024, a leading US-based advertising platform announced the acquisition of a specialized in-game ad technology provider to strengthen its programmatic delivery capabilities for intrinsic ads across console and PC games.
  • In September, 2024, Google India implemented a strict policy update that banned advertising for certain real-money gaming categories from its ecosystem, highlighting the growing regulatory scrutiny and challenges related to brand safety and content relevance in the market.

Dive into Technavio’s robust research methodology, blending expert interviews, extensive data synthesis, and validated models for unparalleled In-game Advertising (IGA) Market insights. See full methodology.

Market Scope
Page number 298
Base year 2025
Historic period 2020-2024
Forecast period 2026-2030
Growth momentum & CAGR Accelerate at a CAGR of 11.2%
Market growth 2026-2030 USD 85016.9 million
Market structure Fragmented
YoY growth 2025-2026(%) 10.3%
Key countries US, Canada, Mexico, China, Japan, South Korea, India, Indonesia, Australia, Germany, UK, France, Italy, Spain, The Netherlands, South Africa, Saudi Arabia, UAE, Egypt, Nigeria, Brazil, Argentina and Colombia
Competitive landscape Leading Companies, Market Positioning of Companies, Competitive Strategies, and Industry Risks

Request Free Sample

Research Analyst Overview

  • The in-game advertising market is defined by a strategic shift toward preserving the user experience while maximizing monetization. A core pillar of this evolution is the widespread adoption of programmatic buying and real-time bidding, which streamline access to inventory through sophisticated ad mediation platforms.
  • These systems facilitate the use of diverse immersive ad formats, including intrinsic ad placements and rewarded video ads, which are becoming standard. The rise of metaverse brand integration and dynamic ad insertion within esports are creating new high-value opportunities.
  • Technology providers are offering advanced software development kits that enable everything from virtual product placement to interactive ad units and playable ad demonstrations. However, this progress is tempered by the critical need for robust brand safety protocols and clear player immersion standards to mitigate ad fatigue.
  • For instance, developers leveraging non-intrusive ad formats have seen partner revenue increases of up to 30%. Navigating this landscape requires a focus on contextual ad targeting using first-party data strategies to comply with privacy regulations, moving away from less transparent user acquisition funnels.
  • The complexity of cross-platform measurement remains a significant hurdle, pushing the industry toward unified standards for in-game ad exchanges. Ultimately, success hinges on the seamless convergence of demand-side platform integration and supply-side platform monetization to create a sustainable and engaging ecosystem for brands and players alike.

What are the Key Data Covered in this In-game Advertising (IGA) Market Research and Growth Report?

  • What is the expected growth of the In-game Advertising (IGA) Market between 2026 and 2030?

    • USD 85.02 billion, at a CAGR of 11.2%

  • What segmentation does the market report cover?

    • The report is segmented by Platform (Mobile, Computing, and Console), Type (Static ads, Dynamic ads, and Advergaming), Pricing Scheme (Cost per mille, Hybrid or outcome-based, Cost per completed view, Cost per click, and Cost per action) and Geography (North America, APAC, Europe, Middle East and Africa, South America)

  • Which regions are analyzed in the report?

    • North America, APAC, Europe, Middle East and Africa and South America

  • What are the key growth drivers and market challenges?

    • Proliferation of intrinsic and non-intrusive advertising formats, Fragmented attribution standards and difficulty of cross-platform measurement

  • Who are the major players in the In-game Advertising (IGA) Market?

    • Activision Blizzard Inc., AdInMo Ltd., AdMaven, Adverty AB, Alphabet Inc., Anzu Virtual Reality Ltd., AppLovin Corp., AppsFlyer Ltd., Azerion Group N.V, Bidstack Ltd., Chartboost Inc., Frameplay, Gadsme, InMobi Pte. Ltd., Liftoff Inc., Mistplay Inc., PubScale, Unity Technologies Inc. and Verve Group SE

Market Research Insights

  • The market's momentum is increasingly tied to the adoption of advanced ad monetization strategies. For example, implementing value-exchange advertising models has been shown to improve player retention metrics by over 15% in certain genres.
  • The consolidation of the ad-tech stack is also critical, with some platforms reporting up to a 30% revenue increase for developers who adopt seamless in-play advertising solutions. This push for efficiency is reshaping how ad inventory management and automated ad auctions are handled, with a focus on real-time ad personalization.
  • These data-driven approaches, which include sophisticated attribution modeling techniques and viewability measurement standards, are essential for brands seeking measurable returns and a positive association within virtual environment advertising.

We can help! Our analysts can customize this in-game advertising (iga) market research report to meet your requirements.

Get in touch

1. Executive Summary

1.1 Market overview

Executive Summary - Chart on Market Overview
Executive Summary - Data Table on Market Overview
Executive Summary - Chart on Global Market Characteristics
Executive Summary - Chart on Market by Geography
Executive Summary - Chart on Market Segmentation by Platform
Executive Summary - Chart on Market Segmentation by Type
Executive Summary - Chart on Market Segmentation by Pricing Scheme
Executive Summary - Chart on Incremental Growth
Executive Summary - Data Table on Incremental Growth
Executive Summary - Chart on Company Market Positioning

2. Technavio Analysis

2.1 Analysis of price sensitivity, lifecycle, customer purchase basket, adoption rates, and purchase criteria

2.2 Criticality of inputs and Factors of differentiation

Chart on Overview on criticality of inputs and factors of differentiation

2.3 Factors of disruption

Chart on Overview on factors of disruption

2.4 Impact of drivers and challenges

Chart on Impact of drivers and challenges in 2025 and 2030

3. Market Landscape

3.1 Market ecosystem

Chart on Parent Market
Data Table on - Parent Market

3.2 Market characteristics

Chart on Market characteristics analysis

3.3 Value chain analysis

Chart on Value chain analysis

4. Market Sizing

4.1 Market definition

Data Table on Offerings of companies included in the market definition

4.2 Market segment analysis

Market segments

4.3 Market size 2025

4.4 Market outlook: Forecast for 2025-2030

Chart on Global - Market size and forecast 2025-2030 ($ million)
Data Table on Global - Market size and forecast 2025-2030 ($ million)
Chart on Global Market: Year-over-year growth 2025-2030 (%)
Data Table on Global Market: Year-over-year growth 2025-2030 (%)

5. Historic Market Size

5.1 Global In-Game Advertising (IGA) Market 2020 - 2024

Historic Market Size - Data Table on Global In-Game Advertising (IGA) Market 2020 - 2024 ($ million)

5.2 Platform segment analysis 2020 - 2024

Historic Market Size - Platform Segment 2020 - 2024 ($ million)

5.3 Type segment analysis 2020 - 2024

Historic Market Size - Type Segment 2020 - 2024 ($ million)

5.4 Pricing Scheme segment analysis 2020 - 2024

Historic Market Size - Pricing Scheme Segment 2020 - 2024 ($ million)

5.5 Geography segment analysis 2020 - 2024

Historic Market Size - Geography Segment 2020 - 2024 ($ million)

5.6 Country segment analysis 2020 - 2024

Historic Market Size - Country Segment 2020 - 2024 ($ million)

6. Qualitative Analysis

6.1 Impact of AI in global in-game advertising (IGA) market

7. Five Forces Analysis

7.1 Five forces summary

Five forces analysis - Comparison between 2025 and 2030

7.2 Bargaining power of buyers

Bargaining power of buyers - Impact of key factors 2025 and 2030

7.3 Bargaining power of suppliers

Bargaining power of suppliers - Impact of key factors in 2025 and 2030

7.4 Threat of new entrants

Threat of new entrants - Impact of key factors in 2025 and 2030

7.5 Threat of substitutes

Threat of substitutes - Impact of key factors in 2025 and 2030

7.6 Threat of rivalry

Threat of rivalry - Impact of key factors in 2025 and 2030

7.7 Market condition

Chart on Market condition - Five forces 2025 and 2030

8. Market Segmentation by Platform

8.1 Market segments

Chart on Platform - Market share 2025-2030 (%)
Data Table on Platform - Market share 2025-2030 (%)

8.2 Comparison by Platform

Chart on Comparison by Platform
Data Table on Comparison by Platform

8.3 Mobile - Market size and forecast 2025-2030

Chart on Mobile - Market size and forecast 2025-2030 ($ million)
Data Table on Mobile - Market size and forecast 2025-2030 ($ million)
Chart on Mobile - Year-over-year growth 2025-2030 (%)
Data Table on Mobile - Year-over-year growth 2025-2030 (%)

8.4 Computing - Market size and forecast 2025-2030

Chart on Computing - Market size and forecast 2025-2030 ($ million)
Data Table on Computing - Market size and forecast 2025-2030 ($ million)
Chart on Computing - Year-over-year growth 2025-2030 (%)
Data Table on Computing - Year-over-year growth 2025-2030 (%)

8.5 Console - Market size and forecast 2025-2030

Chart on Console - Market size and forecast 2025-2030 ($ million)
Data Table on Console - Market size and forecast 2025-2030 ($ million)
Chart on Console - Year-over-year growth 2025-2030 (%)
Data Table on Console - Year-over-year growth 2025-2030 (%)

8.6 Market opportunity by Platform

Market opportunity by Platform ($ million)
Data Table on Market opportunity by Platform ($ million)

9. Market Segmentation by Type

9.1 Market segments

Chart on Type - Market share 2025-2030 (%)
Data Table on Type - Market share 2025-2030 (%)

9.2 Comparison by Type

Chart on Comparison by Type
Data Table on Comparison by Type

9.3 Static ads - Market size and forecast 2025-2030

Chart on Static ads - Market size and forecast 2025-2030 ($ million)
Data Table on Static ads - Market size and forecast 2025-2030 ($ million)
Chart on Static ads - Year-over-year growth 2025-2030 (%)
Data Table on Static ads - Year-over-year growth 2025-2030 (%)

9.4 Dynamic ads - Market size and forecast 2025-2030

Chart on Dynamic ads - Market size and forecast 2025-2030 ($ million)
Data Table on Dynamic ads - Market size and forecast 2025-2030 ($ million)
Chart on Dynamic ads - Year-over-year growth 2025-2030 (%)
Data Table on Dynamic ads - Year-over-year growth 2025-2030 (%)

9.5 Advergaming - Market size and forecast 2025-2030

Chart on Advergaming - Market size and forecast 2025-2030 ($ million)
Data Table on Advergaming - Market size and forecast 2025-2030 ($ million)
Chart on Advergaming - Year-over-year growth 2025-2030 (%)
Data Table on Advergaming - Year-over-year growth 2025-2030 (%)

9.6 Market opportunity by Type

Market opportunity by Type ($ million)
Data Table on Market opportunity by Type ($ million)

10. Market Segmentation by Pricing Scheme

10.1 Market segments

Chart on Pricing Scheme - Market share 2025-2030 (%)
Data Table on Pricing Scheme - Market share 2025-2030 (%)

10.2 Comparison by Pricing Scheme

Chart on Comparison by Pricing Scheme
Data Table on Comparison by Pricing Scheme

10.3 Cost per mille - Market size and forecast 2025-2030

Chart on Cost per mille - Market size and forecast 2025-2030 ($ million)
Data Table on Cost per mille - Market size and forecast 2025-2030 ($ million)
Chart on Cost per mille - Year-over-year growth 2025-2030 (%)
Data Table on Cost per mille - Year-over-year growth 2025-2030 (%)

10.4 Hybrid or outcome-based - Market size and forecast 2025-2030

Chart on Hybrid or outcome-based - Market size and forecast 2025-2030 ($ million)
Data Table on Hybrid or outcome-based - Market size and forecast 2025-2030 ($ million)
Chart on Hybrid or outcome-based - Year-over-year growth 2025-2030 (%)
Data Table on Hybrid or outcome-based - Year-over-year growth 2025-2030 (%)

10.5 Cost per completed view - Market size and forecast 2025-2030

Chart on Cost per completed view - Market size and forecast 2025-2030 ($ million)
Data Table on Cost per completed view - Market size and forecast 2025-2030 ($ million)
Chart on Cost per completed view - Year-over-year growth 2025-2030 (%)
Data Table on Cost per completed view - Year-over-year growth 2025-2030 (%)

10.6 Cost per click - Market size and forecast 2025-2030

Chart on Cost per click - Market size and forecast 2025-2030 ($ million)
Data Table on Cost per click - Market size and forecast 2025-2030 ($ million)
Chart on Cost per click - Year-over-year growth 2025-2030 (%)
Data Table on Cost per click - Year-over-year growth 2025-2030 (%)

10.7 Cost per action - Market size and forecast 2025-2030

Chart on Cost per action - Market size and forecast 2025-2030 ($ million)
Data Table on Cost per action - Market size and forecast 2025-2030 ($ million)
Chart on Cost per action - Year-over-year growth 2025-2030 (%)
Data Table on Cost per action - Year-over-year growth 2025-2030 (%)

10.8 Market opportunity by Pricing Scheme

Market opportunity by Pricing Scheme ($ million)
Data Table on Market opportunity by Pricing Scheme ($ million)

11. Customer Landscape

11.1 Customer landscape overview

Analysis of price sensitivity, lifecycle, customer purchase basket, adoption rates, and purchase criteria

12. Geographic Landscape

12.1 Geographic segmentation

Chart on Market share by geography 2025-2030 (%)
Data Table on Market share by geography 2025-2030 (%)

12.2 Geographic comparison

Chart on Geographic comparison
Data Table on Geographic comparison

12.3 North America - Market size and forecast 2025-2030

Chart on North America - Market size and forecast 2025-2030 ($ million)
Data Table on North America - Market size and forecast 2025-2030 ($ million)
Chart on North America - Year-over-year growth 2025-2030 (%)
Data Table on North America - Year-over-year growth 2025-2030 (%)
Chart on Regional Comparison - North America
Data Table on Regional Comparison - North America

12.3.1 US - Market size and forecast 2025-2030

Chart on US - Market size and forecast 2025-2030 ($ million)
Data Table on US - Market size and forecast 2025-2030 ($ million)
Chart on US - Year-over-year growth 2025-2030 (%)
Data Table on US - Year-over-year growth 2025-2030 (%)

12.3.2 Canada - Market size and forecast 2025-2030

Chart on Canada - Market size and forecast 2025-2030 ($ million)
Data Table on Canada - Market size and forecast 2025-2030 ($ million)
Chart on Canada - Year-over-year growth 2025-2030 (%)
Data Table on Canada - Year-over-year growth 2025-2030 (%)

12.3.3 Mexico - Market size and forecast 2025-2030

Chart on Mexico - Market size and forecast 2025-2030 ($ million)
Data Table on Mexico - Market size and forecast 2025-2030 ($ million)
Chart on Mexico - Year-over-year growth 2025-2030 (%)
Data Table on Mexico - Year-over-year growth 2025-2030 (%)

12.4 APAC - Market size and forecast 2025-2030

Chart on APAC - Market size and forecast 2025-2030 ($ million)
Data Table on APAC - Market size and forecast 2025-2030 ($ million)
Chart on APAC - Year-over-year growth 2025-2030 (%)
Data Table on APAC - Year-over-year growth 2025-2030 (%)
Chart on Regional Comparison - APAC
Data Table on Regional Comparison - APAC

12.4.1 China - Market size and forecast 2025-2030

Chart on China - Market size and forecast 2025-2030 ($ million)
Data Table on China - Market size and forecast 2025-2030 ($ million)
Chart on China - Year-over-year growth 2025-2030 (%)
Data Table on China - Year-over-year growth 2025-2030 (%)

12.4.2 Japan - Market size and forecast 2025-2030

Chart on Japan - Market size and forecast 2025-2030 ($ million)
Data Table on Japan - Market size and forecast 2025-2030 ($ million)
Chart on Japan - Year-over-year growth 2025-2030 (%)
Data Table on Japan - Year-over-year growth 2025-2030 (%)

12.4.3 South Korea - Market size and forecast 2025-2030

Chart on South Korea - Market size and forecast 2025-2030 ($ million)
Data Table on South Korea - Market size and forecast 2025-2030 ($ million)
Chart on South Korea - Year-over-year growth 2025-2030 (%)
Data Table on South Korea - Year-over-year growth 2025-2030 (%)

12.4.4 India - Market size and forecast 2025-2030

Chart on India - Market size and forecast 2025-2030 ($ million)
Data Table on India - Market size and forecast 2025-2030 ($ million)
Chart on India - Year-over-year growth 2025-2030 (%)
Data Table on India - Year-over-year growth 2025-2030 (%)

12.4.5 Indonesia - Market size and forecast 2025-2030

Chart on Indonesia - Market size and forecast 2025-2030 ($ million)
Data Table on Indonesia - Market size and forecast 2025-2030 ($ million)
Chart on Indonesia - Year-over-year growth 2025-2030 (%)
Data Table on Indonesia - Year-over-year growth 2025-2030 (%)

12.4.6 Australia - Market size and forecast 2025-2030

Chart on Australia - Market size and forecast 2025-2030 ($ million)
Data Table on Australia - Market size and forecast 2025-2030 ($ million)
Chart on Australia - Year-over-year growth 2025-2030 (%)
Data Table on Australia - Year-over-year growth 2025-2030 (%)

12.5 Europe - Market size and forecast 2025-2030

Chart on Europe - Market size and forecast 2025-2030 ($ million)
Data Table on Europe - Market size and forecast 2025-2030 ($ million)
Chart on Europe - Year-over-year growth 2025-2030 (%)
Data Table on Europe - Year-over-year growth 2025-2030 (%)
Chart on Regional Comparison - Europe
Data Table on Regional Comparison - Europe

12.5.1 Germany - Market size and forecast 2025-2030

Chart on Germany - Market size and forecast 2025-2030 ($ million)
Data Table on Germany - Market size and forecast 2025-2030 ($ million)
Chart on Germany - Year-over-year growth 2025-2030 (%)
Data Table on Germany - Year-over-year growth 2025-2030 (%)

12.5.2 UK - Market size and forecast 2025-2030

Chart on UK - Market size and forecast 2025-2030 ($ million)
Data Table on UK - Market size and forecast 2025-2030 ($ million)
Chart on UK - Year-over-year growth 2025-2030 (%)
Data Table on UK - Year-over-year growth 2025-2030 (%)

12.5.3 France - Market size and forecast 2025-2030

Chart on France - Market size and forecast 2025-2030 ($ million)
Data Table on France - Market size and forecast 2025-2030 ($ million)
Chart on France - Year-over-year growth 2025-2030 (%)
Data Table on France - Year-over-year growth 2025-2030 (%)

12.5.4 Italy - Market size and forecast 2025-2030

Chart on Italy - Market size and forecast 2025-2030 ($ million)
Data Table on Italy - Market size and forecast 2025-2030 ($ million)
Chart on Italy - Year-over-year growth 2025-2030 (%)
Data Table on Italy - Year-over-year growth 2025-2030 (%)

12.5.5 Spain - Market size and forecast 2025-2030

Chart on Spain - Market size and forecast 2025-2030 ($ million)
Data Table on Spain - Market size and forecast 2025-2030 ($ million)
Chart on Spain - Year-over-year growth 2025-2030 (%)
Data Table on Spain - Year-over-year growth 2025-2030 (%)

12.5.6 The Netherlands - Market size and forecast 2025-2030

Chart on The Netherlands - Market size and forecast 2025-2030 ($ million)
Data Table on The Netherlands - Market size and forecast 2025-2030 ($ million)
Chart on The Netherlands - Year-over-year growth 2025-2030 (%)
Data Table on The Netherlands - Year-over-year growth 2025-2030 (%)

12.6 Middle East and Africa - Market size and forecast 2025-2030

Chart on Middle East and Africa - Market size and forecast 2025-2030 ($ million)
Data Table on Middle East and Africa - Market size and forecast 2025-2030 ($ million)
Chart on Middle East and Africa - Year-over-year growth 2025-2030 (%)
Data Table on Middle East and Africa - Year-over-year growth 2025-2030 (%)
Chart on Regional Comparison - Middle East and Africa
Data Table on Regional Comparison - Middle East and Africa

12.6.1 South Africa - Market size and forecast 2025-2030

Chart on South Africa - Market size and forecast 2025-2030 ($ million)
Data Table on South Africa - Market size and forecast 2025-2030 ($ million)
Chart on South Africa - Year-over-year growth 2025-2030 (%)
Data Table on South Africa - Year-over-year growth 2025-2030 (%)

12.6.2 Saudi Arabia - Market size and forecast 2025-2030

Chart on Saudi Arabia - Market size and forecast 2025-2030 ($ million)
Data Table on Saudi Arabia - Market size and forecast 2025-2030 ($ million)
Chart on Saudi Arabia - Year-over-year growth 2025-2030 (%)
Data Table on Saudi Arabia - Year-over-year growth 2025-2030 (%)

12.6.3 UAE - Market size and forecast 2025-2030

Chart on UAE - Market size and forecast 2025-2030 ($ million)
Data Table on UAE - Market size and forecast 2025-2030 ($ million)
Chart on UAE - Year-over-year growth 2025-2030 (%)
Data Table on UAE - Year-over-year growth 2025-2030 (%)

12.6.4 Egypt - Market size and forecast 2025-2030

Chart on Egypt - Market size and forecast 2025-2030 ($ million)
Data Table on Egypt - Market size and forecast 2025-2030 ($ million)
Chart on Egypt - Year-over-year growth 2025-2030 (%)
Data Table on Egypt - Year-over-year growth 2025-2030 (%)

12.6.5 Nigeria - Market size and forecast 2025-2030

Chart on Nigeria - Market size and forecast 2025-2030 ($ million)
Data Table on Nigeria - Market size and forecast 2025-2030 ($ million)
Chart on Nigeria - Year-over-year growth 2025-2030 (%)
Data Table on Nigeria - Year-over-year growth 2025-2030 (%)

12.7 South America - Market size and forecast 2025-2030

Chart on South America - Market size and forecast 2025-2030 ($ million)
Data Table on South America - Market size and forecast 2025-2030 ($ million)
Chart on South America - Year-over-year growth 2025-2030 (%)
Data Table on South America - Year-over-year growth 2025-2030 (%)
Chart on Regional Comparison - South America
Data Table on Regional Comparison - South America

12.7.1 Brazil - Market size and forecast 2025-2030

Chart on Brazil - Market size and forecast 2025-2030 ($ million)
Data Table on Brazil - Market size and forecast 2025-2030 ($ million)
Chart on Brazil - Year-over-year growth 2025-2030 (%)
Data Table on Brazil - Year-over-year growth 2025-2030 (%)

12.7.2 Argentina - Market size and forecast 2025-2030

Chart on Argentina - Market size and forecast 2025-2030 ($ million)
Data Table on Argentina - Market size and forecast 2025-2030 ($ million)
Chart on Argentina - Year-over-year growth 2025-2030 (%)
Data Table on Argentina - Year-over-year growth 2025-2030 (%)

12.7.3 Colombia - Market size and forecast 2025-2030

Chart on Colombia - Market size and forecast 2025-2030 ($ million)
Data Table on Colombia - Market size and forecast 2025-2030 ($ million)
Chart on Colombia - Year-over-year growth 2025-2030 (%)
Data Table on Colombia - Year-over-year growth 2025-2030 (%)

12.8 Market opportunity by geography

Market opportunity by geography ($ million)
Data Tables on Market opportunity by geography ($ million)

13. Drivers, Challenges, and Opportunity

13.1 Market drivers

Proliferation of intrinsic and non-intrusive advertising formats
Rapid growth of rewarded video and value-exchange model
Integration of programmatic technology and artificial intelligence

13.2 Market challenges

Fragmented attribution standards and difficulty of cross-platform measurement
Critical balance between monetization and player immersion
Regulatory compression and complexities of data privacy compliance

13.3 Impact of drivers and challenges

Impact of drivers and challenges in 2025 and 2030

13.4 Market opportunities

Rise of programmatic in-game advertising and automated real-time bidding
Expansion of metaverse-based advertising and immersive brand worlds
Dominance of esports as premium channel for highly engaged audiences

14. Competitive Landscape

14.1 Overview

14.2

Overview on criticality of inputs and factors of differentiation

14.3 Landscape disruption

Overview on factors of disruption

14.4 Industry risks

Impact of key risks on business

15. Competitive Analysis

15.1 Companies profiled

Companies covered

15.2 Company ranking index

15.3 Market positioning of companies

Matrix on companies position and classification

15.4 Activision Blizzard Inc.

Activision Blizzard Inc. - Overview
Activision Blizzard Inc. - Product / Service
Activision Blizzard Inc. - Key offerings
SWOT

15.5 AdInMo Ltd.

AdInMo Ltd. - Overview
AdInMo Ltd. - Product / Service
AdInMo Ltd. - Key offerings
SWOT

15.6 Adverty AB

Adverty AB - Overview
Adverty AB - Product / Service
Adverty AB - Key offerings
SWOT

15.7 Alphabet Inc.

Alphabet Inc. - Overview
Alphabet Inc. - Business segments
Alphabet Inc. - Key offerings
Alphabet Inc. - Segment focus
SWOT

15.8 Anzu Virtual Reality Ltd.

Anzu Virtual Reality Ltd. - Overview
Anzu Virtual Reality Ltd. - Product / Service
Anzu Virtual Reality Ltd. - Key offerings
SWOT

15.9 AppLovin Corp.

AppLovin Corp. - Overview
AppLovin Corp. - Business segments
AppLovin Corp. - Key offerings
AppLovin Corp. - Segment focus
SWOT

15.10 AppsFlyer Ltd.

AppsFlyer Ltd. - Overview
AppsFlyer Ltd. - Product / Service
AppsFlyer Ltd. - Key offerings
SWOT

15.11 Azerion Group N.V

Azerion Group N.V - Overview
Azerion Group N.V - Business segments
Azerion Group N.V - Key offerings
Azerion Group N.V - Segment focus
SWOT

15.12 Bidstack Ltd.

Bidstack Ltd. - Overview
Bidstack Ltd. - Product / Service
Bidstack Ltd. - Key offerings
SWOT

15.13 Chartboost Inc.

Chartboost Inc. - Overview
Chartboost Inc. - Product / Service
Chartboost Inc. - Key offerings
SWOT

15.14 Frameplay

Frameplay - Overview
Frameplay - Product / Service
Frameplay - Key offerings
SWOT

15.15 Gadsme

Gadsme - Overview
Gadsme - Product / Service
Gadsme - Key offerings
SWOT

15.16 InMobi Pte. Ltd.

InMobi Pte. Ltd. - Overview
InMobi Pte. Ltd. - Product / Service
InMobi Pte. Ltd. - Key offerings
SWOT

15.17 Unity Technologies Inc.

Unity Technologies Inc. - Overview
Unity Technologies Inc. - Business segments
Unity Technologies Inc. - Key news
Unity Technologies Inc. - Key offerings
Unity Technologies Inc. - Segment focus
SWOT

15.18 Verve Group SE

Verve Group SE - Overview
Verve Group SE - Business segments
Verve Group SE - Key offerings
Verve Group SE - Segment focus
SWOT

16. Appendix

16.1 Scope of the report

Market definition
Objectives
Notes and caveats

16.2 Inclusions and exclusions checklist

Inclusions checklist
Exclusions checklist

16.3 Currency conversion rates for US$

16.4 Research methodology

16.5 Data procurement

Information sources

16.6 Data validation

16.7 Validation techniques employed for market sizing

16.8 Data synthesis

16.9 360 degree market analysis

16.10 List of abbreviations

Research Methodology

Technavio presents a detailed picture of the market by way of study, synthesis, and summation of data from multiple sources. The analysts have presented the various facets of the market with a particular focus on identifying the key industry influencers. The data thus presented is comprehensive, reliable, and the result of extensive research, both primary and secondary.

INFORMATION SOURCES

Primary sources

  • Manufacturers and suppliers
  • Channel partners
  • Industry experts
  • Strategic decision makers

Secondary sources

  • Industry journals and periodicals
  • Government data
  • Financial reports of key industry players
  • Historical data
  • Press releases

DATA ANALYSIS

Data Synthesis

  • Collation of data
  • Estimation of key figures
  • Analysis of derived insights

Data Validation

  • Triangulation with data models
  • Reference against proprietary databases
  • Corroboration with industry experts

REPORT WRITING

Qualitative

  • Market drivers
  • Market challenges
  • Market trends
  • Five forces analysis

Quantitative

  • Market size and forecast
  • Market segmentation
  • Geographical insights
  • Competitive landscape

Interested in this report?

Get your sample now to see our research methodology and insights!

Download Now

Frequently Asked Questions

In-game Advertising (IGA) market growth will increase by USD 85016.9 million during 2026-2030.

The In-game Advertising (IGA) market is expected to grow at a CAGR of 11.2% during 2026-2030.

In-game Advertising (IGA) market is segmented by Platform (Mobile, Computing, Console) Type (Static ads, Dynamic ads, Advergaming) Pricing scheme (Cost per mille, Hybrid or outcome-based, Cost per completed view, Cost per click, Cost per action)

Activision Blizzard Inc., AdInMo Ltd., AdMaven, Adverty AB, Alphabet Inc., Anzu Virtual Reality Ltd., AppLovin Corp., AppsFlyer Ltd., Azerion Group N.V, Bidstack Ltd., Chartboost Inc., Frameplay, Gadsme, InMobi Pte. Ltd., Liftoff Inc., Mistplay Inc., PubScale, Unity Technologies Inc., Verve Group SE are a few of the key vendors in the In-game Advertising (IGA) market.

North America will register the highest growth rate of 35.6% among the other regions. Therefore, the In-game Advertising (IGA) market in North America is expected to garner significant business opportunities for the vendors during the forecast period.

US, Canada, Mexico, China, Japan, South Korea, India, Indonesia, Australia, Germany, UK, France, Italy, Spain, The Netherlands, South Africa, Saudi Arabia, UAE, Egypt, Nigeria, Brazil, Argentina, Colombia

  • Proliferation of intrinsic and non-intrusive advertising formats is the driving factor this market.

The In-game Advertising (IGA) market vendors should focus on grabbing business opportunities from the Platform segment as it accounted for the largest market share in the base year.
RIA - Research AI Assistant
Ask RIA