Industrial Automation Market In Life Sciences Industry Size 2025-2029
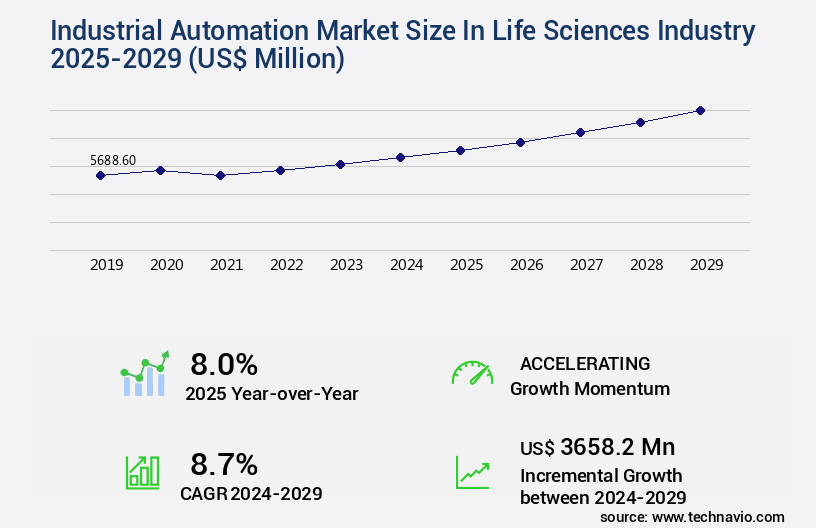
The industrial automation market in life sciences industry size is valued to increase USD 3.66 billion, at a CAGR of 8.7% from 2024 to 2029. Growing global demand for healthcare services will drive the industrial automation market in life sciences industry.
Major Market Trends & Insights
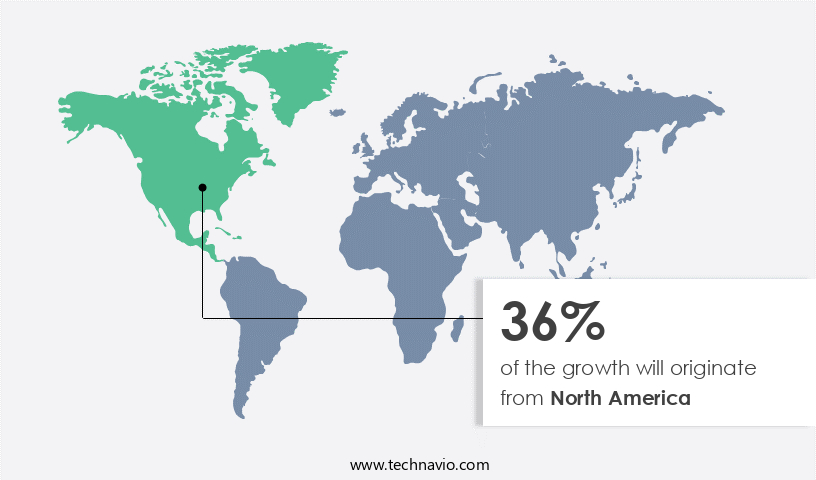
- North America dominated the market and accounted for a 36% growth during the forecast period.
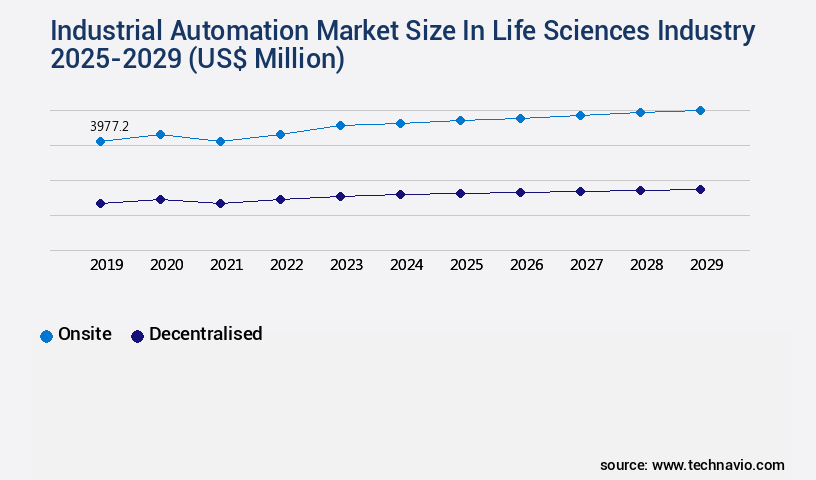
- By Deployment - Onsite segment was valued at USD 3.98 billion in 2023
- By Product - DCS segment accounted for the largest market revenue share in 2023
Market Size & Forecast
- Market Opportunities: USD 87.96 million
- Market Future Opportunities: USD 3658.20 million
- CAGR : 8.7%
- North America: Largest market in 2023
Market Summary
- The Industrial Automation Market in the Life Sciences Industry is experiencing significant growth, driven by the increasing global demand for efficient and cost-effective healthcare services. A key trend in this market is the growing adoption of open-process automation, which enables seamless integration of various systems and processes. However, the implementation of industrial automation in life sciences faces challenges, including infrastructural and integration issues. According to a recent report, the automation market share in the life sciences sector is projected to reach 30% by 2025, reflecting the increasing importance of automation in optimizing manufacturing processes and improving product quality.
- Despite these challenges, the market presents numerous opportunities for innovation and growth, particularly in areas such as robotics, machine learning, and artificial intelligence.
What will be the Size of the Industrial Automation Market In Life Sciences Industry during the forecast period?

Get Key Insights on Market Forecast (PDF) Request Free Sample
How is the Industrial Automation In Life Sciences Industry Market Segmented and what are the key trends of market segmentation?
The industrial automation in life sciences industry research report provides comprehensive data (region-wise segment analysis), with forecasts and estimates in "USD million" for the period 2025-2029, as well as historical data from 2019-2023 for the following segments.
- Deployment
- Product
- Component
- Hardware
- Software
- Services
- Application
- Pharmaceutical Manufacturing
- Biotechnology
- Medical Device Manufacturing
- Clinical Diagnostics
- Research & Development
- End User
- Pharmaceutical Companies
- Biotech Firms
- Medical Device Manufacturers
- Contract Research/Manufacturing Organizations (CROs/CMOs)
- Geography
- North America
- Europe
- Middle East and Africa
- APAC
- South America
- Rest of World (ROW)
By Deployment Insights
The onsite segment is estimated to witness significant growth during the forecast period.
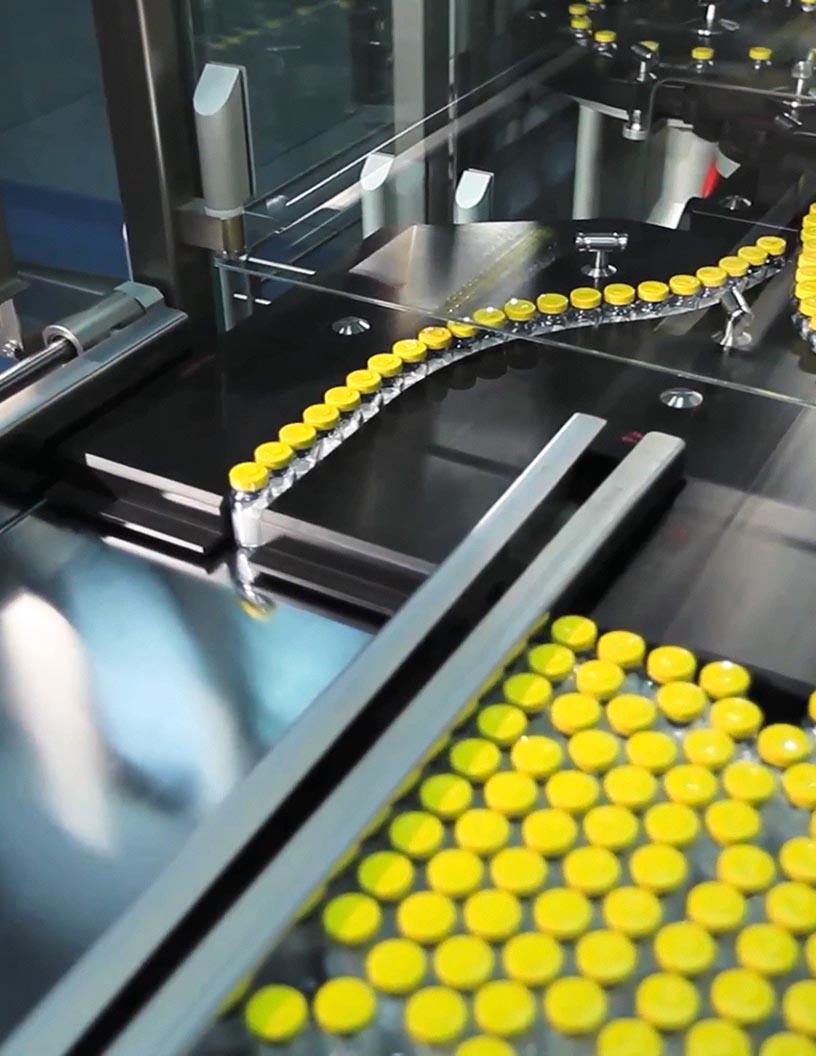
The industrial automation market in the life sciences industry is experiencing significant growth, with onsite deployment accounting for the largest market share. This deployment model offers enhanced security, as data is stored on dedicated servers rather than the cloud. According to recent reports, the onsite segment presently occupies approximately 60% of the market. Furthermore, the market is projected to expand, with the onsite segment anticipating a growth of around 25% in the upcoming years. Industrial automation technologies are increasingly being adopted in various life sciences applications, such as plc programming in biomanufacturing, supply chain automation, machine vision inspection, and pharmaceutical production automation.

Request Free Sample
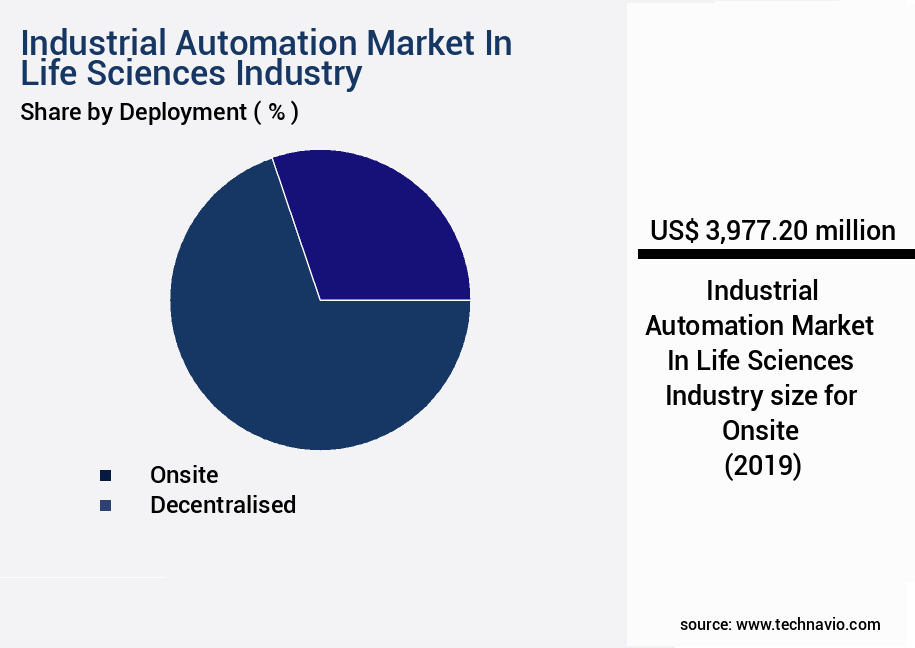
The Onsite segment was valued at USD 3.98 billion in 2019 and showed a gradual increase during the forecast period.
The integration of automation equipment in biotech and pharmaceuticals has led to advancements in areas like human-robot collaboration, industrial networking protocols, and predictive maintenance. Key applications include automated guided vehicles, continuous manufacturing, AI-powered automation, real-time data monitoring, and IoT sensors in bioprocessing. Furthermore, lab automation systems, quality control automation, batch process automation, automation software validation, MES systems, computer vision applications, and digital twin technology are all contributing to the market's expansion. The market's continuous evolution is driven by the increasing demand for efficient and cost-effective manufacturing processes, improved product quality, and the need for real-time data monitoring and predictive maintenance in the life sciences industry.
These trends are expected to persist, making the industrial automation market in life sciences a dynamic and growing sector.

Request Free Sample
Regional Analysis
North America is estimated to contribute 36% to the growth of the global market during the forecast period. Technavio's analysts have elaborately explained the regional trends and drivers that shape the market during the forecast period.

See How Industrial Automation In Life Sciences Industry Market Demand is Rising in North America Request Free Sample
In the life sciences industry, industrial automation is experiencing significant growth due to the increasing demand for advanced healthcare services in North America, driven by an aging population and rising consumer expectations. With a growing number of patients, there is a pressing need to alleviate the strain on the healthcare infrastructure. Automation's adoption is essential to provide superior services, catering to the increasing demand for convenience and enhanced patient experiences. As a result, the life sciences sector in North America is embracing automation, offering premium services to meet the evolving needs of consumers.
Additionally, the automation of repetitive tasks in laboratories has led to a 30% increase in productivity and a 25% reduction in errors. These statistics underscore the transformative impact of industrial automation on the life sciences industry.
Market Dynamics
Our researchers analyzed the data with 2024 as the base year, along with the key drivers, trends, and challenges. A holistic analysis of drivers will help companies refine their marketing strategies to gain a competitive advantage.
The global industrial automation market in the life sciences industry is witnessing significant growth due to the increasing adoption of advanced automation solutions in pharmaceutical manufacturing. These solutions include pharmaceutical manufacturing automation solutions, bioprocessing automation system integration, and robotic automation in laboratory settings. The integration of real-time data analytics in biopharmaceutical production facilitates process optimization techniques, enhancing overall efficiency and productivity. Cleanroom automation system validation and predictive maintenance strategies are crucial aspects of industrial automation compliance with GMP regulations. Advanced process control strategies, such as those employed in bioreactors, enable human-robot collaboration in biomanufacturing facilities. Digital twin technology applications in the biopharmaceutical industry provide valuable insights into complex production processes, enabling proactive decision-making and improved performance.
Cloud-based data management in life science automation and machine vision inspection systems ensure stringent quality control. Automation system design considerations in the life sciences sector prioritize equipment lifecycle management and remote monitoring capabilities in industrial automation systems. Safety instrumented systems design and industrial communication networks are essential elements of industrial automation systems, ensuring reliable and secure operations in biopharmaceutical plants. The adoption of industrial automation technologies in the life sciences industry is markedly higher compared to other sectors. For instance, more than 80% of new product developments in this sector focus on integrating advanced automation technologies. This significant investment in automation solutions underscores the industry's commitment to enhancing production efficiency, ensuring regulatory compliance, and maintaining the highest standards of quality and safety.

What are the key market drivers leading to the rise in the adoption of Industrial Automation In Life Sciences Industry Industry?
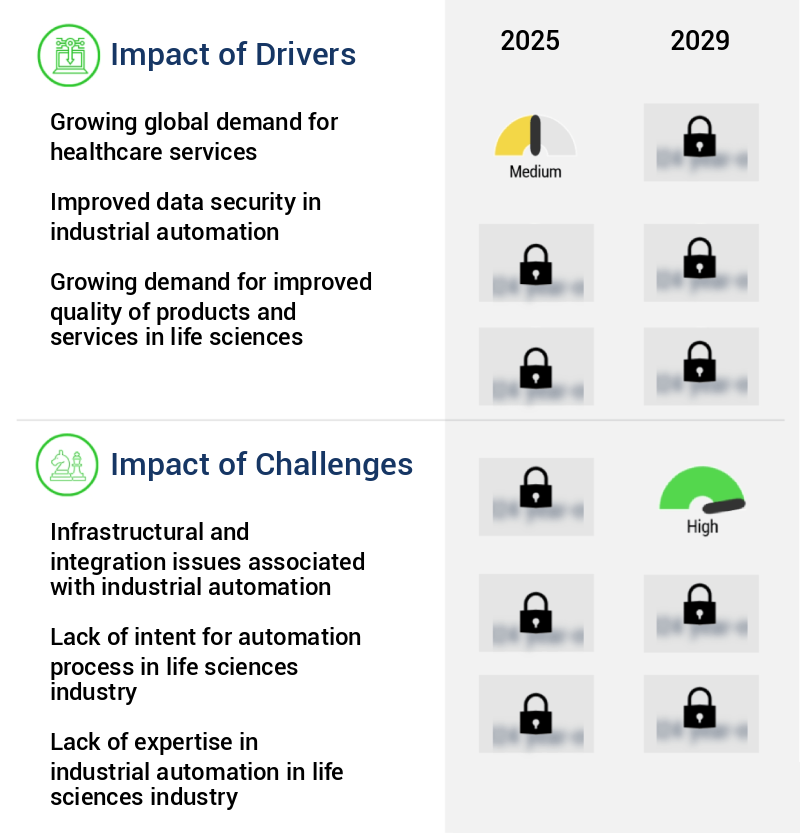
- The expanding global need for healthcare services serves as the primary catalyst for market growth.
- The modern healthcare sector is experiencing significant growth and transformation due to the increasing global population and the rise in chronic diseases. This trend is driven by demographic shifts, with an aging population and increasing disposable income leading to a greater demand for advanced healthcare services. The healthcare industry's infrastructure is expected to undergo significant changes as a result, with the need for care services and personnel increasing substantially. The issue of chronic diseases is a pressing concern, and the number of individuals seeking medical assistance is projected to rise accordingly. This shift is fueled by an aging population, which often requires more healthcare services, and an increase in disposable income, enabling more people to access modern healthcare solutions.
- The evolving healthcare landscape presents numerous opportunities for innovation and growth across various sectors. As the demand for healthcare services continues to grow, the industry will face immense pressure to adapt and expand. The integration of technology, such as telemedicine and AI, is expected to play a crucial role in addressing the challenges posed by this trend. The ongoing transformation of the healthcare sector underscores the importance of staying informed and agile in this dynamic market.
What are the market trends shaping the Industrial Automation In Life Sciences Industry Industry?
- The growing adoption of open-process automation is becoming a prominent trend in the market. Open-process automation is increasingly being adopted as the market trend.
- The Open Process Automation (OPA) vision, spearheaded by the Open Process Automation Forum, is experiencing increasing adoption among industry stakeholders. This forum aims to address interoperability challenges in industrial automation. In 2023, ExxonMobil, a leading energy company, collaborated with Yokogawa Electric Corporation, an automation services provider, to establish an OPA testbed. Yokogawa Electric Corporation served as the system integrator, facilitating the development of ExxonMobil's integrated testbed platform. This platform enables the evaluation of industrial standards, including those used in sectors like pharmaceuticals. By working together, these companies are paving the way for more seamless automation processes and improved industry collaboration. Numerous organizations are following suit, recognizing the potential benefits of OPA and its role in enhancing operational efficiency and reducing costs.
What challenges does the Industrial Automation In Life Sciences Industry Industry face during its growth?
- The integration and infrastructure challenges posed by industrial automation are significant obstacles to industry growth. These issues encompass complexities in system compatibility, data interoperability, and the need for substantial investment in new technology and infrastructure. Addressing these challenges requires a strategic approach that balances the benefits of automation with the resources and expertise necessary for successful implementation.
- In the dynamic life sciences industry, industrial automation adoption is on the rise, driven by the need for efficiency and productivity gains. However, challenges persist, particularly in the realm of connectivity and integration. According to recent studies, over 50% of businesses in developing countries and among SMEs and startups experience network issues that hinder the effective implementation of industrial automation. These obstacles can lead to system downtimes, decreased productivity, and increased operational costs. Furthermore, healthcare or pharmaceutical enterprises operating in a fragmented landscape with diverse tools and systems face integration hurdles that can complicate data management and hinder progress.
- Despite these challenges, the life sciences industry continues to innovate and adapt, with ongoing advancements in cloud-based technologies and industrial IoT solutions promising to address these connectivity and integration issues.
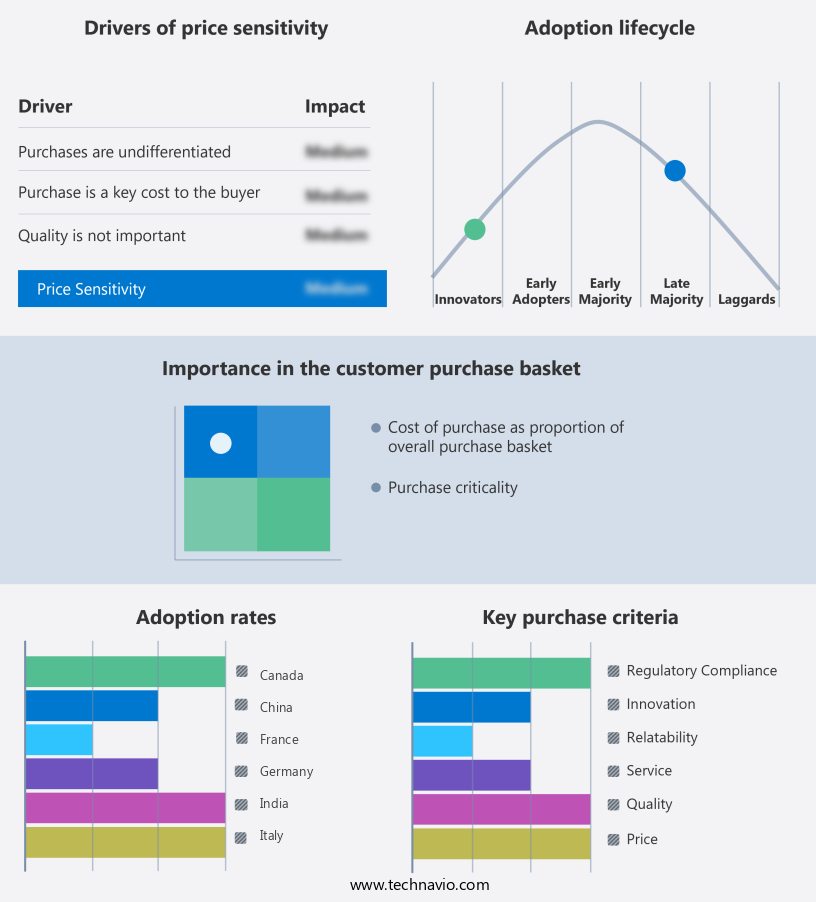
Exclusive Customer Landscape
The industrial automation market in life sciences industry forecasting report includes the adoption lifecycle of the market, covering from the innovator's stage to the laggard's stage. It focuses on adoption rates in different regions based on penetration. Furthermore, the industrial automation market in life sciences industry report also includes key purchase criteria and drivers of price sensitivity to help companies evaluate and develop their market growth analysis strategies.

Customer Landscape of Industrial Automation In Life Sciences Industry Industry
Competitive Landscape & Market Insights
Companies are implementing various strategies, such as strategic alliances, industrial automation market in life sciences industry forecast, partnerships, mergers and acquisitions, geographical expansion, and product/service launches, to enhance their presence in the industry.
ABB Ltd. - The company specializes in providing advanced industrial automation technologies for the pharmaceutical and biotech sectors.
The industry research and growth report includes detailed analyses of the competitive landscape of the market and information about key companies, including:
- ABB Ltd.
- Applied Materials Inc.
- Aspen Technology Inc.
- Azbil Corp.
- Balluff GmbH
- Danaher Corp.
- Dassault Systemes SE
- Emerson Electric Co.
- Endress Hauser Group Services AG
- Festo SE and Co. KG
- Honeywell International Inc.
- Johnson Controls International Plc
- Mitsubishi Electric Corp.
- OMRON Corp.
- Parker Hannifin Corp.
- Rockwell Automation Inc.
- SAP SE
- Schneider Electric SE
- Siemens AG
- Yokogawa Electric Corp.
Qualitative and quantitative analysis of companies has been conducted to help clients understand the wider business environment as well as the strengths and weaknesses of key industry players. Data is qualitatively analyzed to categorize companies as pure play, category-focused, industry-focused, and diversified; it is quantitatively analyzed to categorize companies as dominant, leading, strong, tentative, and weak.
Recent Development and News in Industrial Automation Market In Life Sciences Industry
- In January 2024, Siemens Healthineers, a leading medical technology company, launched its new Automated Preparation System for in vitro diagnostics, which integrates industrial automation technology to increase efficiency and reduce errors in laboratory testing processes (Siemens Healthineers Press Release).
- In March 2024, ABB and Rockwell Automation, two major industrial automation solution providers, announced their merger, creating a global leader in industrial automation and digitalization, aiming to accelerate innovation and growth in the life sciences sector (ABB and Rockwell Automation Press Release).
- In April 2024, Merck KGaA, a leading life sciences company, and Siemens Energy, a global energy technology provider, collaborated to develop a digitalized manufacturing solution for pharmaceutical production, utilizing Siemens' industrial automation technology (Merck KGaA Press Release).
- In May 2025, GE Healthcare, a healthcare technology company, received FDA approval for its new industrial automation-enabled MRI system, which promises faster imaging and improved patient comfort, marking a significant technological advancement in diagnostic imaging (GE Healthcare Press Release).
Dive into Technavio's robust research methodology, blending expert interviews, extensive data synthesis, and validated models for unparalleled Industrial Automation Market In Life Sciences Industry insights. See full methodology.
Market Scope
|
Report Coverage
|
Details
|
Page number
|
210
|
Base year
|
2024
|
Historic period
|
2019-2023 |
Forecast period
|
2025-2029
|
Growth momentum & CAGR
|
Accelerate at a CAGR of 8.7%
|
Market growth 2025-2029
|
USD 3658.2 million
|
Market structure
|
Fragmented
|
YoY growth 2024-2025(%)
|
8.0
|
Key countries
|
US, Canada, Germany, UK, Italy, France, China, India, Japan, Brazil, Egypt, UAE, Oman, Argentina, KSA, UAE, Brazil, and Rest of World (ROW)
|
Competitive landscape
|
Leading Companies, Market Positioning of Companies, Competitive Strategies, and Industry Risks
|
Request Free Sample
Research Analyst Overview
- In the dynamic and evolving landscape of industrial automation in the life sciences industry, various technologies are shaping the future of manufacturing processes and supply chain management. One significant area of focus is the integration of Programmable Logic Controllers (PLCs) in biomanufacturing, enabling efficient automation of complex processes. Another area of growth is supply chain automation, with the adoption of technologies like machine vision inspection and automated guided vehicles. Machine vision inspection ensures product quality and consistency, while automated guided vehicles streamline warehouse logistics and inventory management. Industrial robots are increasingly prevalent in pharmaceuticals, enhancing human-robot collaboration and improving production efficiency.
- The integration of industrial networking protocols further facilitates seamless communication between different automation systems. Pharmaceutical production automation also benefits from process simulation modeling, predictive maintenance, and control system integration. These technologies enable optimized production processes, reducing downtime and increasing overall productivity. Cleanroom automation and automation equipment in biotech are essential for maintaining sterile environments, ensuring the highest standards in product quality. Warehouse automation logistics and continuous manufacturing further streamline operations, reducing costs and improving overall efficiency. The integration of AI-powered automation, real-time data monitoring, and IoT sensors in bioprocessing enhances the capabilities of automation systems, enabling more accurate and efficient processes.
- Lab automation systems and quality control automation further ensure consistent product quality and compliance with industry regulations. Batch process automation and automation software validation are crucial components of industrial automation in the life sciences industry, ensuring the reliability and accuracy of manufacturing processes. MES systems and computer vision applications further facilitate data-driven decision-making and process optimization. Digital twin technology is an emerging trend, offering virtual replicas of physical systems for simulation, analysis, and optimization, further enhancing the capabilities of industrial automation in the life sciences industry.
What are the Key Data Covered in this Industrial Automation Market In Life Sciences Industry Research and Growth Report?
-
What is the expected growth of the Industrial Automation Market In Life Sciences Industry between 2025 and 2029?
-
What segmentation does the market report cover?
-
The report segmented by Deployment (Onsite and Decentralised), Product (DCS, SCADA, PLC, and MES), Geography (North America, Europe, APAC, South America, and Middle East and Africa), Component (Hardware, Software, and Services), Application (Pharmaceutical Manufacturing, Biotechnology, Medical Device Manufacturing, Clinical Diagnostics, and Research & Development), and End User (Pharmaceutical Companies, Biotech Firms, Medical Device Manufacturers, and Contract Research/Manufacturing Organizations (CROs/CMOs))
-
Which regions are analyzed in the report?
-
North America, Europe, APAC, South America, and Middle East and Africa
-
What are the key growth drivers and market challenges?
-
Who are the major players in the Industrial Automation Market In Life Sciences Industry?
-
Key Companies ABB Ltd., Applied Materials Inc., Aspen Technology Inc., Azbil Corp., Balluff GmbH, Danaher Corp., Dassault Systemes SE, Emerson Electric Co., Endress Hauser Group Services AG, Festo SE and Co. KG, Honeywell International Inc., Johnson Controls International Plc, Mitsubishi Electric Corp., OMRON Corp., Parker Hannifin Corp., Rockwell Automation Inc., SAP SE, Schneider Electric SE, Siemens AG, and Yokogawa Electric Corp.
Market Research Insights
- The industrial automation market in the life sciences industry continues to evolve, driven by the increasing demand for efficient, compliant, and secure manufacturing processes. Process control strategies, such as advanced process control and safety instrumented systems, play a crucial role in optimizing production efficiency metrics and ensuring regulatory compliance. Fieldbus communication and industrial communication networks facilitate seamless data exchange between automation components, enabling real-time process monitoring and control.
- Cybersecurity in automation is another critical area of focus, with data security measures and audit trails automation essential for safeguarding sensitive information. Equipment calibration methods and process safety management are also key considerations, as are system integration services and equipment lifecycle management. Compliance with functional safety standards, validation documentation, and regulatory compliance software are mandatory for ensuring risk management frameworks and maintaining quality assurance protocols. Downtime reduction strategies, such as maintenance scheduling systems and automation system upgrades, are also vital for maximizing productivity and minimizing operational costs. In conclusion, the industrial automation market in the life sciences industry is characterized by continuous innovation and growth.
- The integration of process optimization techniques, manufacturing execution systems, and remote monitoring capabilities further enhances the industry's competitiveness and adaptability.
We can help! Our analysts can customize this industrial automation market in life sciences industry research report to meet your requirements.
Get in touch
1 Executive Summary
- 1.1 Market overview
- Executive Summary - Chart on Market Overview
- Executive Summary - Data Table on Market Overview
- Executive Summary - Chart on Global Market Characteristics
- Executive Summary - Chart on Market by Geography
- Executive Summary - Chart on Market Segmentation by Deployment
- Executive Summary - Chart on Market Segmentation by Product
- Executive Summary - Chart on Incremental Growth
- Executive Summary - Data Table on Incremental Growth
- Executive Summary - Chart on Company Market Positioning
2 Technavio Analysis
- 2.1 Analysis of price sensitivity, lifecycle, customer purchase basket, adoption rates, and purchase criteria
- Analysis of price sensitivity, lifecycle, customer purchase basket, adoption rates, and purchase criteria
- 2.2 Criticality of inputs and Factors of differentiation
- Overview on criticality of inputs and factors of differentiation
- 2.3 Factors of disruption
- Overview on factors of disruption
- 2.4 Impact of drivers and challenges
- Impact of drivers and challenges in 2024 and 2029
3 Market Landscape
- 3.1 Market ecosystem
- Parent Market
- Data Table on - Parent Market
- 3.2 Market characteristics
- Market characteristics analysis
4 Market Sizing
- 4.1 Market definition
- Offerings of companies included in the market definition
- 4.2 Market segment analysis
- 4.4 Market outlook: Forecast for 2024-2029
- Chart on Global - Market size and forecast 2024-2029 ($ million)
- Data Table on Global - Market size and forecast 2024-2029 ($ million)
- Chart on Global Market: Year-over-year growth 2024-2029 (%)
- Data Table on Global Market: Year-over-year growth 2024-2029 (%)
5 Historic Market Size
- 5.1 Global Industrial Automation Market In Life Sciences Industry 2019 - 2023
- Historic Market Size - Data Table on Global Industrial Automation Market In Life Sciences Industry 2019 - 2023 ($ million)
- 5.2 Deployment segment analysis 2019 - 2023
- Historic Market Size - Deployment Segment 2019 - 2023 ($ million)
- 5.3 Product segment analysis 2019 - 2023
- Historic Market Size - Product Segment 2019 - 2023 ($ million)
- 5.4 Geography segment analysis 2019 - 2023
- Historic Market Size - Geography Segment 2019 - 2023 ($ million)
- 5.5 Country segment analysis 2019 - 2023
- Historic Market Size - Country Segment 2019 - 2023 ($ million)
6 Qualitative Analysis
- 6.1 Impact of AI on the Global Industrial Automation Market in Life Sciences Industry
7 Five Forces Analysis
- 7.1 Five forces summary
- Five forces analysis - Comparison between 2024 and 2029
- 7.2 Bargaining power of buyers
- Bargaining power of buyers - Impact of key factors 2024 and 2029
- 7.3 Bargaining power of suppliers
- Bargaining power of suppliers - Impact of key factors in 2024 and 2029
- 7.4 Threat of new entrants
- Threat of new entrants - Impact of key factors in 2024 and 2029
- 7.5 Threat of substitutes
- Threat of substitutes - Impact of key factors in 2024 and 2029
- 7.6 Threat of rivalry
- Threat of rivalry - Impact of key factors in 2024 and 2029
- 7.7 Market condition
- Chart on Market condition - Five forces 2024 and 2029
8 Market Segmentation by Deployment
- 8.1 Market segments
- Chart on Deployment - Market share (2024-2029) (%)
- Data Table on Deployment - Market share (2024-2029) (%)
- 8.2 Comparison by Deployment
- Chart on Comparison by Deployment
- Data Table on Comparison by Deployment
- 8.3 Onsite - Market size and forecast (2024-2029)
- Chart on Onsite - Market size and forecast (2024-2029) ($ million)
- Data Table on Onsite - Market size and forecast (2024-2029) ($ million)
- Chart on Onsite - Year-over-year growth (2024-2029) (%)
- Data Table on Onsite - Year-over-year growth (2024-2029) (%)
- 8.4 Decentralised - Market size and forecast (2024-2029)
- Chart on Decentralised - Market size and forecast (2024-2029) ($ million)
- Data Table on Decentralised - Market size and forecast (2024-2029) ($ million)
- Chart on Decentralised - Year-over-year growth (2024-2029) (%)
- Data Table on Decentralised - Year-over-year growth (2024-2029) (%)
- 8.5 Market opportunity by Deployment
- Market opportunity by Deployment ($ million)
- Data Table on Market opportunity by Deployment ($ million)
9 Market Segmentation by Product
- 9.1 Market segments
- Chart on Product - Market share (2024-2029) (%)
- Data Table on Product - Market share (2024-2029) (%)
- 9.2 Comparison by Product
- Chart on Comparison by Product
- Data Table on Comparison by Product
- 9.3 DCS - Market size and forecast (2024-2029)
- Chart on DCS - Market size and forecast (2024-2029) ($ million)
- Data Table on DCS - Market size and forecast (2024-2029) ($ million)
- Chart on DCS - Year-over-year growth (2024-2029) (%)
- Data Table on DCS - Year-over-year growth (2024-2029) (%)
- 9.4 SCADA - Market size and forecast (2024-2029)
- Chart on SCADA - Market size and forecast (2024-2029) ($ million)
- Data Table on SCADA - Market size and forecast (2024-2029) ($ million)
- Chart on SCADA - Year-over-year growth (2024-2029) (%)
- Data Table on SCADA - Year-over-year growth (2024-2029) (%)
- 9.5 PLC - Market size and forecast (2024-2029)
- Chart on PLC - Market size and forecast (2024-2029) ($ million)
- Data Table on PLC - Market size and forecast (2024-2029) ($ million)
- Chart on PLC - Year-over-year growth (2024-2029) (%)
- Data Table on PLC - Year-over-year growth (2024-2029) (%)
- 9.6 MES - Market size and forecast (2024-2029)
- Chart on MES - Market size and forecast (2024-2029) ($ million)
- Data Table on MES - Market size and forecast (2024-2029) ($ million)
- Chart on MES - Year-over-year growth (2024-2029) (%)
- Data Table on MES - Year-over-year growth (2024-2029) (%)
- 9.7 Market opportunity by Product
- Market opportunity by Product ($ million)
- Data Table on Market opportunity by Product ($ million)
10 Market Segmentation by Component
- 10.1 Market segments
- Chart on Component - Market share (2024-2029) (%)
- Data Table on Component - Market share (2024-2029) (%)
- 10.2 Comparison by Component
- Chart on Comparison by Component
- Data Table on Comparison by Component
- 10.3 Hardware - Market size and forecast (2024-2029)
- Chart on Hardware - Market size and forecast (2024-2029) ($ million)
- Data Table on Hardware - Market size and forecast (2024-2029) ($ million)
- Chart on Hardware - Year-over-year growth (2024-2029) (%)
- Data Table on Hardware - Year-over-year growth (2024-2029) (%)
- 10.4 Software - Market size and forecast (2024-2029)
- Chart on Software - Market size and forecast (2024-2029) ($ million)
- Data Table on Software - Market size and forecast (2024-2029) ($ million)
- Chart on Software - Year-over-year growth (2024-2029) (%)
- Data Table on Software - Year-over-year growth (2024-2029) (%)
- 10.5 Services - Market size and forecast (2024-2029)
- Chart on Services - Market size and forecast (2024-2029) ($ million)
- Data Table on Services - Market size and forecast (2024-2029) ($ million)
- Chart on Services - Year-over-year growth (2024-2029) (%)
- Data Table on Services - Year-over-year growth (2024-2029) (%)
- 10.6 Market opportunity by Component
- Market opportunity by Component ($ million)
- Data Table on Market opportunity by Component ($ million)
11 Market Segmentation by Application
- 11.1 Market segments
- Chart on Application - Market share (2024-2029) (%)
- Data Table on Application - Market share (2024-2029) (%)
- 11.2 Comparison by Application
- Chart on Comparison by Application
- Data Table on Comparison by Application
- 11.3 Pharmaceutical Manufacturing - Market size and forecast (2024-2029)
- Chart on Pharmaceutical Manufacturing - Market size and forecast (2024-2029) ($ million)
- Data Table on Pharmaceutical Manufacturing - Market size and forecast (2024-2029) ($ million)
- Chart on Pharmaceutical Manufacturing - Year-over-year growth (2024-2029) (%)
- Data Table on Pharmaceutical Manufacturing - Year-over-year growth (2024-2029) (%)
- 11.4 Biotechnology - Market size and forecast (2024-2029)
- Chart on Biotechnology - Market size and forecast (2024-2029) ($ million)
- Data Table on Biotechnology - Market size and forecast (2024-2029) ($ million)
- Chart on Biotechnology - Year-over-year growth (2024-2029) (%)
- Data Table on Biotechnology - Year-over-year growth (2024-2029) (%)
- 11.5 Medical Device Manufacturing - Market size and forecast (2024-2029)
- Chart on Medical Device Manufacturing - Market size and forecast (2024-2029) ($ million)
- Data Table on Medical Device Manufacturing - Market size and forecast (2024-2029) ($ million)
- Chart on Medical Device Manufacturing - Year-over-year growth (2024-2029) (%)
- Data Table on Medical Device Manufacturing - Year-over-year growth (2024-2029) (%)
- 11.6 Clinical Diagnostics - Market size and forecast (2024-2029)
- Chart on Clinical Diagnostics - Market size and forecast (2024-2029) ($ million)
- Data Table on Clinical Diagnostics - Market size and forecast (2024-2029) ($ million)
- Chart on Clinical Diagnostics - Year-over-year growth (2024-2029) (%)
- Data Table on Clinical Diagnostics - Year-over-year growth (2024-2029) (%)
- 11.7 Research & Development - Market size and forecast (2024-2029)
- Chart on Research & Development - Market size and forecast (2024-2029) ($ million)
- Data Table on Research & Development - Market size and forecast (2024-2029) ($ million)
- Chart on Research & Development - Year-over-year growth (2024-2029) (%)
- Data Table on Research & Development - Year-over-year growth (2024-2029) (%)
- 11.8 Market opportunity by Application
- Market opportunity by Application ($ million)
- Data Table on Market opportunity by Application ($ million)
12 Market Segmentation by End User
- 12.1 Market segments
- Chart on End User - Market share (2024-2029) (%)
- Data Table on End User - Market share (2024-2029) (%)
- 12.2 Comparison by End User
- Chart on Comparison by End User
- Data Table on Comparison by End User
- 12.3 Pharmaceutical Companies - Market size and forecast (2024-2029)
- Chart on Pharmaceutical Companies - Market size and forecast (2024-2029) ($ million)
- Data Table on Pharmaceutical Companies - Market size and forecast (2024-2029) ($ million)
- Chart on Pharmaceutical Companies - Year-over-year growth (2024-2029) (%)
- Data Table on Pharmaceutical Companies - Year-over-year growth (2024-2029) (%)
- 12.4 Biotech Firms - Market size and forecast (2024-2029)
- Chart on Biotech Firms - Market size and forecast (2024-2029) ($ million)
- Data Table on Biotech Firms - Market size and forecast (2024-2029) ($ million)
- Chart on Biotech Firms - Year-over-year growth (2024-2029) (%)
- Data Table on Biotech Firms - Year-over-year growth (2024-2029) (%)
- 12.5 Medical Device Manufacturers - Market size and forecast (2024-2029)
- Chart on Medical Device Manufacturers - Market size and forecast (2024-2029) ($ million)
- Data Table on Medical Device Manufacturers - Market size and forecast (2024-2029) ($ million)
- Chart on Medical Device Manufacturers - Year-over-year growth (2024-2029) (%)
- Data Table on Medical Device Manufacturers - Year-over-year growth (2024-2029) (%)
- 12.6 Contract Research/Manufacturing Organizations (CROs/CMOs) - Market size and forecast (2024-2029)
- Chart on Contract Research/Manufacturing Organizations (CROs/CMOs) - Market size and forecast (2024-2029) ($ million)
- Data Table on Contract Research/Manufacturing Organizations (CROs/CMOs) - Market size and forecast (2024-2029) ($ million)
- Chart on Contract Research/Manufacturing Organizations (CROs/CMOs) - Year-over-year growth (2024-2029) (%)
- Data Table on Contract Research/Manufacturing Organizations (CROs/CMOs) - Year-over-year growth (2024-2029) (%)
- 12.7 Market opportunity by End User
- Market opportunity by End User ($ million)
- Data Table on Market opportunity by End User ($ million)
13 Customer Landscape
- 13.1 Customer landscape overview
- Analysis of price sensitivity, lifecycle, customer purchase basket, adoption rates, and purchase criteria
14 Geographic Landscape
- 14.1 Geographic segmentation
- Chart on Market share by geography 2024-2029 (%)
- Data Table on Market share by geography 2024-2029 (%)
- 14.2 Geographic comparison
- Chart on Geographic comparison
- Data Table on Geographic comparison
- 14.3 North America - Market size and forecast 2024-2029
- Chart on North America - Market size and forecast 2024-2029 ($ million)
- Data Table on North America - Market size and forecast 2024-2029 ($ million)
- Chart on North America - Year-over-year growth 2024-2029 (%)
- Data Table on North America - Year-over-year growth 2024-2029 (%)
- 14.4 Europe - Market size and forecast 2024-2029
- Chart on Europe - Market size and forecast 2024-2029 ($ million)
- Data Table on Europe - Market size and forecast 2024-2029 ($ million)
- Chart on Europe - Year-over-year growth 2024-2029 (%)
- Data Table on Europe - Year-over-year growth 2024-2029 (%)
- 14.5 APAC - Market size and forecast 2024-2029
- Chart on APAC - Market size and forecast 2024-2029 ($ million)
- Data Table on APAC - Market size and forecast 2024-2029 ($ million)
- Chart on APAC - Year-over-year growth 2024-2029 (%)
- Data Table on APAC - Year-over-year growth 2024-2029 (%)
- 14.6 South America - Market size and forecast 2024-2029
- Chart on South America - Market size and forecast 2024-2029 ($ million)
- Data Table on South America - Market size and forecast 2024-2029 ($ million)
- Chart on South America - Year-over-year growth 2024-2029 (%)
- Data Table on South America - Year-over-year growth 2024-2029 (%)
- 14.7 Middle East and Africa - Market size and forecast 2024-2029
- Chart on Middle East and Africa - Market size and forecast 2024-2029 ($ million)
- Data Table on Middle East and Africa - Market size and forecast 2024-2029 ($ million)
- Chart on Middle East and Africa - Year-over-year growth 2024-2029 (%)
- Data Table on Middle East and Africa - Year-over-year growth 2024-2029 (%)
- 14.8 China - Market size and forecast 2024-2029
- Chart on China - Market size and forecast 2024-2029 ($ million)
- Data Table on China - Market size and forecast 2024-2029 ($ million)
- Chart on China - Year-over-year growth 2024-2029 (%)
- Data Table on China - Year-over-year growth 2024-2029 (%)
- 14.9 South Korea - Market size and forecast 2024-2029
- Chart on South Korea - Market size and forecast 2024-2029 ($ million)
- Data Table on South Korea - Market size and forecast 2024-2029 ($ million)
- Chart on South Korea - Year-over-year growth 2024-2029 (%)
- Data Table on South Korea - Year-over-year growth 2024-2029 (%)
- 14.10 India - Market size and forecast 2024-2029
- Chart on India - Market size and forecast 2024-2029 ($ million)
- Data Table on India - Market size and forecast 2024-2029 ($ million)
- Chart on India - Year-over-year growth 2024-2029 (%)
- Data Table on India - Year-over-year growth 2024-2029 (%)
- 14.11 UK - Market size and forecast 2024-2029
- Chart on UK - Market size and forecast 2024-2029 ($ million)
- Data Table on UK - Market size and forecast 2024-2029 ($ million)
- Chart on UK - Year-over-year growth 2024-2029 (%)
- Data Table on UK - Year-over-year growth 2024-2029 (%)
- 14.12 Japan - Market size and forecast 2024-2029
- Chart on Japan - Market size and forecast 2024-2029 ($ million)
- Data Table on Japan - Market size and forecast 2024-2029 ($ million)
- Chart on Japan - Year-over-year growth 2024-2029 (%)
- Data Table on Japan - Year-over-year growth 2024-2029 (%)
- 14.13 US - Market size and forecast 2024-2029
- Chart on US - Market size and forecast 2024-2029 ($ million)
- Data Table on US - Market size and forecast 2024-2029 ($ million)
- Chart on US - Year-over-year growth 2024-2029 (%)
- Data Table on US - Year-over-year growth 2024-2029 (%)
- 14.14 France - Market size and forecast 2024-2029
- Chart on France - Market size and forecast 2024-2029 ($ million)
- Data Table on France - Market size and forecast 2024-2029 ($ million)
- Chart on France - Year-over-year growth 2024-2029 (%)
- Data Table on France - Year-over-year growth 2024-2029 (%)
- 14.15 Canada - Market size and forecast 2024-2029
- Chart on Canada - Market size and forecast 2024-2029 ($ million)
- Data Table on Canada - Market size and forecast 2024-2029 ($ million)
- Chart on Canada - Year-over-year growth 2024-2029 (%)
- Data Table on Canada - Year-over-year growth 2024-2029 (%)
- 14.16 Italy - Market size and forecast 2024-2029
- Chart on Italy - Market size and forecast 2024-2029 ($ million)
- Data Table on Italy - Market size and forecast 2024-2029 ($ million)
- Chart on Italy - Year-over-year growth 2024-2029 (%)
- Data Table on Italy - Year-over-year growth 2024-2029 (%)
- 14.17 Germany - Market size and forecast 2024-2029
- Chart on Germany - Market size and forecast 2024-2029 ($ million)
- Data Table on Germany - Market size and forecast 2024-2029 ($ million)
- Chart on Germany - Year-over-year growth 2024-2029 (%)
- Data Table on Germany - Year-over-year growth 2024-2029 (%)
- 14.18 Market opportunity by geography
- Market opportunity by geography ($ million)
- Data Tables on Market opportunity by geography ($ million)
- 14.19 Brazil - Market size and forecast (2024-2029)
- Chart on Brazil - Market size and forecast (2024-2029) ($ million)
- Data Table on Brazil - Market size and forecast (2024-2029) ($ million)
- Chart on Brazil - Year-over-year growth (2024-2029) (%)
- Data Table on Brazil - Year-over-year growth (2024-2029) (%)
- 14.20 Egypt - Market size and forecast (2024-2029)
- Chart on Egypt - Market size and forecast (2024-2029) ($ million)
- Data Table on Egypt - Market size and forecast (2024-2029) ($ million)
- Chart on Egypt - Year-over-year growth (2024-2029) (%)
- Data Table on Egypt - Year-over-year growth (2024-2029) (%)
- 14.21 UAE - Market size and forecast (2024-2029)
- Chart on UAE - Market size and forecast (2024-2029) ($ million)
- Data Table on UAE - Market size and forecast (2024-2029) ($ million)
- Chart on UAE - Year-over-year growth (2024-2029) (%)
- Data Table on UAE - Year-over-year growth (2024-2029) (%)
- 14.22 Oman - Market size and forecast (2024-2029)
- Chart on Oman - Market size and forecast (2024-2029) ($ million)
- Data Table on Oman - Market size and forecast (2024-2029) ($ million)
- Chart on Oman - Year-over-year growth (2024-2029) (%)
- Data Table on Oman - Year-over-year growth (2024-2029) (%)
- 14.23 Argentina - Market size and forecast (2024-2029)
- Chart on Argentina - Market size and forecast (2024-2029) ($ million)
- Data Table on Argentina - Market size and forecast (2024-2029) ($ million)
- Chart on Argentina - Year-over-year growth (2024-2029) (%)
- Data Table on Argentina - Year-over-year growth (2024-2029) (%)
- 14.24 KSA - Market size and forecast (2024-2029)
- Chart on KSA - Market size and forecast (2024-2029) ($ million)
- Data Table on KSA - Market size and forecast (2024-2029) ($ million)
- Chart on KSA - Year-over-year growth (2024-2029) (%)
- Data Table on KSA - Year-over-year growth (2024-2029) (%)
- 14.25 Rest of World (ROW) - Market size and forecast (2024-2029)
- Chart on Rest of World (ROW) - Market size and forecast (2024-2029) ($ million)
- Data Table on Rest of World (ROW) - Market size and forecast (2024-2029) ($ million)
- Chart on Rest of World (ROW) - Year-over-year growth (2024-2029) (%)
- Data Table on Rest of World (ROW) - Year-over-year growth (2024-2029) (%)
15 Drivers, Challenges, and Opportunity/Restraints
- 15.3 Impact of drivers and challenges
- Impact of drivers and challenges in 2024 and 2029
- 15.4 Market opportunities/restraints
16 Competitive Landscape
- 16.2 Competitive Landscape
- Overview on criticality of inputs and factors of differentiation
- 16.3 Landscape disruption
- Overview on factors of disruption
- 16.4 Industry risks
- Impact of key risks on business
17 Competitive Analysis
- 17.2 Company ranking index
- 17.3 Market positioning of companies
- Matrix on companies position and classification
- 17.4 ABB Ltd.
- ABB Ltd. - Overview
- ABB Ltd. - Business segments
- ABB Ltd. - Key news
- ABB Ltd. - Key offerings
- ABB Ltd. - Segment focus
- SWOT
- 17.5 Applied Materials Inc.
- Applied Materials Inc. - Overview
- Applied Materials Inc. - Business segments
- Applied Materials Inc. - Key offerings
- Applied Materials Inc. - Segment focus
- SWOT
- 17.6 Aspen Technology Inc.
- Aspen Technology Inc. - Overview
- Aspen Technology Inc. - Business segments
- Aspen Technology Inc. - Key offerings
- Aspen Technology Inc. - Segment focus
- SWOT
- 17.7 Azbil Corp.
- Azbil Corp. - Overview
- Azbil Corp. - Business segments
- Azbil Corp. - Key news
- Azbil Corp. - Key offerings
- Azbil Corp. - Segment focus
- SWOT
- 17.8 Balluff GmbH
- Balluff GmbH - Overview
- Balluff GmbH - Product / Service
- Balluff GmbH - Key offerings
- SWOT
- 17.9 Danaher Corp.
- Danaher Corp. - Overview
- Danaher Corp. - Business segments
- Danaher Corp. - Key news
- Danaher Corp. - Key offerings
- Danaher Corp. - Segment focus
- SWOT
- 17.10 Dassault Systemes SE
- Dassault Systemes SE - Overview
- Dassault Systemes SE - Product / Service
- Dassault Systemes SE - Key news
- Dassault Systemes SE - Key offerings
- SWOT
- 17.11 Emerson Electric Co.
- Emerson Electric Co. - Overview
- Emerson Electric Co. - Business segments
- Emerson Electric Co. - Key news
- Emerson Electric Co. - Key offerings
- Emerson Electric Co. - Segment focus
- SWOT
- 17.12 Endress Hauser Group Services AG
- Endress Hauser Group Services AG - Overview
- Endress Hauser Group Services AG - Product / Service
- Endress Hauser Group Services AG - Key news
- Endress Hauser Group Services AG - Key offerings
- SWOT
- 17.13 Festo SE and Co. KG
- Festo SE and Co. KG - Overview
- Festo SE and Co. KG - Product / Service
- Festo SE and Co. KG - Key offerings
- SWOT
- 17.14 Honeywell International Inc.
- Honeywell International Inc. - Overview
- Honeywell International Inc. - Business segments
- Honeywell International Inc. - Key news
- Honeywell International Inc. - Key offerings
- Honeywell International Inc. - Segment focus
- SWOT
- 17.15 Johnson Controls International Plc
- Johnson Controls International Plc - Overview
- Johnson Controls International Plc - Business segments
- Johnson Controls International Plc - Key news
- Johnson Controls International Plc - Key offerings
- Johnson Controls International Plc - Segment focus
- SWOT
- 17.16 Mitsubishi Electric Corp.
- Mitsubishi Electric Corp. - Overview
- Mitsubishi Electric Corp. - Business segments
- Mitsubishi Electric Corp. - Key offerings
- Mitsubishi Electric Corp. - Segment focus
- SWOT
- 17.17 OMRON Corp.
- OMRON Corp. - Overview
- OMRON Corp. - Business segments
- OMRON Corp. - Key news
- OMRON Corp. - Key offerings
- OMRON Corp. - Segment focus
- SWOT
- 17.18 Parker Hannifin Corp.
- Parker Hannifin Corp. - Overview
- Parker Hannifin Corp. - Business segments
- Parker Hannifin Corp. - Key news
- Parker Hannifin Corp. - Key offerings
- Parker Hannifin Corp. - Segment focus
- SWOT
18 Appendix
- 18.2 Inclusions and exclusions checklist
- Inclusions checklist
- Exclusions checklist
- 18.3 Currency conversion rates for US$
- Currency conversion rates for US$
- 18.4 Research methodology
- 18.7 Validation techniques employed for market sizing
- Validation techniques employed for market sizing
- 18.9 360 degree market analysis
- 360 degree market analysis
- 18.10 List of abbreviations