Industrial Cleaners Market Size and Growth Forecast 2026-2030
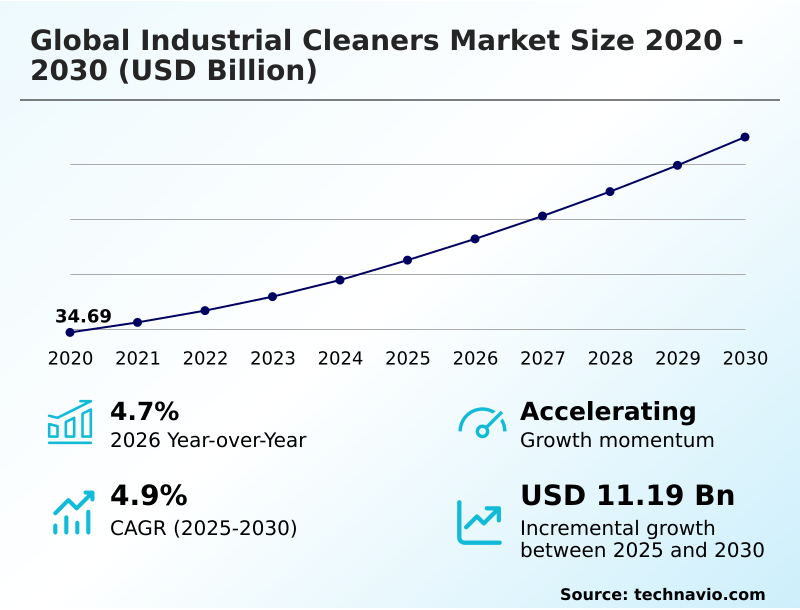
The Industrial Cleaners Market size was valued at USD 41.26 billion in 2025 growing at a CAGR of 4.9% during the forecast period 2026-2030.
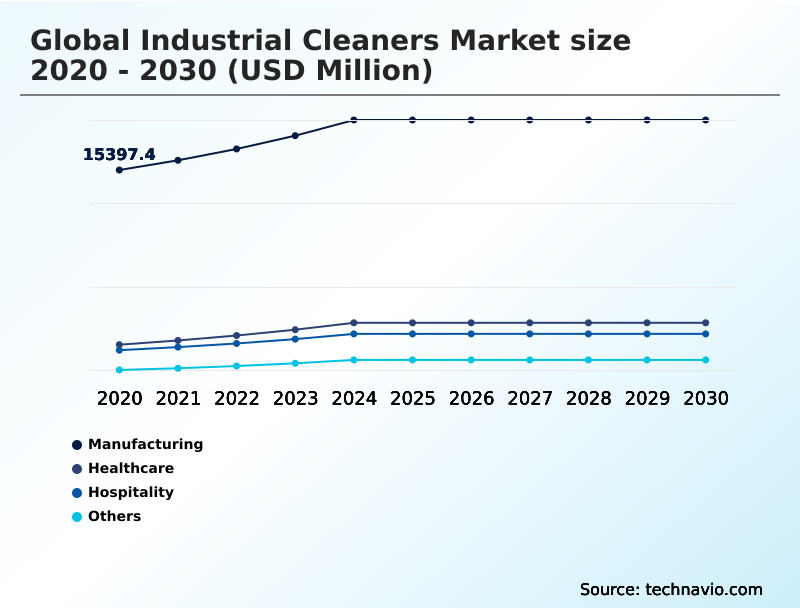
APAC accounts for 44.6% of incremental growth during the forecast period. The Manufacturing segment by End-user was valued at USD 17.82 billion in 2024, while the Liquids segment holds the largest revenue share by Type.
The market is projected to grow by USD 17.76 billion from 2020 to 2030, with USD 11.19 billion of the growth expected during the forecast period of 2025 to 2030.
Get Key Insights on Market Forecast (PDF) Request Free Sample
Industrial Cleaners Market Overview
The industrial cleaners market is advancing beyond conventional formulations, driven by a convergence of regulatory pressures and operational efficiency mandates. With APAC contributing 44.6% of the market's incremental growth, the demand for specialized solutions is accelerating, particularly in high-stakes environments. For instance, a large-scale food processing facility implementing automated clean-in-place (CIP) systems relies on certified food-grade sanitizers and heavy-duty degreasers to ensure compliance with Food Safety Authority standards and prevent microbial contamination. This requires a shift to high-purity chemicals and enzymatic cleaning solutions that are both effective and safe for food-contact surfaces. The adoption of biodegradable surfactants and bio-based solvents further reflects the industry's commitment to sustainability without compromising performance. This pivot toward green chemistry principles, alongside the integration of robotic cleaning solutions for floor maintenance, defines the strategic direction for procurement decision-makers balancing compliance, safety, and total cost of ownership.
Drivers, Trends, and Challenges in the Industrial Cleaners Market
Strategic procurement in the industrial cleaners market now involves a complex evaluation of total cost of ownership, where the initial price of a product is weighed against long-term operational and compliance expenditures. The impact of REACH regulations on cleaner formulations forces a continuous reformulation cycle, pushing manufacturers toward safer, more sustainable alternatives.
This challenges buyers to assess the performance of bio-based vs. chemical degreasers in their specific applications. For example, a food processing plant must validate that a new bio-based degreaser meets performance benchmarks for removing fats and proteins without leaving residues, a process that influences both food safety and equipment longevity.
The ROI of automated industrial cleaning systems is another critical calculation; a facility investing in autonomous scrubbers must factor in reduced labor, water, and chemical usage, which can offset the high upfront capital expenditure. A key metric is the reduction in water consumption, which can be over 30% compared to manual methods.
This decision-making is further complicated by the need for compliance with EPA Safer Choice standards and understanding the true cost of sustainable industrial cleaner formulations, which includes sourcing, stability, and disposal considerations.
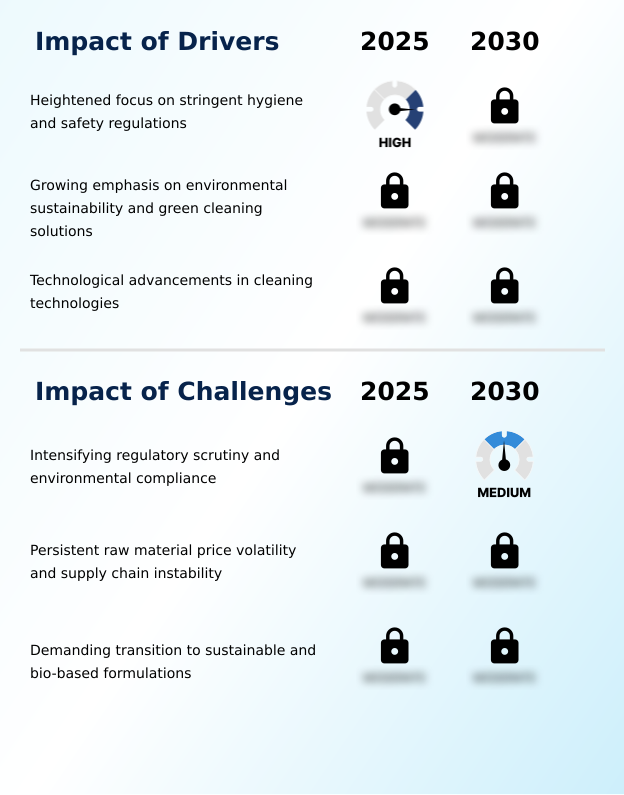
Primary Growth Driver: A heightened focus on stringent hygiene and safety regulations is a primary driver propelling growth in the industrial cleaners market.
Market growth is primarily driven by stringent hygiene regulations and technological advancements that enhance cleaning efficacy and operational efficiency.
Governmental bodies in North America and Europe are enforcing stricter rules, such as the European Green Deal, compelling industries to adopt low-VOC formulations and green chemistry principles. This regulatory pressure is a significant factor in the market's 4.7% year-over-year growth.
Concurrently, technological innovation is revolutionizing cleaning processes. The adoption of autonomous floor scrubbers and industrial robot vacuums in large-scale facilities provides consistent, measurable cleaning with reduced human intervention.
These systems, often powered by machine learning algorithms for cleaning, optimize routes and resource usage, directly addressing industry needs for higher productivity and enhanced worker safety.
Emerging Market Trend: The ascendancy of green and bio-based formulations signifies a critical market trend. This shift is driven by heightened environmental awareness and stringent regulatory mandates.
Key market trends are centered on the adoption of sustainable technologies and automation to meet both regulatory and efficiency demands. The shift toward green chemistry principles is evident in the development of bio-based solvents and plant-derived ingredients, which are increasingly specified in procurement contracts to align with corporate sustainability goals. Simultaneously, the integration of automation is transforming facility maintenance.
For instance, the deployment of robotic cleaning solutions, particularly in the manufacturing and logistics sectors in APAC, is addressing labor shortages and ensuring consistent hygiene. This is complemented by the rise of IoT-enabled cleaning management, which utilizes real-time data to optimize cleaning schedules and predict maintenance for equipment, marking a move from scheduled to on-demand service delivery across industrial operations.
Key Industry Challenge: Intensifying regulatory scrutiny and the complexities of environmental compliance present a significant challenge to industry growth.
A primary market challenge is navigating the complex and costly transition to sustainable formulations amid volatile supply chains. The demand for products made from sustainable raw materials is accelerating, yet sourcing these materials can be more expensive and less predictable than conventional petrochemical feedstocks. This puts pressure on manufacturers to invest heavily in R&D to create effective yet cost-competitive solutions.
Furthermore, compliance with intensifying regulatory standards, such as the EPA Safer Choice program, requires continuous product reformulation and verification, adding to operational costs.
This is compounded by supply chain instabilities, which can lead to price hikes and shortages of critical components like chelating agents, forcing companies to balance sustainability goals with the practical need for consistent and affordable high-pressure washing and cleaning operations.
Explore Full Market Dynamics Analysis Request Free Sample
Industrial Cleaners Market Segmentation
The industrial cleaners industry research report provides comprehensive data including region-wise segment analysis, with forecasts and analysis for the period 2026-2030, as well as historical data from 2020-2024 for the following segments.
End-user Segment Analysis
The manufacturing segment is estimated to witness significant growth during the forecast period.
The manufacturing segment's demand for industrial cleaners is shaped by stringent operational requirements for maintaining asset integrity and ensuring worker safety under OSHA guidelines.
Within this sector, which accounts for a dominant share of the market, the focus is on specialized solutions like aqueous metal cleaners and solvent-free degreasers for precision parts washing.
Facilities are increasingly implementing closed-loop cleaning systems to minimize waste and comply with environmental mandates.
The transition toward high-performance, water-based cleaning agents is driven by the need to remove tough industrial soils from machinery without using harsh chemicals, optimizing both production uptime and workplace health.
This move reflects a broader industry commitment to integrating sustainable practices directly into core manufacturing processes, with an emphasis on phosphate-free cleaners.
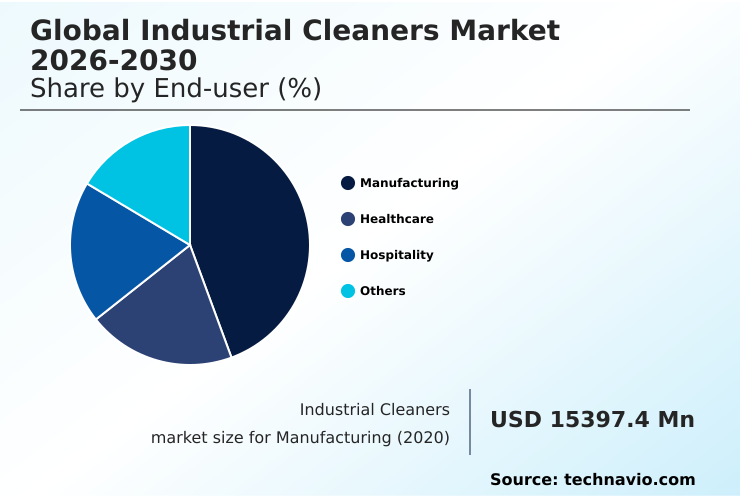
The Manufacturing segment was valued at USD 17.82 billion in 2024 and showed a gradual increase during the forecast period.
Industrial Cleaners Market by Region: APAC Leads with 44.6% Growth Share
APAC is estimated to contribute 44.6% to the growth of the global market during the forecast period.
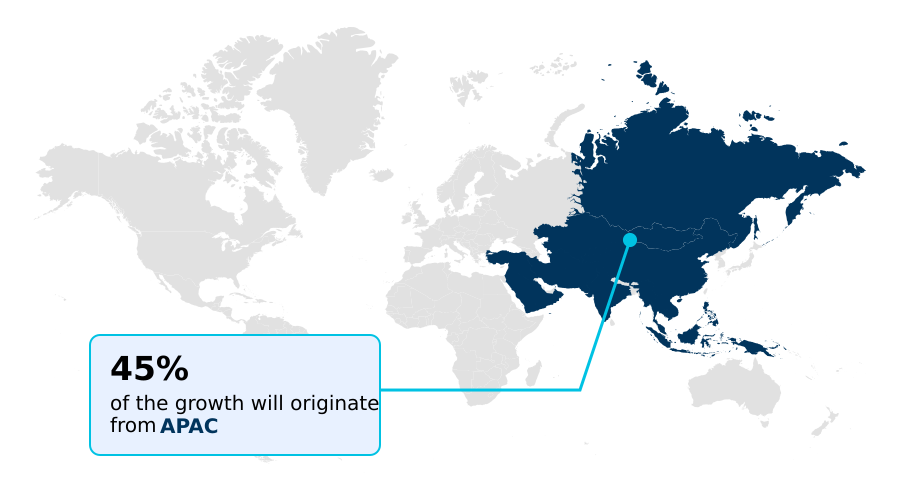
The geographic landscape of the industrial cleaners market is led by APAC, which accounts for 44.6% of incremental growth, driven by rapid industrialization in China and India.
In this region, the demand is centered on cleaning solutions for manufacturing, electronics, and food processing, necessitating effective chemical cleaning and the use of specialized food-grade sanitizers.
In contrast, markets in North America and Europe, which together represent over 40% of the opportunity, are primarily influenced by stringent environmental regulations like REACH. This drives the adoption of eco-friendly industrial cleaners and water-soluble detergents.
In North America, the focus is on high-performance, sustainable products that comply with EPA standards, while Europe prioritizes circular economy principles, boosting demand for concentrated cleaning chemicals that reduce packaging and transport emissions.
Customer Landscape Analysis for the Industrial Cleaners Market
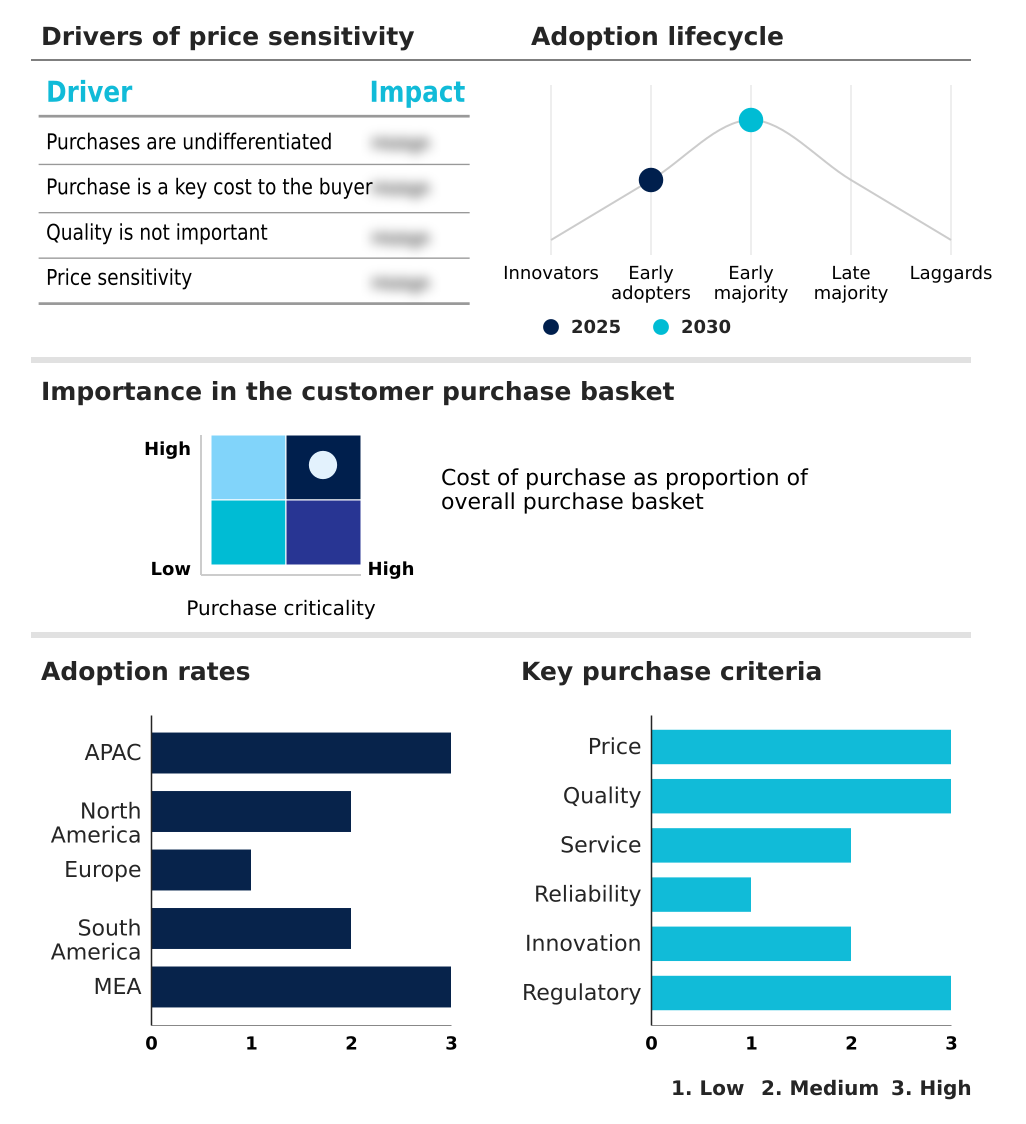
The industrial cleaners market forecasting report includes the adoption lifecycle of the market, covering from the innovator’s stage to the laggard’s stage. It focuses on adoption rates in different regions based on penetration. Furthermore, the industrial cleaners market report also includes key purchase criteria and drivers of price sensitivity to help companies evaluate and develop their market growth analysis strategies.
Competitive Landscape of the Industrial Cleaners Market
Companies are implementing various strategies, such as strategic alliances, partnerships, mergers and acquisitions, geographical expansion, and product/service launches, to enhance their presence in the industrial cleaners market industry.
3M Co. - Offerings center on specialized, high-performance formulations for industrial hygiene, parts washing, surface preparation, and environmental services, addressing diverse sector-specific cleaning requirements.
The industry research and growth report includes detailed analyses of the competitive landscape of the market and information about key companies, including:
- 3M Co.
- BASF SE
- Clariant International Ltd.
- Clean Harbors Inc.
- Croda International Plc
- Dow Chemical Co.
- Ecolab Inc.
- Elixir Home Care Pvt. Ltd.
- Evonik Industries AG
- Henkel AG and Co. KGaA
- Huntsman International LLC
- Kao Corp.
- Nyco Products Co.
- Solenis
- Solvay SA
- Stepan Co.
- Procter and Gamble Co.
- Zep Inc.
Qualitative and quantitative analysis of companies has been conducted to help clients understand the wider business environment as well as the strengths and weaknesses of key industry players. Data is qualitatively analyzed to categorize companies as pure play, category-focused, industry-focused, and diversified; it is quantitatively analyzed to categorize companies as dominant, leading, strong, tentative, and weak.
Recent Developments in the Industrial Cleaners Market
- In August 2024, Ecolab Inc. expanded its Ecolab Scientific Clean retail product line, launching new professional-strength industrial degreasers to make commercial-grade technologies more accessible to a broader professional and do-it-yourself market.
- In August 2024, Robotize, an Israeli robotics firm, signed an exclusive distribution agreement with Kemaro AG to market the K900 autonomous industrial cleaning robot, a solution designed to address labor shortages and meet high cleanliness standards in industrial facilities.
- In August 2024, the US Environmental Protection Agency (EPA) finalized updates to its Safer Choice Standard, strengthening criteria for packaging sustainability and explicitly banning intentionally added per- and polyfluoroalkyl substances (PFAS) in certified cleaning products.
- In December 2024, the US Environmental Protection Agency (EPA) announced a final rule under the Toxic Substances Control Act (TSCA) to phase out most industrial and commercial uses of perchloroethylene (PCE), a common solvent in degreasing and dry cleaning.
Research Analyst Overview: Industrial Cleaners Market
The industrial cleaners market is undergoing a significant technical evolution, as end-users move from procurement based on unit price to a total cost of ownership model that incorporates compliance, safety, and sustainability. Boardroom-level decisions on capital expenditures now frequently include evaluations of automated and robotic cleaning systems, which promise long-term operational savings despite high initial investment.
This shift is reinforced by stringent regulatory frameworks, such as the EPA's Safer Choice Standard, which sets criteria for low-VOC formulations and the use of biodegradable surfactants. Innovation is centered on performance and sustainability, with enzymatic cleaning solutions and advanced water-soluble detergents gaining adoption for specialized tasks like precision cleaning of high-value components.
The development of antimicrobial surfaces is also altering maintenance cycles in hygiene-critical sectors like healthcare and food processing, which represent a significant portion of the market. Formulations based on plant-derived ingredients and other sustainable raw materials are no longer niche but are central to vendor qualification criteria for major industrial buyers.
Dive into Technavio’s robust research methodology, blending expert interviews, extensive data synthesis, and validated models for unparalleled Industrial Cleaners Market insights. See full methodology.
| Market Scope | |
|---|---|
| Page number | 324 |
| Base year | 2025 |
| Historic period | 2020-2024 |
| Forecast period | 2026-2030 |
| Growth momentum & CAGR | Accelerate at a CAGR of 4.9% |
| Market growth 2026-2030 | USD 11187.0 million |
| Market structure | Fragmented |
| YoY growth 2025-2026(%) | 4.7% |
| Key countries | China, Japan, India, South Korea, Australia, Indonesia, US, Canada, Mexico, Germany, UK, France, Italy, Spain, The Netherlands, Brazil, Argentina, Colombia, Saudi Arabia, UAE, South Africa, Israel and Turkey |
| Competitive landscape | Leading Companies, Market Positioning of Companies, Competitive Strategies, and Industry Risks |
Industrial Cleaners Market: Key Questions Answered in This Report
-
What is the expected growth of the Industrial Cleaners Market between 2026 and 2030?
-
The Industrial Cleaners Market is expected to grow by USD 11.19 billion during 2026-2030, registering a CAGR of 4.9%. Year-over-year growth in 2026 is estimated at 4.7%%. This acceleration is shaped by heightened focus on stringent hygiene and safety regulations, which is intensifying demand across multiple end-use verticals covered in the report.
-
-
What segmentation does the market report cover?
-
The report is segmented by End-user (Manufacturing, Healthcare, Hospitality, and Others), Type (Liquids, Powders, Concentrates, Aerosols, and Gels), Application (Floor cleaning, Metal cleaning, Food processing, Glass cleaning, and Textile cleaning) and Geography (APAC, North America, Europe, South America, Middle East and Africa). Among these, the Manufacturing segment is estimated to witness significant growth during the forecast period, driven by rising adoption across key application areas. Each segment includes detailed qualitative and quantitative analysis, along with historical data from 2020-2024 and forecasts through 2030 with year-over-year growth rates.
-
-
Which regions are analyzed in the report?
-
The report covers APAC, North America, Europe, South America and Middle East and Africa. APAC is estimated to contribute 44.6% to market growth during the forecast period. Country-level analysis includes China, Japan, India, South Korea, Australia, Indonesia, US, Canada, Mexico, Germany, UK, France, Italy, Spain, The Netherlands, Brazil, Argentina, Colombia, Saudi Arabia, UAE, South Africa, Israel and Turkey, with dedicated market size tables and year-over-year growth for each.
-
-
What are the key growth drivers and market challenges?
-
The primary driver is heightened focus on stringent hygiene and safety regulations, which is accelerating investment and industry demand. The main challenge is intensifying regulatory scrutiny and environmental compliance, creating operational barriers for key market participants. The report quantifies the impact of each driver and challenge across 2026 and 2030 with comparative analysis.
-
-
Who are the major players in the Industrial Cleaners Market?
-
Key vendors include 3M Co., BASF SE, Clariant International Ltd., Clean Harbors Inc., Croda International Plc, Dow Chemical Co., Ecolab Inc., Elixir Home Care Pvt. Ltd., Evonik Industries AG, Henkel AG and Co. KGaA, Huntsman International LLC, Kao Corp., Nyco Products Co., Solenis, Solvay SA, Stepan Co., Procter and Gamble Co. and Zep Inc.. The report provides qualitative and quantitative analysis categorizing companies as dominant, leading, strong, tentative, and weak based on their market positioning. Company profiles include business segment analysis, SWOT assessment, key offerings, and recent strategic developments.
-
Industrial Cleaners Market Research Insights
Market dynamics are increasingly shaped by the dual pressures of regulatory compliance and the pursuit of operational efficiency, reflected in a year-over-year growth of 4.7%. The adoption of smart cleaning systems and IoT-enabled cleaning management is becoming standard practice for optimizing resource allocation.
For example, large logistics centers deploy autonomous floor scrubbers that provide data-driven cleaning protocols, ensuring consistent hygiene standards while reducing labor dependency. This integration of technology, from automated sanitation to remote monitoring of hygiene, allows facilities to meet stringent OSHA workplace safety standards more effectively.
The move toward automation is further supported by the development of cobots in cleaning, which work alongside human staff to enhance productivity in complex industrial environments.
We can help! Our analysts can customize this industrial cleaners market research report to meet your requirements.
 RIA -
RIA - 
