Industrial Gases Market Analysis, Size, and Forecast 2025-2029: North America (US and Canada), Europe (France, Germany, Italy, and UK), Middle East and Africa (Egypt, KSA, Oman, and UAE), APAC (China, India, and Japan), South America (Argentina and Brazil), and Rest of World (ROW)

Industrial Gases Market Analysis, Size, and Forecast 2025-2029:
North America (US and Canada), Europe (France, Germany, Italy, and UK), Middle East and Africa (Egypt, KSA, Oman, and UAE), APAC (China, India, and Japan), South America (Argentina and Brazil), and Rest of World (ROW)

Published: Jan 2025 220 Pages SKU: IRTNTR70494

Market Overview at a Glance

$31.1 B
Market Opportunity
5.7%
CAGR
5.5
YoY growth 2024-2025(%)

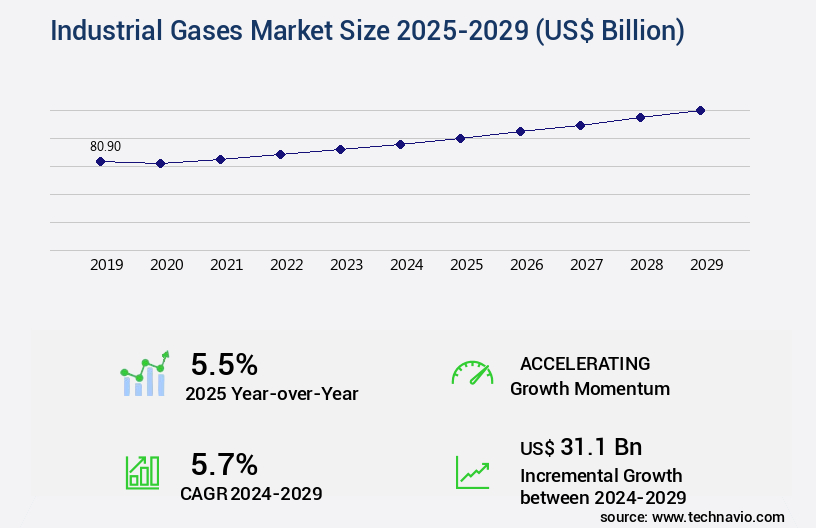
Industrial Gases Market Size 2025-2029

The industrial gases market size is valued to increase USD 31.1 billion, at a CAGR of 5.7% from 2024 to 2029. Facility expansion strategies by industrial gases vendors will drive the industrial gases market.

Major Market Trends & Insights

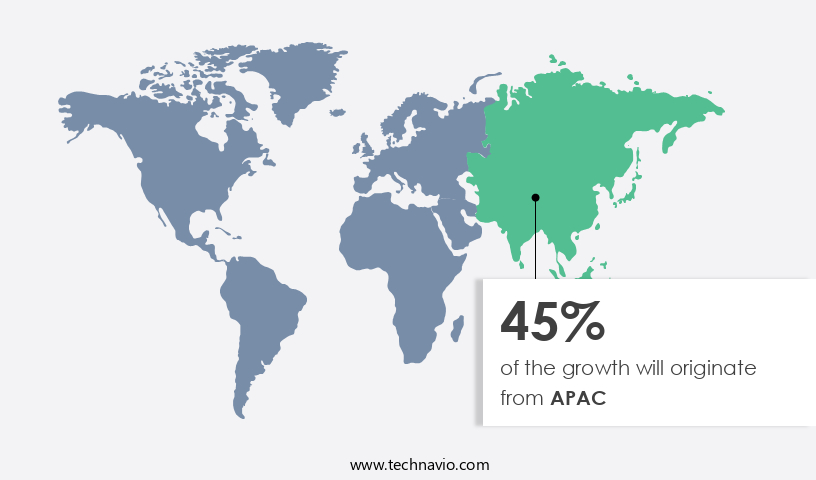
  • APAC dominated the market and accounted for a 45% growth during the forecast period.
  • By End-user - Manufacturing segment was valued at USD 23.00 billion in 2023
  • By Type - Hydrogen segment accounted for the largest market revenue share in 2023

Market Size & Forecast

  • Market Opportunities: USD 58.22 billion
  • Market Future Opportunities: USD 31.10 billion
  • CAGR from 2024 to 2029 : 5.7%

Market Summary

  • The market encompasses the production, distribution, and application of various gases used in various industries. This dynamic market is driven by core technologies and applications, including welding, refrigeration, and chemical processing. Notable trends include the increasing adoption of advanced technologies, such as hydrogen fuel cells and carbon capture, utilization, and storage (CCUS). Service types and product categories, such as bulk gases, cylinders, and tonnage gases, continue to evolve, with an emphasis on sustainability and efficiency. Regulations play a crucial role in shaping the market, with stricter emission norms and safety standards driving innovation. Facility expansion strategies by industrial gases companies and the increasing number of mergers and acquisitions among market players are key developments.
  • Criticalities in gas distribution and gas handling systems, such as ensuring safety, reliability, and efficiency, remain a significant challenge. According to a recent study, the market is expected to account for over 20% of the global hydrogen market by 2027.

What will be the Size of the Industrial Gases Market during the forecast period?

Industrial Gases Market Size

Get Key Insights on Market Forecast (PDF) Request Free Sample

How is the Industrial Gases Market Segmented ?

The industrial gases industry research report provides comprehensive data (region-wise segment analysis), with forecasts and estimates in "USD billion" for the period 2025-2029, as well as historical data from 2019-2023 for the following segments.

  • End-user
    • Manufacturing
    • Chemical processing
    • Metal fabrication
    • Energy
    • Others
  • Type
    • Hydrogen
    • Oxygen
    • Nitrogen
    • Carbon dioxide
    • Others
  • Application
    • Manufacturing
    • Healthcare
    • Food and Beverage
    • Metallurgy
  • Geography
    • North America
      • US
      • Canada
    • Europe
      • France
      • Germany
      • Italy
      • UK
    • Middle East and Africa
      • Egypt
      • KSA
      • Oman
      • UAE
    • APAC
      • China
      • India
      • Japan
    • South America
      • Argentina
      • Brazil
    • Rest of World (ROW)

    By End-user Insights

    The manufacturing segment is estimated to witness significant growth during the forecast period.

    Industrial gases play a pivotal role in various manufacturing sectors, including aerospace, automotive, glass, ceramics, pulp and paper, shipbuilding, and railways coach and wagon manufacturing. These gases, such as oxygen, nitrogen, hydrogen, and carbon dioxide, are indispensable for numerous processes like welding, cutting, brazing, heat treating, purging, and annealing. In the automotive industry, they are utilized extensively in automobile parts and body manufacturing, as well as in repairs. In the aerospace sector, industrial gases are essential for fueling rockets and maintaining cabin pressure. In the glass industry, they are used for float glass production and tempering. In the ceramics sector, they aid in the sintering process.

    In the pulp and paper industry, they are employed for pulp bleaching and paper coating. In shipbuilding, they are utilized for welding and cutting steel. In railways coach and wagon manufacturing, they are essential for welding and brazing. The market for industrial gases is currently thriving, with oxygen generation systems witnessing a significant increase in demand due to their extensive usage in various industries. For instance, argon purification is a crucial process in the steel industry, where it is used to protect the molten steel from oxidation during the production process. Membrane separation, a gas separation technique, is gaining popularity due to its energy efficiency and cost-effectiveness.

    Furthermore, the market for industrial gases is expected to grow substantially in the coming years. For instance, the demand for nitrogen generation systems is projected to rise due to their increasing use in the food and beverage industry for food preservation. The market for hydrogen production is also expected to expand due to its growing usage in fuel cells and as a reducing agent in various industries. Process control systems, heat exchanger design, refrigeration cycles, and pressure swing adsorption are some of the key technologies driving the growth of the market. Temperature monitoring, safety systems, and pipeline transportation are essential components of the market infrastructure.

    In terms of market size, the market was valued at approximately 150 billion USD in 2020, and it is projected to reach over 200 billion USD by 2026. The market's growth is attributed to the increasing demand for industrial gases in various sectors, advancements in technology, and regulatory compliance. The market for industrial gases is continuously evolving, with ongoing research and development in areas like gas liquefaction, carbon dioxide capture, and adsorbent materials. Additionally, there is a growing focus on emission reduction, which is leading to the adoption of cleaner production methods and the development of more efficient and sustainable industrial gas production technologies.

    Gas handling equipment, compressor technology, and purification membranes are some of the key components of the industrial gas production process. Cryogenic distillation is a widely used process for separating and purifying gases based on their different boiling points. Pressure sensors and safety systems are essential components of the industrial gas infrastructure, ensuring safe and efficient production and transportation of gases. In conclusion, the market is a dynamic and evolving industry, with a wide range of applications across various sectors. The market is expected to grow substantially in the coming years, driven by technological advancements, regulatory compliance, and increasing demand for industrial gases in various industries.

    Industrial Gases Market Size

    Request Free Sample

    The Manufacturing segment was valued at USD 23.00 billion in 2019 and showed a gradual increase during the forecast period.

    Industrial Gases Market Size

    Request Free Sample

    Regional Analysis

    APAC is estimated to contribute 45% to the growth of the global market during the forecast period.Technavio’s analysts have elaborately explained the regional trends and drivers that shape the market during the forecast period.

    Industrial Gases Market Share by Geography

    See How Industrial Gases Market Demand is Rising in APAC Request Free Sample

    In the dynamic industrial landscape of 2024, APAC emerged as the leading consumer of industrial gases, accounting for a significant market share. This dominance can be attributed to the region's robust industrialization and the surging demand from sectors like metals and metal fabrication, chemical and petrochemical, and food and beverage. The rapid expansion of infrastructure in APAC necessitates the production of large volumes of steel, thereby driving the demand for industrial gases.

    Furthermore, the region's industrial sector is witnessing a shift towards alternate sources of energy, leading to the proliferation of gasification plants, gas-to-liquids, coal-to-liquids, and coal-to-chemical plants. These facilities significantly contribute to the increasing consumption of industrial gases in APAC.

    Market Dynamics

    Our researchers analyzed the data with 2024 as the base year, along with the key drivers, trends, and challenges. A holistic analysis of drivers will help companies refine their marketing strategies to gain a competitive advantage.

    The market encompasses a diverse range of applications, from cryogenic distillation column design for producing oxygen and nitrogen to pressure swing adsorption cycle optimization for enhancing nitrogen generation efficiency. One significant trend driving market growth is the continuous pursuit of membrane separation efficiency improvement to meet stringent industrial gas purity specifications. Helium recovery from natural gas and oxygen generation system safety protocols are essential aspects of this market, with safety regulations increasingly stringent to ensure optimal performance and minimal risk. Carbon dioxide capture technology advancements and hydrogen production from electrolysis are other critical areas of focus, as emission reduction strategies gain traction in response to environmental concerns.

    Gas blending system calibration procedures and pipeline transportation safety regulations are essential for maintaining the integrity of industrial gas supply chains. Gas handling equipment maintenance and process control system integration are also crucial for ensuring operational efficiency and reliability. The energy efficiency in gas liquefaction and refrigeration cycle improvements are essential for reducing operational costs and enhancing overall market competitiveness. In terms of technology advancements, compressor technology and heat exchanger design optimization are key areas of investment. Moreover, purification membrane selection criteria and adsorbent material regeneration are essential considerations for optimizing industrial gas production processes. A notable comparison within the market involves the adoption rates of different separation technologies, with membrane-based methods gaining significant ground against traditional distillation processes due to their energy efficiency and flexibility.

    In conclusion, the market is a dynamic and evolving landscape, driven by technological advancements, regulatory requirements, and the pursuit of operational efficiency and cost savings. Companies investing in R&D for cryogenic distillation column design, pressure swing adsorption cycle optimization, membrane separation efficiency improvement, and other related areas are well-positioned to capitalize on the market's growth opportunities.

    Industrial Gases Market Size

    What are the key market drivers leading to the rise in the adoption of Industrial Gases Industry?

    • Industrial gases companies' strategies for facility expansion are the primary catalysts fueling market growth. 

    • The global industrial gas market is witnessing significant expansion as companies invest in new production facilities to cater to various sectors, including healthcare, electronics, and manufacturing. Air Liquide SA, for instance, recently established a new platform for producing low-carbon gases in Quebec's new energy transition valley. This move is part of the company's strategy to increase its manufacturing footprint and support industries such as healthcare, chemicals, and metals. Other companies are adopting similar approaches to enhance efficiency and sustainability in their operations.
    • The growing demand for industrial gases in these sectors is driving the market's continuous evolution. For example, the healthcare industry relies on medical gases like oxygen and nitrous oxide, while electronics manufacturing requires gases like nitrogen and hydrogen. The manufacturing sector, too, utilizes industrial gases extensively for processes like steelmaking and refining. These trends underscore the dynamic nature of the industrial gas market and its diverse applications.

    What are the market trends shaping the Industrial Gases Industry?

    • The increasing trend in the market is characterized by an escalating number of mergers and acquisitions among market players. (Or) Mergers and acquisitions are on the rise, becoming an increasingly prevalent trend in the market.

    • The market is characterized by a fragmented landscape, with a multitude of small and medium-sized businesses operating regionally. To expand their market presence and achieve operational efficiencies, larger industrial gases companies are engaging in mergers and acquisitions (M&A). These strategic moves enable the consolidation of market share, economies of scale, and the acquisition of complementary businesses and technologies. For instance, in May 2023, Air Products announced an investment agreement with the Government of the Republic of Uzbekistan and Uzbekneftegaz JSC to acquire and manage a natural gas-to-syngas processing facility in Qashqadaryo Province, Uzbekistan, for a significant investment.
    • This acquisition underscores the ongoing trend of industrial gases companies expanding their product portfolios and diversifying their offerings to cater to the evolving needs of industries worldwide. Moreover, M&A activities facilitate the enhancement of capabilities and market reach, as demonstrated by the growing number of strategic alliances and collaborations in the sector. These partnerships enable companies to broaden their geographical presence and strengthen their competitive positions. The dynamic nature of the market necessitates continuous adaptation and innovation, making M&A an essential tool for businesses seeking growth and expansion.

    What challenges does the Industrial Gases Industry face during its growth?

    • The growth of the industry is significantly impacted by the complexities and criticalities in the design, implementation, and management of gas distribution and handling systems. Ensuring the reliable and efficient operation of these systems is a key priority for industry professionals. 

    • Industrial gases are essential components in various sectors, including manufacturing, processing, and packaging. Ensuring the safe and efficient distribution of these gases is crucial for maintaining process quality. In the food and beverage and healthcare industries, stringent standards apply due to the sensitive nature of the applications. Industrial gases are transported in trolleys or cylinders, necessitating frequent refilling and dispatch. Alternative distribution methods include pipelines and bulk transport via ships and trucks. The distribution systems for industrial gases must maintain precise control over impurities, which can significantly impact processes. For instance, in the food and beverage industry, even minor impurities can lead to product recalls or quality issues.
    • In the healthcare sector, impurities can compromise the efficacy of therapeutic gases. The choice of distribution method depends on several factors, including the volume of gas required, the distance to the point of use, and the specific gas application. Trolleys and cylinders offer flexibility for small-scale or remote applications, while pipelines and bulk transport are more suitable for large-scale industrial processes. Regardless of the chosen method, the focus remains on ensuring the safety, reliability, and efficiency of the industrial gas distribution network.

    Exclusive Technavio Analysis on Customer Landscape

    The industrial gases market forecasting report includes the adoption lifecycle of the market, covering from the innovator’s stage to the laggard’s stage. It focuses on adoption rates in different regions based on penetration. Furthermore, the industrial gases market report also includes key purchase criteria and drivers of price sensitivity to help companies evaluate and develop their market growth analysis strategies.

    Industrial Gases Market Share by Geography

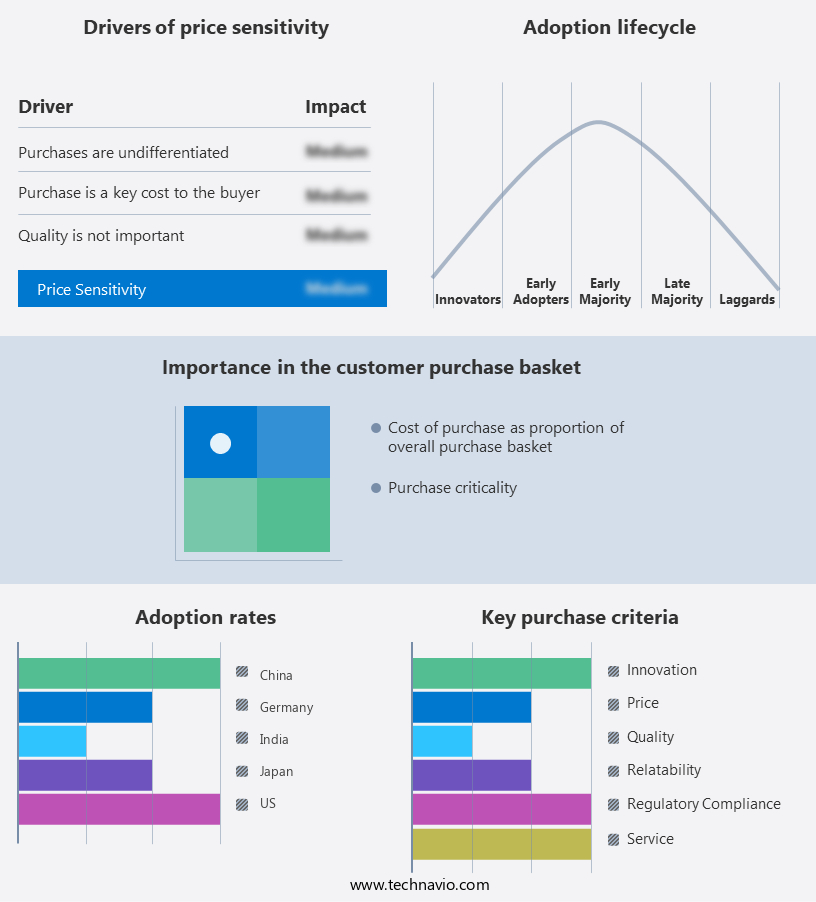
     Customer Landscape of Industrial Gases Industry

    Competitive Landscape

    Companies are implementing various strategies, such as strategic alliances, industrial gases market forecast, partnerships, mergers and acquisitions, geographical expansion, and product/service launches, to enhance their presence in the industry.

    Air Liquide - This industrial gas provider caters to the refining, petrochemical, and metal industries with a comprehensive range of offerings. Gases include oxygen, nitrogen, hydrogen, argon, carbon dioxide, helium, acetylene, and specialty gases. These essential elements fuel various industrial processes, driving efficiency and productivity.

    The industry research and growth report includes detailed analyses of the competitive landscape of the market and information about key companies, including:

    • Air Liquide
    • Air Products and Chemicals
    • Asia Technical Gas Co.
    • BASF SE
    • Buzwair Holding
    • Coregas
    • Gulf Cryo
    • INOX Air Products
    • Iwatani Corporation
    • Lincoln Electric
    • Linde plc
    • Messer Group
    • Nippon Sanso Holdings
    • NovaGas Technologies
    • Praxair
    • SABIC
    • SOL Group
    • Taiyo Nippon Sanso
    • Welsco Inc.
    • Yingde Gases

    Qualitative and quantitative analysis of companies has been conducted to help clients understand the wider business environment as well as the strengths and weaknesses of key industry players. Data is qualitatively analyzed to categorize companies as pure play, category-focused, industry-focused, and diversified; it is quantitatively analyzed to categorize companies as dominant, leading, strong, tentative, and weak.

    Recent Development and News in Industrial Gases Market

    • In January 2024, Linde plc, a leading industrial gases provider, announced the launch of its new hydrogen fueling station in Germany, marking a significant expansion of its alternative fuel infrastructure (Linde press release). This station, part of Linde's H2 Mobility joint venture, is expected to increase the availability of hydrogen fuel for commercial vehicles in Europe.
    • In March 2024, Air Products and Chemicals, Inc. Entered into a strategic collaboration with Siemens Energy to develop and commercialize carbon capture, utilization, and storage (CCUS) technologies (Air Products press release). This partnership aims to reduce greenhouse gas emissions in the industrial sector by utilizing industrial gases for carbon capture and utilization.
    • In May 2024, Praxair, a leading industrial gases company, completed the acquisition of INEOS's US nitrogen business, expanding its presence in the North American market (Praxair press release). The acquisition added approximately 1.3 billion cubic feet per day of nitrogen production capacity to Praxair's portfolio.
    • In April 2025, Air Liquide, a global leader in gases, technologies, and services, secured regulatory approval for its proposed USD13.6 billion acquisition of Airgas, Inc. (Air Liquide press release). This acquisition will significantly expand Air Liquide's presence in the US market and strengthen its position as a leading industrial gases provider worldwide.

    Dive into Technavio’s robust research methodology, blending expert interviews, extensive data synthesis, and validated models for unparalleled Industrial Gases Market insights. See full methodology.

    Market Scope

    Report Coverage

    Details

    Page number

    220

    Base year

    2024

    Historic period

    2019-2023

    Forecast period

    2025-2029

    Growth momentum & CAGR

    Accelerate at a CAGR of 5.7%

    Market growth 2025-2029

    USD 31.1 billion

    Market structure

    Fragmented

    YoY growth 2024-2025(%)

    5.5

    Key countries

    US, Canada, Germany, UK, Italy, France, China, India, Japan, Brazil, Egypt, UAE, Oman, Argentina, KSA, UAE, Brazil, and Rest of World (ROW)

    Competitive landscape

    Leading Companies, Market Positioning of Companies, Competitive Strategies, and Industry Risks

    Request Free Sample

    Research Analyst Overview

    • In the dynamic and evolving the market, various processes and techniques play a pivotal role in ensuring the production and purification of gases for diverse applications. Gas purification processes, such as membrane separation and cryogenic distillation, are continually advancing to enhance energy efficiency and improve gas separation techniques. Refrigeration cycles, a crucial aspect of gas liquefaction, are increasingly being optimized to minimize energy consumption. Process control systems, including pressure sensors and temperature monitoring, are integral to maintaining industrial gas purity and ensuring consistent quality. Argon purification, a significant application of gas separation technologies, is essential for various industries, including welding and metal fabrication.
    • Heat exchanger design and compressor technology also contribute to the efficiency of gas handling equipment and oxygen generation systems. Gas analysis methods, employing advanced sensors and spectroscopic techniques, enable real-time monitoring of gas compositions and facilitate process optimization. Regulatory compliance and safety systems are integral components of industrial gas production and handling, ensuring emission reduction and adherence to environmental standards. Bulk storage tanks, designed with pressure swing adsorption technology, facilitate the safe and efficient storage of gases. Helium recovery and nitrogen generation systems are essential for numerous applications, including medical, industrial, and scientific sectors.
    • Carbon dioxide capture and hydrogen production are emerging trends in the market, driven by the growing demand for sustainable energy solutions and emission reduction strategies. Gas blending systems and flow rate measurement techniques enable precise control over gas mixtures, enhancing overall process efficiency. Purification membranes, an essential component of many gas separation processes, are continually evolving to improve gas separation and energy efficiency. The ongoing development of compressor technology and pipeline transportation systems further expands the capabilities of the market, enabling the delivery of clean, high-purity gases to a wide range of industries.

    What are the Key Data Covered in this Industrial Gases Market Research and Growth Report?

    • What is the expected growth of the Industrial Gases Market between 2025 and 2029?

      • USD 31.1 billion, at a CAGR of 5.7%

    • What segmentation does the market report cover?

      • The report is segmented by End-user (Manufacturing, Chemical processing, Metal fabrication, Energy, and Others), Type (Hydrogen, Oxygen, Nitrogen, Carbon dioxide, and Others), Geography (APAC, Europe, North America, South America, and Middle East and Africa), and Application (Manufacturing, Healthcare, Food and Beverage, and Metallurgy)

    • Which regions are analyzed in the report?

      • APAC, Europe, North America, South America, and Middle East and Africa

    • What are the key growth drivers and market challenges?

      • Facility expansion strategies by industrial gases vendors, Criticalities in gas distribution and gas handling systems

    • Who are the major players in the Industrial Gases Market?

      • Air Liquide, Air Products and Chemicals, Asia Technical Gas Co., BASF SE, Buzwair Holding, Coregas, Gulf Cryo, INOX Air Products, Iwatani Corporation, Lincoln Electric, Linde plc, Messer Group, Nippon Sanso Holdings, NovaGas Technologies, Praxair, SABIC, SOL Group, Taiyo Nippon Sanso, Welsco Inc., and Yingde Gases

    Market Research Insights

    • The market encompasses a diverse range of applications, including heat treatment, welding processes, medical diagnostics, energy production, electronics manufacturing, automotive manufacturing, gas distribution networks, leak detection, aerospace applications, wastewater treatment, petroleum refining, laser cutting, remote monitoring, gas metering systems, pipeline integrity management, fault detection, data acquisition systems, cryogenic freezing, industrial gas applications, predictive maintenance, process automation, food packaging atmosphere, metal fabrication processes, chemical synthesis, pharmaceutical manufacturing, medical gas supply, semiconductor manufacturing, and power generation. According to industry estimates, the market for industrial gases reached a value of USD200 billion in 2020, with an annual growth rate of 3.5%.
    • In comparison, the market for medical gases, a subset of the market, was valued at USD50 billion in the same year, expanding at a CAGR of 5.2%. These figures underscore the significant role industrial gases play in various industries and the continuous demand for innovative solutions in this evolving market.

    We can help! Our analysts can customize this industrial gases market research report to meet your requirements.

    Get in touch

    1 Executive Summary

    • 1.1 Market overview
      • Executive Summary - Chart on Market Overview
      • Executive Summary - Data Table on Market Overview
      • Executive Summary - Chart on Global Market Characteristics
      • Executive Summary - Chart on Market by Geography
      • Executive Summary - Chart on Market Segmentation by End-user
      • Executive Summary - Chart on Market Segmentation by Type
      • Executive Summary - Chart on Incremental Growth
      • Executive Summary - Data Table on Incremental Growth
      • Executive Summary - Chart on Company Market Positioning

    2 Technavio Analysis

    • 2.1 Analysis of price sensitivity, lifecycle, customer purchase basket, adoption rates, and purchase criteria
      • Analysis of price sensitivity, lifecycle, customer purchase basket, adoption rates, and purchase criteria
    • 2.2 Criticality of inputs and Factors of differentiation
      • Overview on criticality of inputs and factors of differentiation
    • 2.3 Factors of disruption
      • Overview on factors of disruption
    • 2.4 Impact of drivers and challenges
      • Impact of drivers and challenges in 2024 and 2029

    3 Market Landscape

    • 3.1 Market ecosystem
      • Parent Market
      • Data Table on - Parent Market
    • 3.2 Market characteristics
      • Market characteristics analysis
    • 3.3 Value chain analysis
      • Value chain analysis

    4 Market Sizing

    • 4.1 Market definition
      • Offerings of companies included in the market definition
    • 4.2 Market segment analysis
      • Market segments
    • 4.3 Market size 2024
      • 4.4 Market outlook: Forecast for 2024-2029
        • Chart on Global - Market size and forecast 2024-2029 ($ billion)
        • Data Table on Global - Market size and forecast 2024-2029 ($ billion)
        • Chart on Global Market: Year-over-year growth 2024-2029 (%)
        • Data Table on Global Market: Year-over-year growth 2024-2029 (%)

      5 Historic Market Size

      • 5.1 Global Industrial Gases Market 2019 - 2023
        • Historic Market Size - Data Table on Global Industrial Gases Market 2019 - 2023 ($ billion)
      • 5.2 End-user segment analysis 2019 - 2023
        • Historic Market Size - End-user Segment 2019 - 2023 ($ billion)
      • 5.3 Type segment analysis 2019 - 2023
        • Historic Market Size - Type Segment 2019 - 2023 ($ billion)
      • 5.4 Geography segment analysis 2019 - 2023
        • Historic Market Size - Geography Segment 2019 - 2023 ($ billion)
      • 5.5 Country segment analysis 2019 - 2023
        • Historic Market Size - Country Segment 2019 - 2023 ($ billion)

      6 Qualitative Analysis

      • 6.1 Impact of AI on the Global Industrial Gases Market

        7 Five Forces Analysis

        • 7.1 Five forces summary
          • Five forces analysis - Comparison between 2024 and 2029
        • 7.2 Bargaining power of buyers
          • Bargaining power of buyers - Impact of key factors 2024 and 2029
        • 7.3 Bargaining power of suppliers
          • Bargaining power of suppliers - Impact of key factors in 2024 and 2029
        • 7.4 Threat of new entrants
          • Threat of new entrants - Impact of key factors in 2024 and 2029
        • 7.5 Threat of substitutes
          • Threat of substitutes - Impact of key factors in 2024 and 2029
        • 7.6 Threat of rivalry
          • Threat of rivalry - Impact of key factors in 2024 and 2029
        • 7.7 Market condition
          • Chart on Market condition - Five forces 2024 and 2029

        8 Market Segmentation by End-user

        • 8.1 Market segments
          • Chart on End-user - Market share (2024-2029) (%)
          • Data Table on End-user - Market share (2024-2029) (%)
        • 8.2 Comparison by End-user
          • Chart on Comparison by End-user
          • Data Table on Comparison by End-user
        • 8.3 Manufacturing - Market size and forecast (2024-2029)
          • Chart on Manufacturing - Market size and forecast (2024-2029) ($ billion)
          • Data Table on Manufacturing - Market size and forecast (2024-2029) ($ billion)
          • Chart on Manufacturing - Year-over-year growth (2024-2029) (%)
          • Data Table on Manufacturing - Year-over-year growth (2024-2029) (%)
        • 8.4 Chemical processing - Market size and forecast (2024-2029)
          • Chart on Chemical processing - Market size and forecast (2024-2029) ($ billion)
          • Data Table on Chemical processing - Market size and forecast (2024-2029) ($ billion)
          • Chart on Chemical processing - Year-over-year growth (2024-2029) (%)
          • Data Table on Chemical processing - Year-over-year growth (2024-2029) (%)
        • 8.5 Metal fabrication - Market size and forecast (2024-2029)
          • Chart on Metal fabrication - Market size and forecast (2024-2029) ($ billion)
          • Data Table on Metal fabrication - Market size and forecast (2024-2029) ($ billion)
          • Chart on Metal fabrication - Year-over-year growth (2024-2029) (%)
          • Data Table on Metal fabrication - Year-over-year growth (2024-2029) (%)
        • 8.6 Energy - Market size and forecast (2024-2029)
          • Chart on Energy - Market size and forecast (2024-2029) ($ billion)
          • Data Table on Energy - Market size and forecast (2024-2029) ($ billion)
          • Chart on Energy - Year-over-year growth (2024-2029) (%)
          • Data Table on Energy - Year-over-year growth (2024-2029) (%)
        • 8.7 Others - Market size and forecast (2024-2029)
          • Chart on Others - Market size and forecast (2024-2029) ($ billion)
          • Data Table on Others - Market size and forecast (2024-2029) ($ billion)
          • Chart on Others - Year-over-year growth (2024-2029) (%)
          • Data Table on Others - Year-over-year growth (2024-2029) (%)
        • 8.8 Market opportunity by End-user
          • Market opportunity by End-user ($ billion)
          • Data Table on Market opportunity by End-user ($ billion)

        9 Market Segmentation by Type

        • 9.1 Market segments
          • Chart on Type - Market share (2024-2029) (%)
          • Data Table on Type - Market share (2024-2029) (%)
        • 9.2 Comparison by Type
          • Chart on Comparison by Type
          • Data Table on Comparison by Type
        • 9.3 Hydrogen - Market size and forecast (2024-2029)
          • Chart on Hydrogen - Market size and forecast (2024-2029) ($ billion)
          • Data Table on Hydrogen - Market size and forecast (2024-2029) ($ billion)
          • Chart on Hydrogen - Year-over-year growth (2024-2029) (%)
          • Data Table on Hydrogen - Year-over-year growth (2024-2029) (%)
        • 9.4 Oxygen - Market size and forecast (2024-2029)
          • Chart on Oxygen - Market size and forecast (2024-2029) ($ billion)
          • Data Table on Oxygen - Market size and forecast (2024-2029) ($ billion)
          • Chart on Oxygen - Year-over-year growth (2024-2029) (%)
          • Data Table on Oxygen - Year-over-year growth (2024-2029) (%)
        • 9.5 Nitrogen - Market size and forecast (2024-2029)
          • Chart on Nitrogen - Market size and forecast (2024-2029) ($ billion)
          • Data Table on Nitrogen - Market size and forecast (2024-2029) ($ billion)
          • Chart on Nitrogen - Year-over-year growth (2024-2029) (%)
          • Data Table on Nitrogen - Year-over-year growth (2024-2029) (%)
        • 9.6 Carbon dioxide - Market size and forecast (2024-2029)
          • Chart on Carbon dioxide - Market size and forecast (2024-2029) ($ billion)
          • Data Table on Carbon dioxide - Market size and forecast (2024-2029) ($ billion)
          • Chart on Carbon dioxide - Year-over-year growth (2024-2029) (%)
          • Data Table on Carbon dioxide - Year-over-year growth (2024-2029) (%)
        • 9.7 Others - Market size and forecast (2024-2029)
          • Chart on Others - Market size and forecast (2024-2029) ($ billion)
          • Data Table on Others - Market size and forecast (2024-2029) ($ billion)
          • Chart on Others - Year-over-year growth (2024-2029) (%)
          • Data Table on Others - Year-over-year growth (2024-2029) (%)
        • 9.8 Market opportunity by Type
          • Market opportunity by Type ($ billion)
          • Data Table on Market opportunity by Type ($ billion)

        10 Market Segmentation by Application

        • 10.1 Market segments
          • Chart on Application - Market share (2024-2029) (%)
          • Data Table on Application - Market share (2024-2029) (%)
        • 10.2 Comparison by Application
          • Chart on Comparison by Application
          • Data Table on Comparison by Application
        • 10.3 Manufacturing - Market size and forecast (2024-2029)
          • Chart on Manufacturing - Market size and forecast (2024-2029) ($ billion)
          • Data Table on Manufacturing - Market size and forecast (2024-2029) ($ billion)
          • Chart on Manufacturing - Year-over-year growth (2024-2029) (%)
          • Data Table on Manufacturing - Year-over-year growth (2024-2029) (%)
        • 10.4 Healthcare - Market size and forecast (2024-2029)
          • Chart on Healthcare - Market size and forecast (2024-2029) ($ billion)
          • Data Table on Healthcare - Market size and forecast (2024-2029) ($ billion)
          • Chart on Healthcare - Year-over-year growth (2024-2029) (%)
          • Data Table on Healthcare - Year-over-year growth (2024-2029) (%)
        • 10.5 Food and Beverage - Market size and forecast (2024-2029)
          • Chart on Food and Beverage - Market size and forecast (2024-2029) ($ billion)
          • Data Table on Food and Beverage - Market size and forecast (2024-2029) ($ billion)
          • Chart on Food and Beverage - Year-over-year growth (2024-2029) (%)
          • Data Table on Food and Beverage - Year-over-year growth (2024-2029) (%)
        • 10.6 Metallurgy - Market size and forecast (2024-2029)
          • Chart on Metallurgy - Market size and forecast (2024-2029) ($ billion)
          • Data Table on Metallurgy - Market size and forecast (2024-2029) ($ billion)
          • Chart on Metallurgy - Year-over-year growth (2024-2029) (%)
          • Data Table on Metallurgy - Year-over-year growth (2024-2029) (%)
        • 10.7 Market opportunity by Application
          • Market opportunity by Application ($ billion)
          • Data Table on Market opportunity by Application ($ billion)

        11 Customer Landscape

        • 11.1 Customer landscape overview
          • Analysis of price sensitivity, lifecycle, customer purchase basket, adoption rates, and purchase criteria

        12 Geographic Landscape

        • 12.1 Geographic segmentation
          • Chart on Market share by geography 2024-2029 (%)
          • Data Table on Market share by geography 2024-2029 (%)
        • 12.2 Geographic comparison
          • Chart on Geographic comparison
          • Data Table on Geographic comparison
        • 12.3 APAC - Market size and forecast 2024-2029
          • Chart on APAC - Market size and forecast 2024-2029 ($ billion)
          • Data Table on APAC - Market size and forecast 2024-2029 ($ billion)
          • Chart on APAC - Year-over-year growth 2024-2029 (%)
          • Data Table on APAC - Year-over-year growth 2024-2029 (%)
        • 12.4 Europe - Market size and forecast 2024-2029
          • Chart on Europe - Market size and forecast 2024-2029 ($ billion)
          • Data Table on Europe - Market size and forecast 2024-2029 ($ billion)
          • Chart on Europe - Year-over-year growth 2024-2029 (%)
          • Data Table on Europe - Year-over-year growth 2024-2029 (%)
        • 12.5 North America - Market size and forecast 2024-2029
          • Chart on North America - Market size and forecast 2024-2029 ($ billion)
          • Data Table on North America - Market size and forecast 2024-2029 ($ billion)
          • Chart on North America - Year-over-year growth 2024-2029 (%)
          • Data Table on North America - Year-over-year growth 2024-2029 (%)
        • 12.6 South America - Market size and forecast 2024-2029
          • Chart on South America - Market size and forecast 2024-2029 ($ billion)
          • Data Table on South America - Market size and forecast 2024-2029 ($ billion)
          • Chart on South America - Year-over-year growth 2024-2029 (%)
          • Data Table on South America - Year-over-year growth 2024-2029 (%)
        • 12.7 Middle East and Africa - Market size and forecast 2024-2029
          • Chart on Middle East and Africa - Market size and forecast 2024-2029 ($ billion)
          • Data Table on Middle East and Africa - Market size and forecast 2024-2029 ($ billion)
          • Chart on Middle East and Africa - Year-over-year growth 2024-2029 (%)
          • Data Table on Middle East and Africa - Year-over-year growth 2024-2029 (%)
        • 12.8 China - Market size and forecast 2024-2029
          • Chart on China - Market size and forecast 2024-2029 ($ billion)
          • Data Table on China - Market size and forecast 2024-2029 ($ billion)
          • Chart on China - Year-over-year growth 2024-2029 (%)
          • Data Table on China - Year-over-year growth 2024-2029 (%)
        • 12.9 US - Market size and forecast 2024-2029
          • Chart on US - Market size and forecast 2024-2029 ($ billion)
          • Data Table on US - Market size and forecast 2024-2029 ($ billion)
          • Chart on US - Year-over-year growth 2024-2029 (%)
          • Data Table on US - Year-over-year growth 2024-2029 (%)
        • 12.10 Canada - Market size and forecast 2024-2029
          • Chart on Canada - Market size and forecast 2024-2029 ($ billion)
          • Data Table on Canada - Market size and forecast 2024-2029 ($ billion)
          • Chart on Canada - Year-over-year growth 2024-2029 (%)
          • Data Table on Canada - Year-over-year growth 2024-2029 (%)
        • 12.11 Japan - Market size and forecast 2024-2029
          • Chart on Japan - Market size and forecast 2024-2029 ($ billion)
          • Data Table on Japan - Market size and forecast 2024-2029 ($ billion)
          • Chart on Japan - Year-over-year growth 2024-2029 (%)
          • Data Table on Japan - Year-over-year growth 2024-2029 (%)
        • 12.12 Germany - Market size and forecast 2024-2029
          • Chart on Germany - Market size and forecast 2024-2029 ($ billion)
          • Data Table on Germany - Market size and forecast 2024-2029 ($ billion)
          • Chart on Germany - Year-over-year growth 2024-2029 (%)
          • Data Table on Germany - Year-over-year growth 2024-2029 (%)
        • 12.13 India - Market size and forecast 2024-2029
          • Chart on India - Market size and forecast 2024-2029 ($ billion)
          • Data Table on India - Market size and forecast 2024-2029 ($ billion)
          • Chart on India - Year-over-year growth 2024-2029 (%)
          • Data Table on India - Year-over-year growth 2024-2029 (%)
        • 12.14 UK - Market size and forecast 2024-2029
          • Chart on UK - Market size and forecast 2024-2029 ($ billion)
          • Data Table on UK - Market size and forecast 2024-2029 ($ billion)
          • Chart on UK - Year-over-year growth 2024-2029 (%)
          • Data Table on UK - Year-over-year growth 2024-2029 (%)
        • 12.15 South Korea - Market size and forecast 2024-2029
          • Chart on South Korea - Market size and forecast 2024-2029 ($ billion)
          • Data Table on South Korea - Market size and forecast 2024-2029 ($ billion)
          • Chart on South Korea - Year-over-year growth 2024-2029 (%)
          • Data Table on South Korea - Year-over-year growth 2024-2029 (%)
        • 12.16 France - Market size and forecast 2024-2029
          • Chart on France - Market size and forecast 2024-2029 ($ billion)
          • Data Table on France - Market size and forecast 2024-2029 ($ billion)
          • Chart on France - Year-over-year growth 2024-2029 (%)
          • Data Table on France - Year-over-year growth 2024-2029 (%)
        • 12.17 Italy - Market size and forecast 2024-2029
          • Chart on Italy - Market size and forecast 2024-2029 ($ billion)
          • Data Table on Italy - Market size and forecast 2024-2029 ($ billion)
          • Chart on Italy - Year-over-year growth 2024-2029 (%)
          • Data Table on Italy - Year-over-year growth 2024-2029 (%)
        • 12.18 Market opportunity by geography
          • Market opportunity by geography ($ billion)
          • Data Tables on Market opportunity by geography ($ billion)
        • 12.19 Brazil - Market size and forecast (2024-2029)
          • Chart on Brazil - Market size and forecast (2024-2029) ($ billion)
          • Data Table on Brazil - Market size and forecast (2024-2029) ($ billion)
          • Chart on Brazil - Year-over-year growth (2024-2029) (%)
          • Data Table on Brazil - Year-over-year growth (2024-2029) (%)
        • 12.20 Egypt - Market size and forecast (2024-2029)
          • Chart on Egypt - Market size and forecast (2024-2029) ($ billion)
          • Data Table on Egypt - Market size and forecast (2024-2029) ($ billion)
          • Chart on Egypt - Year-over-year growth (2024-2029) (%)
          • Data Table on Egypt - Year-over-year growth (2024-2029) (%)
        • 12.21 UAE - Market size and forecast (2024-2029)
          • Chart on UAE - Market size and forecast (2024-2029) ($ billion)
          • Data Table on UAE - Market size and forecast (2024-2029) ($ billion)
          • Chart on UAE - Year-over-year growth (2024-2029) (%)
          • Data Table on UAE - Year-over-year growth (2024-2029) (%)
        • 12.22 Oman - Market size and forecast (2024-2029)
          • Chart on Oman - Market size and forecast (2024-2029) ($ billion)
          • Data Table on Oman - Market size and forecast (2024-2029) ($ billion)
          • Chart on Oman - Year-over-year growth (2024-2029) (%)
          • Data Table on Oman - Year-over-year growth (2024-2029) (%)
        • 12.23 Argentina - Market size and forecast (2024-2029)
          • Chart on Argentina - Market size and forecast (2024-2029) ($ billion)
          • Data Table on Argentina - Market size and forecast (2024-2029) ($ billion)
          • Chart on Argentina - Year-over-year growth (2024-2029) (%)
          • Data Table on Argentina - Year-over-year growth (2024-2029) (%)
        • 12.24 KSA - Market size and forecast (2024-2029)
          • Chart on KSA - Market size and forecast (2024-2029) ($ billion)
          • Data Table on KSA - Market size and forecast (2024-2029) ($ billion)
          • Chart on KSA - Year-over-year growth (2024-2029) (%)
          • Data Table on KSA - Year-over-year growth (2024-2029) (%)
        • 12.25 UAE - Market size and forecast (2024-2029)
          • Chart on UAE - Market size and forecast (2024-2029) ($ billion)
          • Data Table on UAE - Market size and forecast (2024-2029) ($ billion)
          • Chart on UAE - Year-over-year growth (2024-2029) (%)
          • Data Table on UAE - Year-over-year growth (2024-2029) (%)
        • 12.26 Brazil - Market size and forecast (2024-2029)
          • Chart on Brazil - Market size and forecast (2024-2029) ($ billion)
          • Data Table on Brazil - Market size and forecast (2024-2029) ($ billion)
          • Chart on Brazil - Year-over-year growth (2024-2029) (%)
          • Data Table on Brazil - Year-over-year growth (2024-2029) (%)
        • 12.27 Rest of World (ROW) - Market size and forecast (2024-2029)
          • Chart on Rest of World (ROW) - Market size and forecast (2024-2029) ($ billion)
          • Data Table on Rest of World (ROW) - Market size and forecast (2024-2029) ($ billion)
          • Chart on Rest of World (ROW) - Year-over-year growth (2024-2029) (%)
          • Data Table on Rest of World (ROW) - Year-over-year growth (2024-2029) (%)

        13 Drivers, Challenges, and Opportunity/Restraints

        • 13.1 Market drivers
          • 13.2 Market challenges
            • 13.3 Impact of drivers and challenges
              • Impact of drivers and challenges in 2024 and 2029
            • 13.4 Market opportunities/restraints

              14 Competitive Landscape

              • 14.1 Overview
                • 14.2 Competitive Landscape
                  • Overview on criticality of inputs and factors of differentiation
                • 14.3 Landscape disruption
                  • Overview on factors of disruption
                • 14.4 Industry risks
                  • Impact of key risks on business

                15 Competitive Analysis

                • 15.1 Companies profiled
                  • Companies covered
                • 15.2 Market positioning of companies
                  • Matrix on companies position and classification
                • 15.3 Air Liquide
                  • Air Liquide - Overview
                  • Air Liquide - Product / Service
                  • Air Liquide - Key offerings
                • 15.4 Air Products and Chemicals
                  • Air Products and Chemicals - Overview
                  • Air Products and Chemicals - Product / Service
                  • Air Products and Chemicals - Key offerings
                • 15.5 Asia Technical Gas Co.
                  • Asia Technical Gas Co. - Overview
                  • Asia Technical Gas Co. - Product / Service
                  • Asia Technical Gas Co. - Key offerings
                • 15.6 BASF SE
                  • BASF SE - Overview
                  • BASF SE - Product / Service
                  • BASF SE - Key offerings
                • 15.7 Buzwair Holding
                  • Buzwair Holding - Overview
                  • Buzwair Holding - Product / Service
                  • Buzwair Holding - Key offerings
                • 15.8 Coregas
                  • Coregas - Overview
                  • Coregas - Product / Service
                  • Coregas - Key offerings
                • 15.9 Gulf Cryo
                  • Gulf Cryo - Overview
                  • Gulf Cryo - Product / Service
                  • Gulf Cryo - Key offerings
                • 15.10 INOX Air Products
                  • INOX Air Products - Overview
                  • INOX Air Products - Product / Service
                  • INOX Air Products - Key offerings
                • 15.11 Iwatani Corporation
                  • Iwatani Corporation - Overview
                  • Iwatani Corporation - Product / Service
                  • Iwatani Corporation - Key offerings
                • 15.12 Lincoln Electric
                  • Lincoln Electric - Overview
                  • Lincoln Electric - Product / Service
                  • Lincoln Electric - Key offerings
                • 15.13 Linde plc
                  • Linde plc - Overview
                  • Linde plc - Product / Service
                  • Linde plc - Key offerings
                • 15.14 Messer Group
                  • Messer Group - Overview
                  • Messer Group - Product / Service
                  • Messer Group - Key offerings
                • 15.15 Nippon Sanso Holdings
                  • Nippon Sanso Holdings - Overview
                  • Nippon Sanso Holdings - Product / Service
                  • Nippon Sanso Holdings - Key offerings
                • 15.16 NovaGas Technologies
                  • NovaGas Technologies - Overview
                  • NovaGas Technologies - Product / Service
                  • NovaGas Technologies - Key offerings
                • 15.17 Praxair
                  • Praxair - Overview
                  • Praxair - Product / Service
                  • Praxair - Key offerings
                • 15.18 SABIC
                  • SABIC - Overview
                  • SABIC - Product / Service
                  • SABIC - Key offerings
                • 15.19 SOL Group
                  • SOL Group - Overview
                  • SOL Group - Product / Service
                  • SOL Group - Key offerings
                • 15.20 Taiyo Nippon Sanso
                  • Taiyo Nippon Sanso - Overview
                  • Taiyo Nippon Sanso - Product / Service
                  • Taiyo Nippon Sanso - Key offerings
                • 15.21 Welsco Inc.
                  • Welsco Inc. - Overview
                  • Welsco Inc. - Product / Service
                  • Welsco Inc. - Key offerings
                • 15.22 Yingde Gases
                  • Yingde Gases - Overview
                  • Yingde Gases - Product / Service
                  • Yingde Gases - Key offerings
                • 15.23 Air Liquide SA
                  • Air Liquide SA - Overview
                  • Air Liquide SA - Product / Service
                  • Air Liquide SA - Key offerings
                • 15.24 Air Products and Chemicals Inc.
                  • Air Products and Chemicals Inc. - Overview
                  • Air Products and Chemicals Inc. - Product / Service
                  • Air Products and Chemicals Inc. - Key offerings
                • 15.25 AIR WATER INC.
                  • AIR WATER INC. - Overview
                  • AIR WATER INC. - Product / Service
                  • AIR WATER INC. - Key offerings
                • 15.26 Airgas Inc.
                  • Airgas Inc. - Overview
                  • Airgas Inc. - Product / Service
                  • Airgas Inc. - Key offerings
                • 15.27 Asia Technical Gas Co Pte Ltd.
                  • Asia Technical Gas Co Pte Ltd. - Overview
                  • Asia Technical Gas Co Pte Ltd. - Product / Service
                  • Asia Technical Gas Co Pte Ltd. - Key offerings
                • 15.28 BASF SE
                  • BASF SE - Overview
                  • BASF SE - Product / Service
                  • BASF SE - Key offerings
                • 15.29 Buzwair Industrial Gases Factories
                  • Buzwair Industrial Gases Factories - Overview
                  • Buzwair Industrial Gases Factories - Product / Service
                  • Buzwair Industrial Gases Factories - Key offerings
                • 15.30 Chemix Specialty Gases and Equipment
                  • Chemix Specialty Gases and Equipment - Overview
                  • Chemix Specialty Gases and Equipment - Product / Service
                  • Chemix Specialty Gases and Equipment - Key offerings
                • 15.31 Coregas Pty Ltd.
                  • Coregas Pty Ltd. - Overview
                  • Coregas Pty Ltd. - Product / Service
                  • Coregas Pty Ltd. - Key offerings
                • 15.32 Goyal Group
                  • Goyal Group - Overview
                  • Goyal Group - Product / Service
                  • Goyal Group - Key offerings
                • 15.33 Guangdong Huate Gas Co. Ltd.
                  • Guangdong Huate Gas Co. Ltd. - Overview
                  • Guangdong Huate Gas Co. Ltd. - Product / Service
                  • Guangdong Huate Gas Co. Ltd. - Key offerings
                • 15.34 Gulfcryo
                  • Gulfcryo - Overview
                  • Gulfcryo - Product / Service
                  • Gulfcryo - Key offerings
                • 15.35 Iwatani Corp.
                  • Iwatani Corp. - Overview
                  • Iwatani Corp. - Product / Service
                  • Iwatani Corp. - Key offerings
                • 15.36 Linde Plc
                  • Linde Plc - Overview
                  • Linde Plc - Product / Service
                  • Linde Plc - Key offerings
                • 15.37 Messer SE and Co. KGaA
                  • Messer SE and Co. KGaA - Overview
                  • Messer SE and Co. KGaA - Product / Service
                  • Messer SE and Co. KGaA - Key offerings
                • 15.38 Norco Inc.
                  • Norco Inc. - Overview
                  • Norco Inc. - Product / Service
                  • Norco Inc. - Key offerings
                • 15.39 SOL Spa
                  • SOL Spa - Overview
                  • SOL Spa - Product / Service
                  • SOL Spa - Key offerings
                • 15.40 Taiyo Nippon Sanso Corp.
                  • Taiyo Nippon Sanso Corp. - Overview
                  • Taiyo Nippon Sanso Corp. - Product / Service
                  • Taiyo Nippon Sanso Corp. - Key offerings
                • 15.41 Yingde Gas Group Co. Ltd.
                  • Yingde Gas Group Co. Ltd. - Overview
                  • Yingde Gas Group Co. Ltd. - Product / Service
                  • Yingde Gas Group Co. Ltd. - Key offerings

                16 Appendix

                • 16.1 Scope of the report
                  • 16.2 Inclusions and exclusions checklist
                    • Inclusions checklist
                    • Exclusions checklist
                  • 16.3 Currency conversion rates for US$
                    • Currency conversion rates for US$
                  • 16.4 Research methodology
                    • Research methodology
                  • 16.5 Data procurement
                    • Information sources
                  • 16.6 Data validation
                    • Data validation
                  • 16.7 Validation techniques employed for market sizing
                    • Validation techniques employed for market sizing
                  • 16.8 Data synthesis
                    • Data synthesis
                  • 16.9 360 degree market analysis
                    • 360 degree market analysis
                  • 16.10 List of abbreviations
                    • List of abbreviations

                  Research Methodology

                  Technavio presents a detailed picture of the market by way of study, synthesis, and summation of data from multiple sources. The analysts have presented the various facets of the market with a particular focus on identifying the key industry influencers. The data thus presented is comprehensive, reliable, and the result of extensive research, both primary and secondary.

                  INFORMATION SOURCES

                  Primary sources

                  • Manufacturers and suppliers
                  • Channel partners
                  • Industry experts
                  • Strategic decision makers

                  Secondary sources

                  • Industry journals and periodicals
                  • Government data
                  • Financial reports of key industry players
                  • Historical data
                  • Press releases

                  DATA ANALYSIS

                  Data Synthesis

                  • Collation of data
                  • Estimation of key figures
                  • Analysis of derived insights

                  Data Validation

                  • Triangulation with data models
                  • Reference against proprietary databases
                  • Corroboration with industry experts

                  REPORT WRITING

                  Qualitative

                  • Market drivers
                  • Market challenges
                  • Market trends
                  • Five forces analysis

                  Quantitative

                  • Market size and forecast
                  • Market segmentation
                  • Geographical insights
                  • Competitive landscape

                  Interested in this report?

                  Get your sample now to see our research methodology and insights!

                  Download Now

                  Frequently Asked Questions

                  Industrial Gases market growth will increase by $ 31.1 bn during 2025-2029 .

                  The Industrial Gases market is expected to grow at a CAGR of 5.7% during 2025-2029 .

                  Industrial Gases market is segmented by End-user( Manufacturing, Chemical processing, Metal fabrication, Energy, Others) Type( Hydrogen, Oxygen, Nitrogen, Carbon dioxide, Others)

                  Air Liquide, Air Products and Chemicals, Asia Technical Gas Co., BASF SE, Buzwair Holding, Coregas, Gulf Cryo, INOX Air Products, Iwatani Corporation, Lincoln Electric, Linde plc, Messer Group, Nippon Sanso Holdings, NovaGas Technologies, Praxair, SABIC, SOL Group, Taiyo Nippon Sanso, Welsco Inc., Yingde Gases are a few of the key vendors in the Industrial Gases market.

                  APAC will register the highest growth rate of 45% among the other regions. Therefore, the Industrial Gases market in APAC is expected to garner significant business opportunities for the vendors during the forecast period.

                  US, Canada, Germany, UK, Italy, France, China, India, Japan, Brazil, Egypt, UAE, Oman, Argentina, KSA, UAE, Brazil, Rest of World (ROW)

                  • Facility expansion strategies by industrial gases vendorsGlobal industrial gas market vendors has been actively expanding its production facilities. The company focuses on investing in new air separation units (ASUs) is the driving factor this market.
                  • hydrogen production plants is the driving factor this market.
                  • and specialty gas facilities to meet the needs of industries such as healthcare is the driving factor this market.
                  • electronics is the driving factor this market.
                  • and manufacturing. Vendors are expanding their manufacturing footprint and investing in new facilities to support industries such as healthcare is the driving factor this market.
                  • chemicals is the driving factor this market.
                  • and metals. The company focuses on enhancing efficiency and sustainability in its operations. Some of the recent instances are given below:In October 2024 is the driving factor this market.
                  • Air Liquide SA created a new platform for producing low-carbon gas in the new energy transition valley of Quebec. In keeping with the industrial and port zones efforts to decarbonize is the driving factor this market.
                  • this Air Liquide SA low-carbon production platform gives Becancour a special location for the Group to generate renewable industrial gases and create solutions for clients involved in the energy transition.In April 2023 is the driving factor this market.
                  • Linde AG and ExxonMobil signed a long-term contract for the off-take of carbon dioxide related to Lindes new clean hydrogen production facility in Beaumont is the driving factor this market.
                  • Texas. The new Linde facility is scheduled to open in 2025 and will be a part of the companys vast industrial gas infrastructure and will be integrated into Lindes extensive U.S. Gulf Coast industrial gas infrastructure. It will also supply clean hydrogen to other new and existing off-takers across the network.With such expansion strategies by market players is the driving factor this market.
                  • the global industrial gases market is expected to witness growth during the forecast period. is the driving factor this market.

                  The Industrial Gases market vendors should focus on grabbing business opportunities from the Manufacturing segment as it accounted for the largest market share in the base year.