Industrial Heat Recovery Systems Market Analysis, Size, and Forecast 2026-2030: APAC (China, Japan, and India), North America (US, Canada, and Mexico), Europe (Germany, Italy, and France), South America (Brazil, Argentina, and Colombia), Middle East and Africa (Saudi Arabia, UAE, and South Africa), and Rest of World (ROW)

Industrial Heat Recovery Systems Market Analysis, Size, and Forecast 2026-2030:
APAC (China, Japan, and India), North America (US, Canada, and Mexico), Europe (Germany, Italy, and France), South America (Brazil, Argentina, and Colombia), Middle East and Africa (Saudi Arabia, UAE, and South Africa), and Rest of World (ROW)

Published: Mar 2026 311 Pages SKU: IRTNTR81313

Market Overview at a Glance

$32.40 B
Market Opportunity
8.4%
CAGR 2025 - 2030
47.1%
APAC Growth
$25.81 B
Power and steam generation segment 2024

Industrial Heat Recovery Systems Market Size 2026-2030

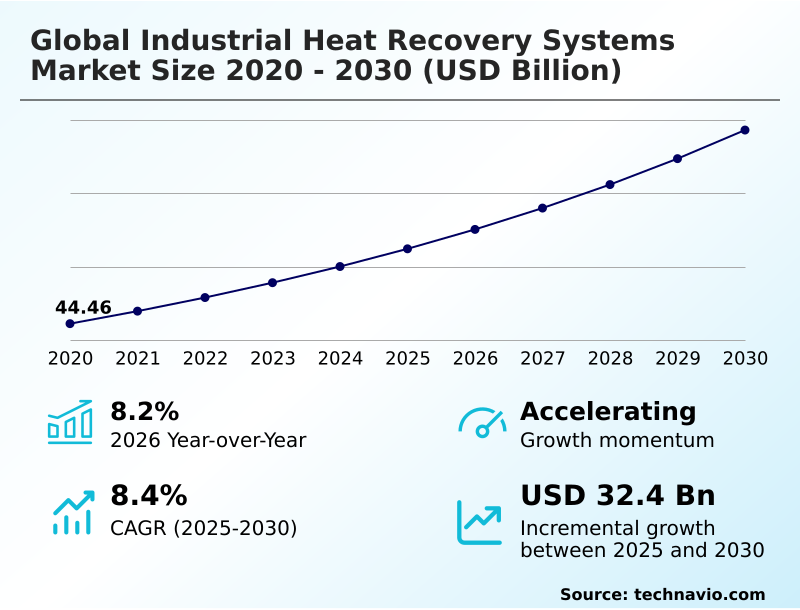
The industrial heat recovery systems market size is valued to increase by USD 32.40 billion, at a CAGR of 8.4% from 2025 to 2030. Accelerating decarbonization initiatives and regulatory compliance will drive the industrial heat recovery systems market.

Major Market Trends & Insights

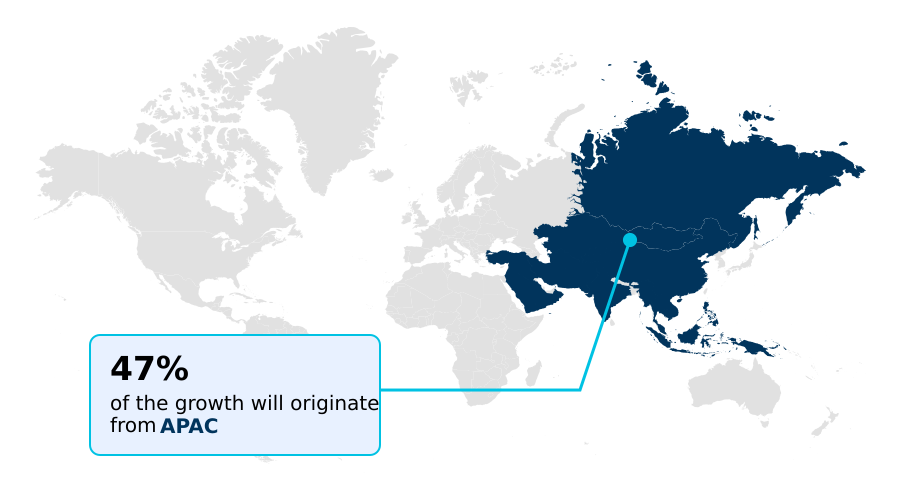
  • APAC dominated the market and accounted for a 47.1% growth during the forecast period.
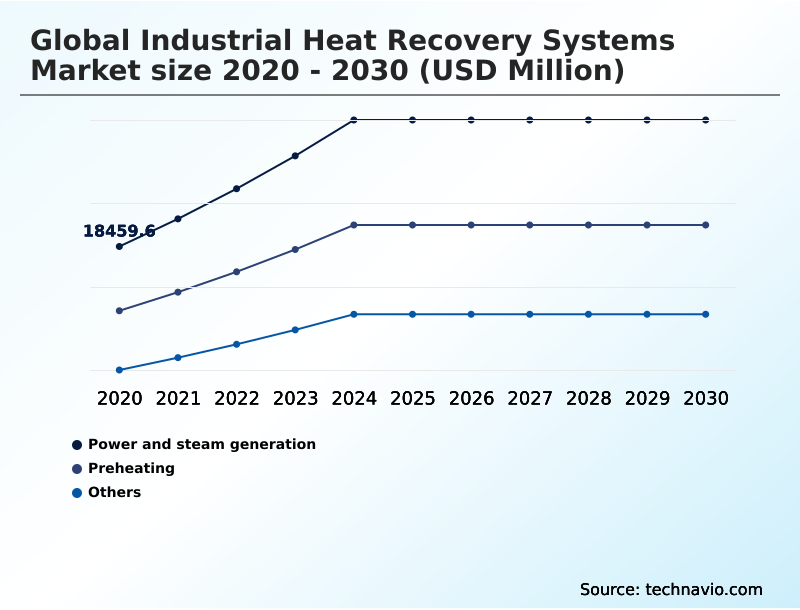
  • By Application - Power and steam generation segment was valued at USD 25.81 billion in 2024
  • By End-user - Energy generation segment accounted for the largest market revenue share in 2024

Market Size & Forecast

  • Market Opportunities: USD 52.80 billion
  • Market Future Opportunities: USD 32.40 billion
  • CAGR from 2025 to 2030 : 8.4%

Market Summary

  • The industrial heat recovery systems market is defined by a crucial shift toward thermal energy circularity and resource productivity. Organizations are increasingly adopting technologies for industrial decarbonization, moving beyond basic efficiency to integrated energy systems.
  • A core focus is on waste heat to power applications, which utilize advanced methods like the organic rankine cycle and heat recovery steam generators to convert exhaust into usable electricity. This strategy enhances energy security and supports industrial electrification efforts.
  • For instance, a chemical processing facility can deploy modular recovery units for preheating combustion air, directly lowering fuel consumption and contributing to net-zero emission targets. Innovations in high-temperature heat pumps and thermal storage systems are also expanding capabilities for low-grade heat recovery.
  • The market's trajectory is shaped by the need for advanced thermal management ecosystems, driven by both economic incentives and stringent environmental mandates.

What will be the Size of the Industrial Heat Recovery Systems Market during the forecast period?

Get Key Insights on Market Forecast (PDF) Request Free Sample

How is the Industrial Heat Recovery Systems Market Segmented?

The industrial heat recovery systems industry research report provides comprehensive data (region-wise segment analysis), with forecasts and estimates in "USD million" for the period 2026-2030, as well as historical data from 2020-2024 for the following segments.

  • Application
    • Power and steam generation
    • Preheating
    • Others
  • End-user
    • Energy generation
    • Petroleum refining
    • Chemical and petrochemical
    • Cement
    • Others
  • Type
    • Medium temperature
    • Low temperature
    • High temperature
  • Geography
    • APAC
      • China
      • Japan
      • India
    • North America
      • US
      • Canada
      • Mexico
    • Europe
      • Germany
      • Italy
      • France
    • South America
      • Brazil
      • Argentina
      • Colombia
    • Middle East and Africa
      • Saudi Arabia
      • UAE
      • South Africa
    • Rest of World (ROW)

By Application Insights

The power and steam generation segment is estimated to witness significant growth during the forecast period.

The power and steam generation segment is fundamental to industrial energy optimization, where thermal energy repurposing is a key strategy. This approach focuses on converting thermal waste from manufacturing into high-value utilities, such as on-site power generation.

Technologies like waste heat to power systems, often using an organic rankine cycle, enable industrial facilities to generate their own electricity from excess thermal energy.

This is especially critical for energy-intensive sectors where flue gas temperatures are high enough to drive turbines. By implementing process steam generation and thermal conversion efficiency, manufacturers can reduce their dependency on external electrical grids.

These smart thermal management systems achieve an operational cost reduction of up to 25%, insulating businesses from volatile utility prices and supporting sustainable manufacturing practices.

Request Free Sample

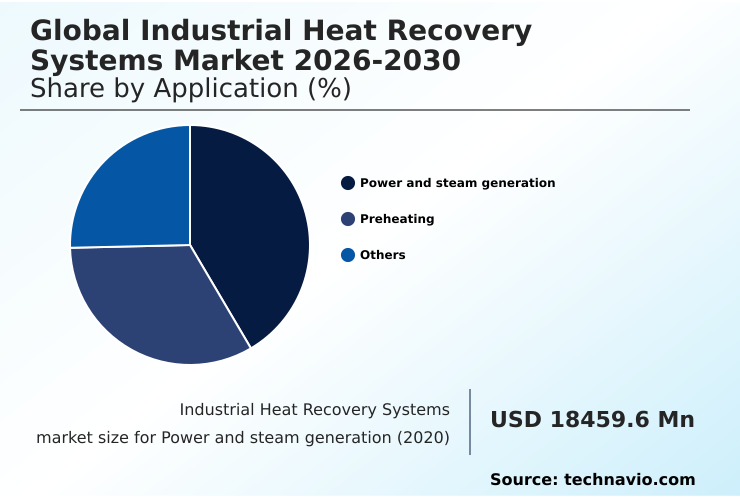
The Power and steam generation segment was valued at USD 25.81 billion in 2024 and showed a gradual increase during the forecast period.

Request Free Sample

Regional Analysis

APAC is estimated to contribute 47.1% to the growth of the global market during the forecast period.Technavio’s analysts have elaborately explained the regional trends and drivers that shape the market during the forecast period.

See How Industrial Heat Recovery Systems Market Demand is Rising in APAC Request Free Sample

The geographic landscape of the market is led by APAC, which is projected to grow at a rate approximately 19% faster than North America.

This growth is driven by aggressive industrial decarbonization policies and a focus on industrial energy optimization in countries like China and India.

The region's dense concentration of energy-intensive sectors provides a vast field for thermal energy repurposing and the deployment of advanced refrigerant development.

In contrast, North America and Europe are focusing on industrial electrification and the integration of high-temperature heat pumps to meet net-zero emission targets. The emphasis on district heating integration and cross-sector energy collaboration is particularly strong in Europe.

Firms in these mature markets are leveraging advanced materials science to enhance the durability of systems, ensuring a better lifecycle cost assessment. These regional differences highlight a global push toward more sustainable manufacturing practices.

Market Dynamics

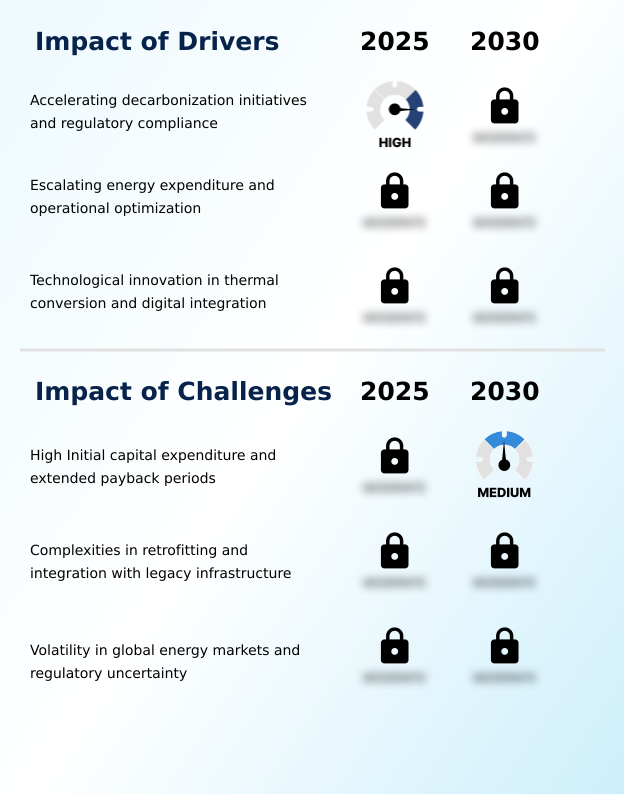
Our researchers analyzed the data with 2025 as the base year, along with the key drivers, trends, and challenges. A holistic analysis of drivers will help companies refine their marketing strategies to gain a competitive advantage.

  • Strategic decisions in the industrial heat recovery systems market are increasingly shaped by detailed evaluations of specific technologies and applications. For example, when comparing industrial heat pump efficiency, decision-makers are finding that newer systems can upgrade low-temperature waste heat valorization with greater effectiveness than older models.
  • The cost-benefit of ORC systems continues to improve, making them a viable option for a wider range of facilities. However, challenges persist, particularly in the complexities of retrofitting heat exchangers in refineries, where space and process integration are major concerns.
  • The roi of waste heat to power remains a critical metric, especially for large-scale waste heat recovery in cement production, where energy costs constitute a significant portion of operational expenses. Emerging opportunities in data center cooling heat reuse and heat recovery for green hydrogen are creating new avenues for growth, driving innovation in both technology and business models.
  • These applications, along with the decarbonizing industrial process heat, are pushing the industry toward more specialized solutions. For example, advancements in thermal management in chemical plants now allow for more precise control over process temperatures.
  • Optimizing steam generation from waste heat has also become a priority, as has the use of a digital twin for thermal system design to model performance before installation. The adoption of preheating systems for fuel savings is now standard in many industries. Addressing the challenges of integrating heat recovery is crucial for maximizing its benefits.
  • Innovations in advanced materials for heat exchangers are extending equipment life in corrosive environments, while the growth of high-temperature heat pump applications is enabling electrification. The trend toward modular heat recovery unit installation is reducing downtime, and the use of industrial cooling with absorption chillers is gaining traction.
  • Finally, specialized applications like heat recovery in food processing and district heating from industrial waste heat are expanding the market's reach.

What are the key market drivers leading to the rise in the adoption of Industrial Heat Recovery Systems Industry?

  • Accelerating decarbonization initiatives and the need for regulatory compliance are key drivers for market growth.

  • Market growth is significantly driven by accelerating industrial decarbonization initiatives and the need to meet net-zero emission targets. Escalating energy costs are compelling firms to prioritize industrial energy transition, leading to a focus on operational cost reduction.
  • Facilities adopting modern heat recovery technologies report an average 15% decrease in annual energy expenditures. Technological innovations, including liquid-to-liquid heat exchangers and exhaust gas economizers, are expanding the scope of thermal conversion efficiency.
  • The integration of digital platforms for asset performance management and predictive maintenance ensures that systems operate at peak performance, maximizing fuel consumption reduction.
  • Furthermore, the global push toward a circular economy, coupled with energy efficiency audits, is solidifying the business case for investing in these systems and advancing supply chain modernization.

What are the market trends shaping the Industrial Heat Recovery Systems Industry?

  • The integration of artificial intelligence and digital twin technology is an emerging trend, revolutionizing thermal management in industrial settings.

  • Key market trends are centered on the rapid adoption of thermal management ecosystems and the use of digital twin technology to optimize performance. The proliferation of high-temperature heat pumps is enabling industrial electrification, allowing facilities to achieve a 20% improvement in thermal efficiency by upgrading low-grade heat.
  • The expansion into new sectors like green hydrogen heat capture and data center heat reuse is diversifying market applications, with some projects reducing cooling energy demand by up to 35%. Technologies enabling this shift include advanced refrigerant development and oil-free centrifugal compressors, which are crucial for sustainable manufacturing practices.
  • This move toward smart thermal management, supported by a clear regulatory compliance framework and integrated energy systems, is redefining how industries approach energy consumption and carbon footprint reduction.

What challenges does the Industrial Heat Recovery Systems Industry face during its growth?

  • High initial capital expenditure and extended payback periods present a significant challenge to industry growth.

  • A primary market challenge is the high initial capital expenditure planning required, which often involves payback periods extending beyond five years, posing a hurdle for firms with tight budgets. Integrating new systems with legacy infrastructure presents another significant barrier, with retrofitting projects increasing installation costs by as much as 30% due to unforeseen structural modifications.
  • The volatility of global energy markets and inconsistent government policies create uncertainty, impacting the return on investment analysis. The lack of standardized financial models for quantifying secondary benefits like industrial water conservation makes it difficult to secure project approvals.
  • Technical complexities related to handling diverse waste streams demand specialized corrosion-resistant alloys and waste heat recovery boilers, further escalating costs and complicating lifecycle cost assessment and carbon pricing impact.

Exclusive Technavio Analysis on Customer Landscape

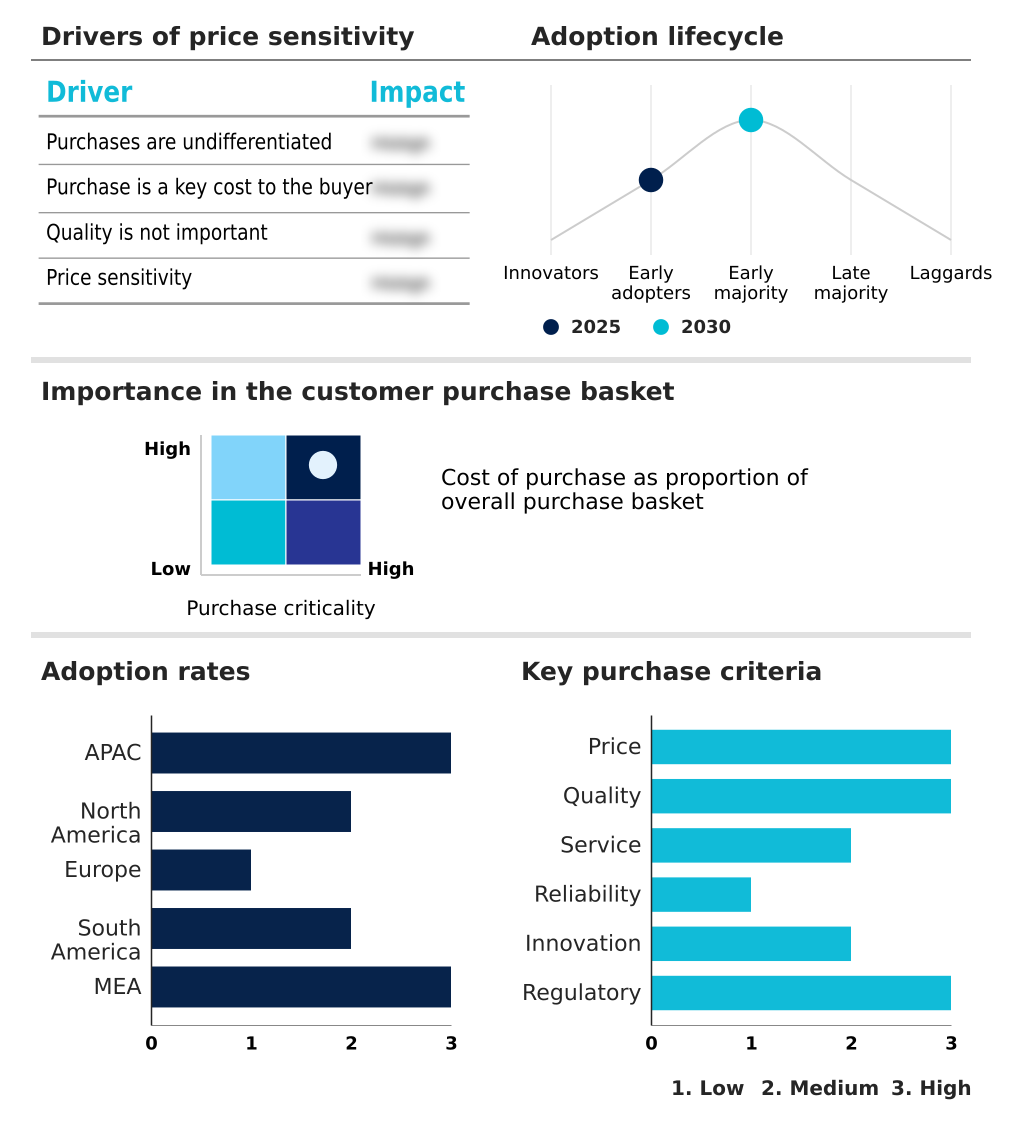
The industrial heat recovery systems market forecasting report includes the adoption lifecycle of the market, covering from the innovator’s stage to the laggard’s stage. It focuses on adoption rates in different regions based on penetration. Furthermore, the industrial heat recovery systems market report also includes key purchase criteria and drivers of price sensitivity to help companies evaluate and develop their market growth analysis strategies.

Customer Landscape of Industrial Heat Recovery Systems Industry

Competitive Landscape

Companies are implementing various strategies, such as strategic alliances, industrial heat recovery systems market forecast, partnerships, mergers and acquisitions, geographical expansion, and product/service launches, to enhance their presence in the industry.

ABB Ltd. - Expertise in industrial heat recovery systems includes waste heat recovery for power generation and integrated solutions for low-temperature waste heat utilization.

The industry research and growth report includes detailed analyses of the competitive landscape of the market and information about key companies, including:

  • ABB Ltd.
  • Alfa Laval AB
  • Atlas Copco AB
  • Danfoss AS
  • Eastman Chemical Co.
  • Emerson Electric Co.
  • Forbes Marshall Pvt. Ltd.
  • GEA Group AG
  • Ingersoll Rand Inc.
  • Johnson Controls International
  • Kelvion Holding GmbH
  • Mitsubishi Heavy Industries
  • Pentair Plc
  • Robert Bosch GmbH
  • Shanghai Shenglin Technology Ltd.
  • SPX FLOW Inc.
  • SUEZ SA
  • Sulzer Ltd.
  • Thermax Ltd.
  • Turboden SpA
  • Viessmann Generations GmbH and Co

Qualitative and quantitative analysis of companies has been conducted to help clients understand the wider business environment as well as the strengths and weaknesses of key industry players. Data is qualitatively analyzed to categorize companies as pure play, category-focused, industry-focused, and diversified; it is quantitatively analyzed to categorize companies as dominant, leading, strong, tentative, and weak.

Recent Development and News in Industrial heat recovery systems market

  • In May 2025, Johnson Controls finalized a landmark project in Northern Europe that successfully integrated the waste heat recovery system of a large-scale data center with a municipal district heating grid, demonstrating the potential for cross-sector collaboration.
  • In August 2025, a large-scale textile manufacturing plant in Vietnam reported significant technical difficulties when attempting to install a condensing economizer system, as the existing exhaust stacks could not support the new equipment's weight.
  • In September 2025, a major steel production facility in the United States completed the installation of a comprehensive waste heat to power system to stabilize its internal power supply against rising local electricity tariffs.
  • In October 2025, Alfa Laval introduced a digital monitoring platform designed to enhance the heat transfer efficiency of plate heat exchangers by using predictive maintenance algorithms to prevent fouling and scaling.

Dive into Technavio’s robust research methodology, blending expert interviews, extensive data synthesis, and validated models for unparalleled Industrial Heat Recovery Systems Market insights. See full methodology.

Market Scope
Page number 311
Base year 2025
Historic period 2020-2024
Forecast period 2026-2030
Growth momentum & CAGR Accelerate at a CAGR of 8.4%
Market growth 2026-2030 USD 32395.6 million
Market structure Fragmented
YoY growth 2025-2026(%) 8.2%
Key countries China, Japan, India, South Korea, Australia, Indonesia, US, Canada, Mexico, Germany, Italy, France, UK, Spain, The Netherlands, Brazil, Argentina, Colombia, Saudi Arabia, UAE, South Africa, Israel and Turkey
Competitive landscape Leading Companies, Market Positioning of Companies, Competitive Strategies, and Industry Risks

Request Free Sample

Research Analyst Overview

  • The industrial heat recovery systems market is advancing through sophisticated technological integration and a strategic focus on thermal energy circularity. The adoption of advanced thermal management ecosystems is no longer optional but a core component of competitive manufacturing, directly impacting boardroom decisions on capital expenditure and compliance.
  • Key technologies such as high-temperature heat pumps, plate heat exchangers, and the organic rankine cycle are enabling unprecedented levels of thermal conversion efficiency. For example, facilities implementing comprehensive waste heat to power systems have reported up to a 40% reduction in reliance on grid electricity. Innovations in condensing economizer systems and modular recovery units are simplifying brownfield retrofits.
  • The use of specialized thermal fluids and corrosion-resistant alloys extends equipment lifespan, while digital twin technology and predictive maintenance algorithms optimize performance. This shift toward industrial decarbonization is supported by energy performance contracting and the broader move to industrial electrification, with applications like preheating combustion air and process steam generation becoming standard.
  • The ability to capture value from previously wasted resources through low-grade heat recovery, thermal storage systems, and heat recovery steam generators is reshaping industrial economics.

What are the Key Data Covered in this Industrial Heat Recovery Systems Market Research and Growth Report?

  • What is the expected growth of the Industrial Heat Recovery Systems Market between 2026 and 2030?

    • USD 32.40 billion, at a CAGR of 8.4%

  • What segmentation does the market report cover?

    • The report is segmented by Application (Power and steam generation, Preheating, and Others), End-user (Energy generation, Petroleum refining, Chemical and petrochemical, Cement, and Others), Type (Medium temperature, Low temperature, and High temperature) and Geography (APAC, North America, Europe, South America, Middle East and Africa)

  • Which regions are analyzed in the report?

    • APAC, North America, Europe, South America and Middle East and Africa

  • What are the key growth drivers and market challenges?

    • Accelerating decarbonization initiatives and regulatory compliance, High Initial capital expenditure and extended payback periods

  • Who are the major players in the Industrial Heat Recovery Systems Market?

    • ABB Ltd., Alfa Laval AB, Atlas Copco AB, Danfoss AS, Eastman Chemical Co., Emerson Electric Co., Forbes Marshall Pvt. Ltd., GEA Group AG, Ingersoll Rand Inc., Johnson Controls International, Kelvion Holding GmbH, Mitsubishi Heavy Industries, Pentair Plc, Robert Bosch GmbH, Shanghai Shenglin Technology Ltd., SPX FLOW Inc., SUEZ SA, Sulzer Ltd., Thermax Ltd., Turboden SpA and Viessmann Generations GmbH and Co

Market Research Insights

  • The market dynamics for industrial heat recovery systems are shaped by a strong focus on industrial energy optimization and enhancing asset performance management. The strategic implementation of these systems leads to measurable business outcomes, with some facilities achieving a 30% reduction in fuel consumption through efficient thermal load management.
  • This directly improves return on investment analysis, making capital expenditure planning more attractive. Furthermore, alignment with circular economy principles and a stringent regulatory compliance framework is driving adoption, as companies in energy-intensive sectors seek to lower their carbon footprint.
  • The integration of smart factory technologies with heat recovery hardware has improved thermal efficiency by over 15% in certain brownfield project retrofitting scenarios, showcasing the value of supply chain modernization and industrial water conservation.

We can help! Our analysts can customize this industrial heat recovery systems market research report to meet your requirements.

Get in touch

1. Executive Summary

1.1 Market overview

Executive Summary - Chart on Market Overview
Executive Summary - Data Table on Market Overview
Executive Summary - Chart on Global Market Characteristics
Executive Summary - Chart on Market by Geography
Executive Summary - Chart on Market Segmentation by Application
Executive Summary - Chart on Market Segmentation by End-user
Executive Summary - Chart on Market Segmentation by Type
Executive Summary - Chart on Incremental Growth
Executive Summary - Data Table on Incremental Growth
Executive Summary - Chart on Company Market Positioning

2. Technavio Analysis

2.1 Analysis of price sensitivity, lifecycle, customer purchase basket, adoption rates, and purchase criteria

2.2 Criticality of inputs and Factors of differentiation

Chart on Overview on criticality of inputs and factors of differentiation

2.3 Factors of disruption

Chart on Overview on factors of disruption

2.4 Impact of drivers and challenges

Chart on Impact of drivers and challenges in 2025 and 2030

3. Market Landscape

3.1 Market ecosystem

Chart on Parent Market
Data Table on - Parent Market

3.2 Market characteristics

Chart on Market characteristics analysis

3.3 Value chain analysis

Chart on Value chain analysis

4. Market Sizing

4.1 Market definition

Data Table on Offerings of companies included in the market definition

4.2 Market segment analysis

Market segments

4.3 Market size 2025

4.4 Market outlook: Forecast for 2025-2030

Chart on Global - Market size and forecast 2025-2030 ($ million)
Data Table on Global - Market size and forecast 2025-2030 ($ million)
Chart on Global Market: Year-over-year growth 2025-2030 (%)
Data Table on Global Market: Year-over-year growth 2025-2030 (%)

5. Historic Market Size

5.1 Global Industrial Heat Recovery Systems Market 2020 - 2024

Historic Market Size - Data Table on Global Industrial Heat Recovery Systems Market 2020 - 2024 ($ million)

5.2 Application segment analysis 2020 - 2024

Historic Market Size - Application Segment 2020 - 2024 ($ million)

5.3 End-user segment analysis 2020 - 2024

Historic Market Size - End-user Segment 2020 - 2024 ($ million)

5.4 Type segment analysis 2020 - 2024

Historic Market Size - Type Segment 2020 - 2024 ($ million)

5.5 Geography segment analysis 2020 - 2024

Historic Market Size - Geography Segment 2020 - 2024 ($ million)

5.6 Country segment analysis 2020 - 2024

Historic Market Size - Country Segment 2020 - 2024 ($ million)

6. Qualitative Analysis

6.1 The AI impact on Global Industrial Heat Recovery Systems Market

7. Five Forces Analysis

7.1 Five forces summary

Five forces analysis - Comparison between 2025 and 2030

7.2 Bargaining power of buyers

Bargaining power of buyers - Impact of key factors 2025 and 2030

7.3 Bargaining power of suppliers

Bargaining power of suppliers - Impact of key factors in 2025 and 2030

7.4 Threat of new entrants

Threat of new entrants - Impact of key factors in 2025 and 2030

7.5 Threat of substitutes

Threat of substitutes - Impact of key factors in 2025 and 2030

7.6 Threat of rivalry

Threat of rivalry - Impact of key factors in 2025 and 2030

7.7 Market condition

Chart on Market condition - Five forces 2025 and 2030

8. Market Segmentation by Application

8.1 Market segments

Chart on Application - Market share 2025-2030 (%)
Data Table on Application - Market share 2025-2030 (%)

8.2 Comparison by Application

Chart on Comparison by Application
Data Table on Comparison by Application

8.3 Power and steam generation - Market size and forecast 2025-2030

Chart on Power and steam generation - Market size and forecast 2025-2030 ($ million)
Data Table on Power and steam generation - Market size and forecast 2025-2030 ($ million)
Chart on Power and steam generation - Year-over-year growth 2025-2030 (%)
Data Table on Power and steam generation - Year-over-year growth 2025-2030 (%)

8.4 Preheating - Market size and forecast 2025-2030

Chart on Preheating - Market size and forecast 2025-2030 ($ million)
Data Table on Preheating - Market size and forecast 2025-2030 ($ million)
Chart on Preheating - Year-over-year growth 2025-2030 (%)
Data Table on Preheating - Year-over-year growth 2025-2030 (%)

8.5 Others - Market size and forecast 2025-2030

Chart on Others - Market size and forecast 2025-2030 ($ million)
Data Table on Others - Market size and forecast 2025-2030 ($ million)
Chart on Others - Year-over-year growth 2025-2030 (%)
Data Table on Others - Year-over-year growth 2025-2030 (%)

8.6 Market opportunity by Application

Market opportunity by Application ($ million)
Data Table on Market opportunity by Application ($ million)

9. Market Segmentation by End-user

9.1 Market segments

Chart on End-user - Market share 2025-2030 (%)
Data Table on End-user - Market share 2025-2030 (%)

9.2 Comparison by End-user

Chart on Comparison by End-user
Data Table on Comparison by End-user

9.3 Energy generation - Market size and forecast 2025-2030

Chart on Energy generation - Market size and forecast 2025-2030 ($ million)
Data Table on Energy generation - Market size and forecast 2025-2030 ($ million)
Chart on Energy generation - Year-over-year growth 2025-2030 (%)
Data Table on Energy generation - Year-over-year growth 2025-2030 (%)

9.4 Petroleum refining - Market size and forecast 2025-2030

Chart on Petroleum refining - Market size and forecast 2025-2030 ($ million)
Data Table on Petroleum refining - Market size and forecast 2025-2030 ($ million)
Chart on Petroleum refining - Year-over-year growth 2025-2030 (%)
Data Table on Petroleum refining - Year-over-year growth 2025-2030 (%)

9.5 Chemical and petrochemical - Market size and forecast 2025-2030

Chart on Chemical and petrochemical - Market size and forecast 2025-2030 ($ million)
Data Table on Chemical and petrochemical - Market size and forecast 2025-2030 ($ million)
Chart on Chemical and petrochemical - Year-over-year growth 2025-2030 (%)
Data Table on Chemical and petrochemical - Year-over-year growth 2025-2030 (%)

9.6 Cement - Market size and forecast 2025-2030

Chart on Cement - Market size and forecast 2025-2030 ($ million)
Data Table on Cement - Market size and forecast 2025-2030 ($ million)
Chart on Cement - Year-over-year growth 2025-2030 (%)
Data Table on Cement - Year-over-year growth 2025-2030 (%)

9.7 Others - Market size and forecast 2025-2030

Chart on Others - Market size and forecast 2025-2030 ($ million)
Data Table on Others - Market size and forecast 2025-2030 ($ million)
Chart on Others - Year-over-year growth 2025-2030 (%)
Data Table on Others - Year-over-year growth 2025-2030 (%)

9.8 Market opportunity by End-user

Market opportunity by End-user ($ million)
Data Table on Market opportunity by End-user ($ million)

10. Market Segmentation by Type

10.1 Market segments

Chart on Type - Market share 2025-2030 (%)
Data Table on Type - Market share 2025-2030 (%)

10.2 Comparison by Type

Chart on Comparison by Type
Data Table on Comparison by Type

10.3 Medium temperature - Market size and forecast 2025-2030

Chart on Medium temperature - Market size and forecast 2025-2030 ($ million)
Data Table on Medium temperature - Market size and forecast 2025-2030 ($ million)
Chart on Medium temperature - Year-over-year growth 2025-2030 (%)
Data Table on Medium temperature - Year-over-year growth 2025-2030 (%)

10.4 Low temperature - Market size and forecast 2025-2030

Chart on Low temperature - Market size and forecast 2025-2030 ($ million)
Data Table on Low temperature - Market size and forecast 2025-2030 ($ million)
Chart on Low temperature - Year-over-year growth 2025-2030 (%)
Data Table on Low temperature - Year-over-year growth 2025-2030 (%)

10.5 High temperature - Market size and forecast 2025-2030

Chart on High temperature - Market size and forecast 2025-2030 ($ million)
Data Table on High temperature - Market size and forecast 2025-2030 ($ million)
Chart on High temperature - Year-over-year growth 2025-2030 (%)
Data Table on High temperature - Year-over-year growth 2025-2030 (%)

10.6 Market opportunity by Type

Market opportunity by Type ($ million)
Data Table on Market opportunity by Type ($ million)

11. Customer Landscape

11.1 Customer landscape overview

Analysis of price sensitivity, lifecycle, customer purchase basket, adoption rates, and purchase criteria

12. Geographic Landscape

12.1 Geographic segmentation

Chart on Market share by geography 2025-2030 (%)
Data Table on Market share by geography 2025-2030 (%)

12.2 Geographic comparison

Chart on Geographic comparison
Data Table on Geographic comparison

12.3 APAC - Market size and forecast 2025-2030

Chart on APAC - Market size and forecast 2025-2030 ($ million)
Data Table on APAC - Market size and forecast 2025-2030 ($ million)
Chart on APAC - Year-over-year growth 2025-2030 (%)
Data Table on APAC - Year-over-year growth 2025-2030 (%)
Chart on Regional Comparison - APAC
Data Table on Regional Comparison - APAC

12.3.1 China - Market size and forecast 2025-2030

Chart on China - Market size and forecast 2025-2030 ($ million)
Data Table on China - Market size and forecast 2025-2030 ($ million)
Chart on China - Year-over-year growth 2025-2030 (%)
Data Table on China - Year-over-year growth 2025-2030 (%)

12.3.2 Japan - Market size and forecast 2025-2030

Chart on Japan - Market size and forecast 2025-2030 ($ million)
Data Table on Japan - Market size and forecast 2025-2030 ($ million)
Chart on Japan - Year-over-year growth 2025-2030 (%)
Data Table on Japan - Year-over-year growth 2025-2030 (%)

12.3.3 India - Market size and forecast 2025-2030

Chart on India - Market size and forecast 2025-2030 ($ million)
Data Table on India - Market size and forecast 2025-2030 ($ million)
Chart on India - Year-over-year growth 2025-2030 (%)
Data Table on India - Year-over-year growth 2025-2030 (%)

12.3.4 South Korea - Market size and forecast 2025-2030

Chart on South Korea - Market size and forecast 2025-2030 ($ million)
Data Table on South Korea - Market size and forecast 2025-2030 ($ million)
Chart on South Korea - Year-over-year growth 2025-2030 (%)
Data Table on South Korea - Year-over-year growth 2025-2030 (%)

12.3.5 Australia - Market size and forecast 2025-2030

Chart on Australia - Market size and forecast 2025-2030 ($ million)
Data Table on Australia - Market size and forecast 2025-2030 ($ million)
Chart on Australia - Year-over-year growth 2025-2030 (%)
Data Table on Australia - Year-over-year growth 2025-2030 (%)

12.3.6 Indonesia - Market size and forecast 2025-2030

Chart on Indonesia - Market size and forecast 2025-2030 ($ million)
Data Table on Indonesia - Market size and forecast 2025-2030 ($ million)
Chart on Indonesia - Year-over-year growth 2025-2030 (%)
Data Table on Indonesia - Year-over-year growth 2025-2030 (%)

12.4 North America - Market size and forecast 2025-2030

Chart on North America - Market size and forecast 2025-2030 ($ million)
Data Table on North America - Market size and forecast 2025-2030 ($ million)
Chart on North America - Year-over-year growth 2025-2030 (%)
Data Table on North America - Year-over-year growth 2025-2030 (%)
Chart on Regional Comparison - North America
Data Table on Regional Comparison - North America

12.4.1 US - Market size and forecast 2025-2030

Chart on US - Market size and forecast 2025-2030 ($ million)
Data Table on US - Market size and forecast 2025-2030 ($ million)
Chart on US - Year-over-year growth 2025-2030 (%)
Data Table on US - Year-over-year growth 2025-2030 (%)

12.4.2 Canada - Market size and forecast 2025-2030

Chart on Canada - Market size and forecast 2025-2030 ($ million)
Data Table on Canada - Market size and forecast 2025-2030 ($ million)
Chart on Canada - Year-over-year growth 2025-2030 (%)
Data Table on Canada - Year-over-year growth 2025-2030 (%)

12.4.3 Mexico - Market size and forecast 2025-2030

Chart on Mexico - Market size and forecast 2025-2030 ($ million)
Data Table on Mexico - Market size and forecast 2025-2030 ($ million)
Chart on Mexico - Year-over-year growth 2025-2030 (%)
Data Table on Mexico - Year-over-year growth 2025-2030 (%)

12.5 Europe - Market size and forecast 2025-2030

Chart on Europe - Market size and forecast 2025-2030 ($ million)
Data Table on Europe - Market size and forecast 2025-2030 ($ million)
Chart on Europe - Year-over-year growth 2025-2030 (%)
Data Table on Europe - Year-over-year growth 2025-2030 (%)
Chart on Regional Comparison - Europe
Data Table on Regional Comparison - Europe

12.5.1 Germany - Market size and forecast 2025-2030

Chart on Germany - Market size and forecast 2025-2030 ($ million)
Data Table on Germany - Market size and forecast 2025-2030 ($ million)
Chart on Germany - Year-over-year growth 2025-2030 (%)
Data Table on Germany - Year-over-year growth 2025-2030 (%)

12.5.2 Italy - Market size and forecast 2025-2030

Chart on Italy - Market size and forecast 2025-2030 ($ million)
Data Table on Italy - Market size and forecast 2025-2030 ($ million)
Chart on Italy - Year-over-year growth 2025-2030 (%)
Data Table on Italy - Year-over-year growth 2025-2030 (%)

12.5.3 France - Market size and forecast 2025-2030

Chart on France - Market size and forecast 2025-2030 ($ million)
Data Table on France - Market size and forecast 2025-2030 ($ million)
Chart on France - Year-over-year growth 2025-2030 (%)
Data Table on France - Year-over-year growth 2025-2030 (%)

12.5.4 UK - Market size and forecast 2025-2030

Chart on UK - Market size and forecast 2025-2030 ($ million)
Data Table on UK - Market size and forecast 2025-2030 ($ million)
Chart on UK - Year-over-year growth 2025-2030 (%)
Data Table on UK - Year-over-year growth 2025-2030 (%)

12.5.5 Spain - Market size and forecast 2025-2030

Chart on Spain - Market size and forecast 2025-2030 ($ million)
Data Table on Spain - Market size and forecast 2025-2030 ($ million)
Chart on Spain - Year-over-year growth 2025-2030 (%)
Data Table on Spain - Year-over-year growth 2025-2030 (%)

12.5.6 The Netherlands - Market size and forecast 2025-2030

Chart on The Netherlands - Market size and forecast 2025-2030 ($ million)
Data Table on The Netherlands - Market size and forecast 2025-2030 ($ million)
Chart on The Netherlands - Year-over-year growth 2025-2030 (%)
Data Table on The Netherlands - Year-over-year growth 2025-2030 (%)

12.6 South America - Market size and forecast 2025-2030

Chart on South America - Market size and forecast 2025-2030 ($ million)
Data Table on South America - Market size and forecast 2025-2030 ($ million)
Chart on South America - Year-over-year growth 2025-2030 (%)
Data Table on South America - Year-over-year growth 2025-2030 (%)
Chart on Regional Comparison - South America
Data Table on Regional Comparison - South America

12.6.1 Brazil - Market size and forecast 2025-2030

Chart on Brazil - Market size and forecast 2025-2030 ($ million)
Data Table on Brazil - Market size and forecast 2025-2030 ($ million)
Chart on Brazil - Year-over-year growth 2025-2030 (%)
Data Table on Brazil - Year-over-year growth 2025-2030 (%)

12.6.2 Argentina - Market size and forecast 2025-2030

Chart on Argentina - Market size and forecast 2025-2030 ($ million)
Data Table on Argentina - Market size and forecast 2025-2030 ($ million)
Chart on Argentina - Year-over-year growth 2025-2030 (%)
Data Table on Argentina - Year-over-year growth 2025-2030 (%)

12.6.3 Colombia - Market size and forecast 2025-2030

Chart on Colombia - Market size and forecast 2025-2030 ($ million)
Data Table on Colombia - Market size and forecast 2025-2030 ($ million)
Chart on Colombia - Year-over-year growth 2025-2030 (%)
Data Table on Colombia - Year-over-year growth 2025-2030 (%)

12.7 Middle East and Africa - Market size and forecast 2025-2030

Chart on Middle East and Africa - Market size and forecast 2025-2030 ($ million)
Data Table on Middle East and Africa - Market size and forecast 2025-2030 ($ million)
Chart on Middle East and Africa - Year-over-year growth 2025-2030 (%)
Data Table on Middle East and Africa - Year-over-year growth 2025-2030 (%)
Chart on Regional Comparison - Middle East and Africa
Data Table on Regional Comparison - Middle East and Africa

12.7.1 Saudi Arabia - Market size and forecast 2025-2030

Chart on Saudi Arabia - Market size and forecast 2025-2030 ($ million)
Data Table on Saudi Arabia - Market size and forecast 2025-2030 ($ million)
Chart on Saudi Arabia - Year-over-year growth 2025-2030 (%)
Data Table on Saudi Arabia - Year-over-year growth 2025-2030 (%)

12.7.2 UAE - Market size and forecast 2025-2030

Chart on UAE - Market size and forecast 2025-2030 ($ million)
Data Table on UAE - Market size and forecast 2025-2030 ($ million)
Chart on UAE - Year-over-year growth 2025-2030 (%)
Data Table on UAE - Year-over-year growth 2025-2030 (%)

12.7.3 South Africa - Market size and forecast 2025-2030

Chart on South Africa - Market size and forecast 2025-2030 ($ million)
Data Table on South Africa - Market size and forecast 2025-2030 ($ million)
Chart on South Africa - Year-over-year growth 2025-2030 (%)
Data Table on South Africa - Year-over-year growth 2025-2030 (%)

12.7.4 Israel - Market size and forecast 2025-2030

Chart on Israel - Market size and forecast 2025-2030 ($ million)
Data Table on Israel - Market size and forecast 2025-2030 ($ million)
Chart on Israel - Year-over-year growth 2025-2030 (%)
Data Table on Israel - Year-over-year growth 2025-2030 (%)

12.7.5 Turkey - Market size and forecast 2025-2030

Chart on Turkey - Market size and forecast 2025-2030 ($ million)
Data Table on Turkey - Market size and forecast 2025-2030 ($ million)
Chart on Turkey - Year-over-year growth 2025-2030 (%)
Data Table on Turkey - Year-over-year growth 2025-2030 (%)

12.8 Market opportunity by geography

Market opportunity by geography ($ million)
Data Tables on Market opportunity by geography ($ million)

13. Drivers, Challenges, and Opportunity

13.1 Market drivers

Accelerating decarbonization initiatives and regulatory compliance
Escalating energy expenditure and operational optimization
Technological innovation in thermal conversion and digital integration

13.2 Market challenges

High Initial capital expenditure and extended payback periods
Complexities in retrofitting and integration with legacy infrastructure
Volatility in global energy markets and regulatory uncertainty

13.3 Impact of drivers and challenges

Impact of drivers and challenges in 2025 and 2030

13.4 Market opportunities

Integration of AI and digital twin technology in thermal management
Proliferation of high-temperature heat pumps for industrial decarbonization
Expansion of heat recovery applications in green hydrogen and data center sectors

14. Competitive Landscape

14.1 Overview

14.2

Overview on criticality of inputs and factors of differentiation

14.3 Landscape disruption

Overview on factors of disruption

14.4 Industry risks

Impact of key risks on business

15. Competitive Analysis

15.1 Companies profiled

Companies covered

15.2 Company ranking index

15.3 Market positioning of companies

Matrix on companies position and classification

15.4 ABB Ltd.

ABB Ltd. - Overview
ABB Ltd. - Business segments
ABB Ltd. - Key news
ABB Ltd. - Key offerings
ABB Ltd. - Segment focus
SWOT

15.5 Alfa Laval AB

Alfa Laval AB - Overview
Alfa Laval AB - Business segments
Alfa Laval AB - Key news
Alfa Laval AB - Key offerings
Alfa Laval AB - Segment focus
SWOT

15.6 Atlas Copco AB

Atlas Copco AB - Overview
Atlas Copco AB - Business segments
Atlas Copco AB - Key news
Atlas Copco AB - Key offerings
Atlas Copco AB - Segment focus
SWOT

15.7 Danfoss AS

Danfoss AS - Overview
Danfoss AS - Product / Service
Danfoss AS - Key offerings
SWOT

15.8 Eastman Chemical Co.

Eastman Chemical Co. - Overview
Eastman Chemical Co. - Business segments
Eastman Chemical Co. - Key news
Eastman Chemical Co. - Key offerings
Eastman Chemical Co. - Segment focus
SWOT

15.9 Emerson Electric Co.

Emerson Electric Co. - Overview
Emerson Electric Co. - Business segments
Emerson Electric Co. - Key news
Emerson Electric Co. - Key offerings
Emerson Electric Co. - Segment focus
SWOT

15.10 Forbes Marshall Pvt. Ltd.

Forbes Marshall Pvt. Ltd. - Overview
Forbes Marshall Pvt. Ltd. - Product / Service
Forbes Marshall Pvt. Ltd. - Key offerings
SWOT

15.11 GEA Group AG

GEA Group AG - Overview
GEA Group AG - Business segments
GEA Group AG - Key offerings
GEA Group AG - Segment focus
SWOT

15.12 Ingersoll Rand Inc.

Ingersoll Rand Inc. - Overview
Ingersoll Rand Inc. - Business segments
Ingersoll Rand Inc. - Key offerings
Ingersoll Rand Inc. - Segment focus
SWOT

15.13 Johnson Controls International

Johnson Controls International - Overview
Johnson Controls International - Business segments
Johnson Controls International - Key news
Johnson Controls International - Key offerings
Johnson Controls International - Segment focus
SWOT

15.14 Kelvion Holding GmbH

Kelvion Holding GmbH - Overview
Kelvion Holding GmbH - Product / Service
Kelvion Holding GmbH - Key offerings
SWOT

15.15 Mitsubishi Heavy Industries

Mitsubishi Heavy Industries - Overview
Mitsubishi Heavy Industries - Business segments
Mitsubishi Heavy Industries - Key news
Mitsubishi Heavy Industries - Key offerings
Mitsubishi Heavy Industries - Segment focus
SWOT

15.16 Pentair Plc

Pentair Plc - Overview
Pentair Plc - Business segments
Pentair Plc - Key news
Pentair Plc - Key offerings
Pentair Plc - Segment focus
SWOT

15.17 Robert Bosch GmbH

Robert Bosch GmbH - Overview
Robert Bosch GmbH - Product / Service
Robert Bosch GmbH - Key news
Robert Bosch GmbH - Key offerings
SWOT

15.18 Shanghai Shenglin Technology Ltd.

Shanghai Shenglin Technology Ltd. - Overview
Shanghai Shenglin Technology Ltd. - Product / Service
Shanghai Shenglin Technology Ltd. - Key offerings
SWOT

16. Appendix

16.1 Scope of the report

Market definition
Objectives
Notes and caveats

16.2 Inclusions and exclusions checklist

Inclusions checklist
Exclusions checklist

16.3 Currency conversion rates for US$

16.4 Research methodology

16.5 Data procurement

Information sources

16.6 Data validation

16.7 Validation techniques employed for market sizing

16.8 Data synthesis

16.9 360 degree market analysis

16.10 List of abbreviations

Research Methodology

Technavio presents a detailed picture of the market by way of study, synthesis, and summation of data from multiple sources. The analysts have presented the various facets of the market with a particular focus on identifying the key industry influencers. The data thus presented is comprehensive, reliable, and the result of extensive research, both primary and secondary.

INFORMATION SOURCES

Primary sources

  • Manufacturers and suppliers
  • Channel partners
  • Industry experts
  • Strategic decision makers

Secondary sources

  • Industry journals and periodicals
  • Government data
  • Financial reports of key industry players
  • Historical data
  • Press releases

DATA ANALYSIS

Data Synthesis

  • Collation of data
  • Estimation of key figures
  • Analysis of derived insights

Data Validation

  • Triangulation with data models
  • Reference against proprietary databases
  • Corroboration with industry experts

REPORT WRITING

Qualitative

  • Market drivers
  • Market challenges
  • Market trends
  • Five forces analysis

Quantitative

  • Market size and forecast
  • Market segmentation
  • Geographical insights
  • Competitive landscape

Interested in this report?

Get your sample now to see our research methodology and insights!

Download Now

Frequently Asked Questions

Industrial Heat Recovery Systems market growth will increase by USD 32395.6 million during 2026-2030.

The Industrial Heat Recovery Systems market is expected to grow at a CAGR of 8.4% during 2026-2030.

Industrial Heat Recovery Systems market is segmented by Application (Power and steam generation, Preheating, Others) End-user (Energy generation, Petroleum refining, Chemical and petrochemical, Cement, Others) Type (Medium temperature, Low temperature, High temperature)

ABB Ltd., Alfa Laval AB, Atlas Copco AB, Danfoss AS, Eastman Chemical Co., Emerson Electric Co., Forbes Marshall Pvt. Ltd., GEA Group AG, Ingersoll Rand Inc., Johnson Controls International, Kelvion Holding GmbH, Mitsubishi Heavy Industries, Pentair Plc, Robert Bosch GmbH, Shanghai Shenglin Technology Ltd., SPX FLOW Inc., SUEZ SA, Sulzer Ltd., Thermax Ltd., Turboden SpA, Viessmann Generations GmbH and Co are a few of the key vendors in the Industrial Heat Recovery Systems market.

APAC will register the highest growth rate of 47.1% among the other regions. Therefore, the Industrial Heat Recovery Systems market in APAC is expected to garner significant business opportunities for the vendors during the forecast period.

China, Japan, India, South Korea, Australia, Indonesia, US, Canada, Mexico, Germany, Italy, France, UK, Spain, The Netherlands, Brazil, Argentina, Colombia, Saudi Arabia, UAE, South Africa, Israel, Turkey

  • Accelerating decarbonization initiatives and regulatory compliance is the driving factor this market.

The Industrial Heat Recovery Systems market vendors should focus on grabbing business opportunities from the Application segment as it accounted for the largest market share in the base year.
RIA - Research AI Assistant
Ask RIA