Power Generation Market Analysis APAC, North America, Europe, Middle East and Africa, South America - China, US, India, Japan, Germany, South Korea, Australia, France, Brazil, UK - Size and Forecast 2025-2029

Power Generation Market Analysis APAC, North America, Europe, Middle East and Africa, South America - China, US, India, Japan, Germany, South Korea, Australia, France, Brazil, UK - Size and Forecast 2025-2029

Published: Jan 2025 213 Pages SKU: IRTNTR80532

Market Overview at a Glance

$462.8 B
Market Opportunity
4.7%
CAGR
4.6
YoY growth 2024-2025(%)

Power Generation Market Size 2025-2029

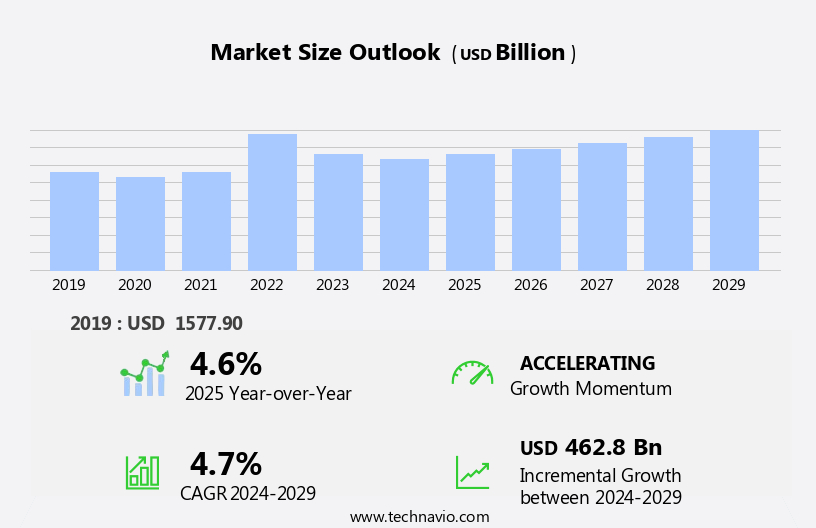
The power generation market size is forecast to increase by USD 462.8 billion, at a CAGR of 4.7% between 2024 and 2029.

  • The market is experiencing significant growth due to the increasing energy consumption across various industries and sectors. This trend is driving the demand for reliable and efficient power generation solutions. Strategic alliances and partnerships are becoming increasingly prevalent in the market as companies seek to expand their reach and enhance their offerings. Renewable energy sources, such as solar, wind, and hydroelectric power, are gaining popularity due to their environmental benefits and decreasing costs. However, the market faces challenges as well. The high capital expenditures required for the development and implementation of new power generation technologies can be a significant barrier to entry for some companies.
  • Additionally, regulatory frameworks and environmental concerns are becoming more stringent, requiring power generation companies to invest in technologies that meet these requirements. Gas turbines, coal-fired power plants, and nuclear power stations continue to dominate the market, but renewable energy sources are gaining ground. Solar photovoltaic and wind power are expected to see significant growth due to their decreasing costs and increasing efficiency. Energy storage solutions, such as batteries and pumped hydroelectric storage, are also becoming increasingly important as renewable energy sources become more intermittent. In conclusion, the market is experiencing significant growth due to increasing energy consumption and the popularity of renewable energy sources.
  • However, high capital expenditures and regulatory requirements present challenges for companies seeking to capitalize on market opportunities. Strategic alliances and partnerships, as well as investments in renewable energy and energy storage technologies, are key strategies for companies looking to navigate these challenges and succeed in the market.

What will be the Size of the Power Generation Market during the forecast period?

Power Generation Market Size

 Request Free Sample

The market continues to evolve, shaped by dynamic market forces and technological advancements. Energy storage solutions are increasingly integrated into the grid, enhancing power system stability and facilitating the integration of renewable energy sources. Simultaneously, energy efficiency initiatives are gaining traction, driving demand for building energy management systems and smart grid technologies. Fuel sourcing strategies are undergoing transformations, with a growing emphasis on distributed energy resources and the adoption of fuel cells. The power sector is also grappling with the complexities of power plant regulation, safety, and design, as well as the need for remote monitoring and performance monitoring to ensure reliability standards.

The integration of renewable energy sources, such as solar photovoltaic, wind turbines, and geothermal power, presents both opportunities and challenges. Emissions reduction targets and environmental regulations are shaping the power landscape, with a focus on power plant optimization, power electronics, and machine learning to improve efficiency and reduce carbon footprints. Electricity markets are undergoing significant changes, with wholesale pricing and demand response programs becoming increasingly important. Construction management, project financing, and capacity expansion are crucial elements in the power sector, requiring careful planning and execution. The Internet of Things (IoT) is revolutionizing power plant automation, enabling real-time data analysis and improving grid resilience.

Biomass power and hydroelectric power continue to play important roles in the energy mix, while power transformers and energy management systems are essential components in ensuring a reliable and efficient power supply. Power plant safety and environmental compliance remain top priorities, with ongoing efforts to improve power plant design, operations, and maintenance practices. The power sector's continuous dynamism underscores the need for innovation and adaptability in meeting the evolving energy demands of various sectors.

How is this Power Generation Industry segmented?

The power generation industry research report provides comprehensive data (region-wise segment analysis), with forecasts and estimates in "USD billion" for the period 2025-2029, as well as historical data from 2019-2023 for the following segments.

  • Type
    • Fossil fuel
    • Renewable energy
    • Nuclear power
  • End-user
    • Industrial
    • Residential
    • Commercial
    • Utilities
  • Geography
    • North America
      • US
    • Europe
      • France
      • Germany
      • UK
    • APAC
      • Australia
      • China
      • India
      • Japan
      • South Korea
    • South America
      • Brazil
    • Rest of World (ROW)

    By Type Insights

    The fossil fuel segment is estimated to witness significant growth during the forecast period.

    Fossil fuel-based power generation continues to dominate the global electricity market, with coal, natural gas, and oil-fired power plants providing a reliable and established source of base-load power. In 2023, coal demand experienced a slight yet notable increase of 1.4%, reaching an unprecedented peak of approximately 8,536 million tonnes. China led this growth with a significant surge of 220 million tonnes, highlighting its continued reliance on coal. However, the transition towards renewable energy sources is gaining momentum. Solar photovoltaic and wind power are increasingly becoming cost-competitive, with solar PV installations reaching a record high of 181 GW in 2022.

    Distributed energy resources, such as fuel cells and biomass power, are also gaining traction, contributing to a more decentralized and diverse electricity mix. Smart grid technologies, such as demand response and energy storage, are enhancing the integration of renewable energy into the grid, ensuring power system stability and improving overall grid efficiency. Building energy management systems and industrial energy management are optimizing energy usage, reducing emissions, and improving operational efficiency. Power plant automation, design, and remote monitoring are essential for maintaining performance and ensuring reliability, while adhering to stringent environmental regulations. Fuel sourcing and capacity expansion remain critical considerations for power plant operators, with natural gas emerging as a popular choice due to its lower carbon intensity compared to coal.

    Capacity expansion through the addition of new power plants and upgrades to existing facilities is essential to meet the growing demand for electricity. Power transformers and high-voltage transmission lines are crucial components of the power grid, ensuring efficient and reliable electricity transmission. The power sector is undergoing a significant transformation, with grid modernization and power plant optimization at the forefront. Power electronics, artificial intelligence, machine learning, and the Internet of Things are revolutionizing the way power is generated, distributed, and consumed. Renewable energy integration, emissions reduction, and power plant safety are key priorities, with a focus on sustainability, reliability, and efficiency.

    Power Generation Market Size

    Request Free Sample

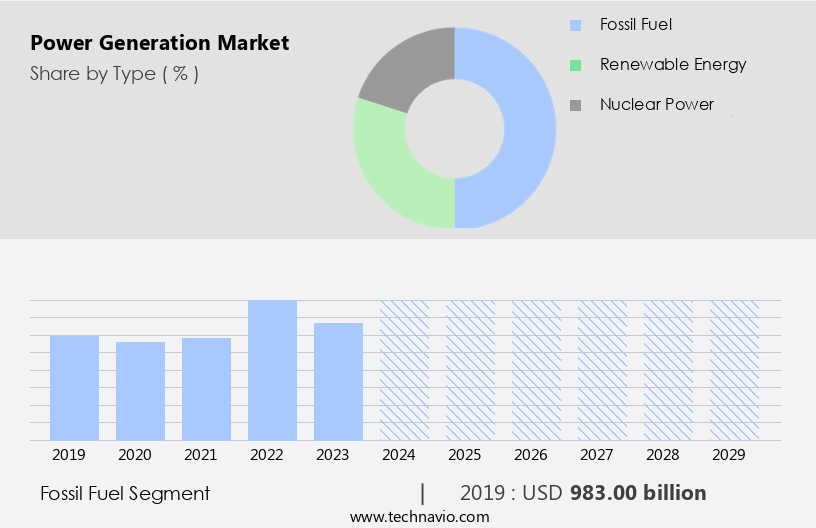
    The Fossil fuel segment was valued at USD 983.00 billion in 2019 and showed a gradual increase during the forecast period.

    Regional Analysis

    APAC is estimated to contribute 58% to the growth of the global market during the forecast period.Technavio’s analysts have elaborately explained the regional trends and drivers that shape the market during the forecast period.

    Power Generation Market Share by Geography

     Request Free Sample

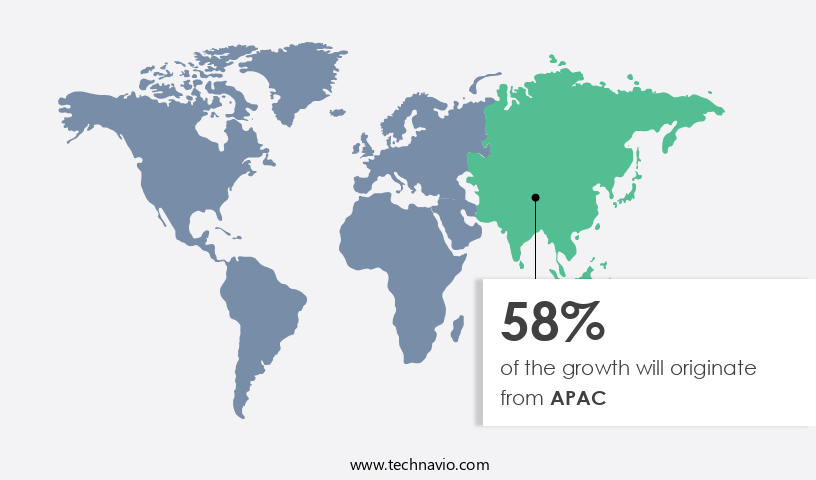
    The Asia-Pacific the market is experiencing significant growth due to the region's population growth and rapid industrialization. With over 4.6 billion people, representing approximately 60% of the global population, the demand for electricity in this area is substantial. Key players, including China, India, Japan, South Korea, and Indonesia, are leading both energy consumption and production. As these economies continue to expand, particularly in India and Southeast Asia, the pressure on existing energy infrastructure increases. China, the world's largest consumer and producer of electricity, plays a crucial role in the regional the market. Renewable energy sources, such as solar photovoltaic and wind turbines, are increasingly being integrated into power systems to reduce emissions and improve power system stability.

    Distributed energy resources, including fuel cells and energy storage, are also gaining popularity for their ability to enhance energy efficiency and reliability. Smart grid technologies, such as remote monitoring and performance monitoring, are essential for managing the increasing complexity of power systems. Building energy management and industrial energy management systems are being adopted to optimize energy usage and reduce costs. Construction management and project financing are critical components of capacity expansion and power plant design and automation. Environmental compliance and regulations are driving the adoption of cleaner energy sources and advanced power plant safety measures. Power electronics, machine learning, and artificial intelligence are being used to optimize power plant performance and improve grid modernization.

    High-voltage transmission and energy storage are essential for transmitting and distributing electricity efficiently and reliably. Fuel sourcing remains a critical consideration, with natural gas, coal, and biomass power continuing to dominate the market. Hydroelectric power and geothermal power are also significant contributors to the region's energy mix. Demand response and electricity markets are essential for managing electricity supply and demand effectively. Grid resilience and operations and maintenance are crucial for ensuring the reliability and stability of power systems.

    Market Dynamics

    Our researchers analyzed the data with 2024 as the base year, along with the key drivers, trends, and challenges. A holistic analysis of drivers will help companies refine their marketing strategies to gain a competitive advantage.

    What are the key market drivers leading to the rise in the adoption of Power Generation Industry?

    • The primary factor fueling market growth is the rising energy consumption. With the increasing demand for power in various sectors, businesses and industries are expanding their energy consumption, thereby driving market expansion. 

    • The market is experiencing significant growth due to the increasing global population and urbanization, leading to a surging demand for electricity. In 2023, approximately 56% of the world's population, or 4.4 billion people, resided in urban areas, and this trend is projected to continue, with the urban population expected to more than double by 2050. This urbanization and the subsequent population growth will result in nearly 70% of the global population living in cities, driving the demand for electricity. In 2023, global electricity demand grew by around 2.2%, and it is anticipated to increase at a faster pace, with an average annual growth rate of approximately 3%.
    • To meet this growing demand, various technologies and strategies are being employed. Project financing is a popular approach for financing power generation projects, enabling the development of new capacity. Grid modernization is another key trend, with the integration of advanced technologies such as power electronics, machine learning, and energy management systems to optimize power plant performance and improve environmental compliance with regulations. Geothermal power is gaining traction as a renewable energy source, while capacity expansion and the use of advanced technologies like gas turbines and power transformers are also crucial for meeting the increasing demand for electricity.
    • Environmental regulations continue to play a significant role in the market, driving the adoption of cleaner technologies and strategies to reduce carbon emissions.

    What are the market trends shaping the Power Generation Industry?

    • Strategic alliances and partnerships have emerged as a significant market trend. By forming collaborations with other businesses or organizations, companies can expand their reach, share resources, and leverage each other's expertise to drive growth and innovation.

    • The market is witnessing significant growth, driven by strategic alliances and partnerships that foster innovation and expansion in renewable energy projects. These collaborations enable companies to leverage each other's strengths, share risks, and accelerate the deployment of advanced technologies. For instance, on February 20, 2024, San Bernardino Ocean Power, a subsidiary of Energies PH, partnered with Inyanga Marine Energy to construct the first tidal power plant in Southeast Asia off Capul Island, Philippines. Utilizing Inyanga's HydroWing tidal technology, the plant will provide a sustainable 1 MW capacity, significantly enhancing the local electricity supply, which currently depends on a 750 KW diesel plant.
    • Energy efficiency, biomass power, hydroelectric power, and energy storage are key areas of focus in the power generation sector. The integration of the Internet of Things (IoT) and demand response programs is enhancing grid resilience and improving operations and maintenance. Power plant safety remains a top priority, with companies investing in advanced technologies to ensure reliable and efficient power generation. Electricity markets continue to evolve, with an increasing focus on renewable energy sources and sustainable energy solutions. Overall, the market is dynamic and innovative, with companies constantly seeking new ways to meet the growing demand for energy while minimizing environmental impact.

    What challenges does the Power Generation Industry face during its growth?

    • The significant capital expenditures required within the industry represent a major challenge to its growth. In order to expand and remain competitive, companies must invest heavily in new equipment, technology, and infrastructure. This capital-intensive environment poses a significant hurdle for businesses, particularly those with limited resources. However, those able to successfully navigate these financial challenges will be well-positioned to drive industry growth and gain a competitive advantage. 

    • The market faces significant challenges due to high capital costs, which can hinder the expansion and modernization of power infrastructure. The investment needed for constructing new power plants, upgrading existing facilities, or implementing advanced technologies can be substantial, particularly for large-scale projects such as nuclear power plants, offshore wind farms, and solar power plants. These projects often require billions of dollars in upfront capital, making them a considerable financial undertaking, especially for emerging markets or companies with limited access to financing. For example, the cost of building a nuclear power plant ranges from USD6 billion to USD9 billion, depending on the location and regulatory requirements.
    • Recently, EDF announced a delay in the UK's Hinkley Point C nuclear power plant, with the revised operational date being 2030 and a revised cost estimate between USD38 billion and USD40 billion. To mitigate these costs and improve overall efficiency, power generation companies are increasingly adopting data analytics, retail electricity pricing, building energy management, smart grid technologies, fuel sourcing, distributed energy resources, high-voltage transmission, construction management, performance monitoring, reliability standards, and solar photovoltaic systems. These technologies can help reduce emissions, optimize energy usage, and improve the overall reliability and efficiency of power generation systems.

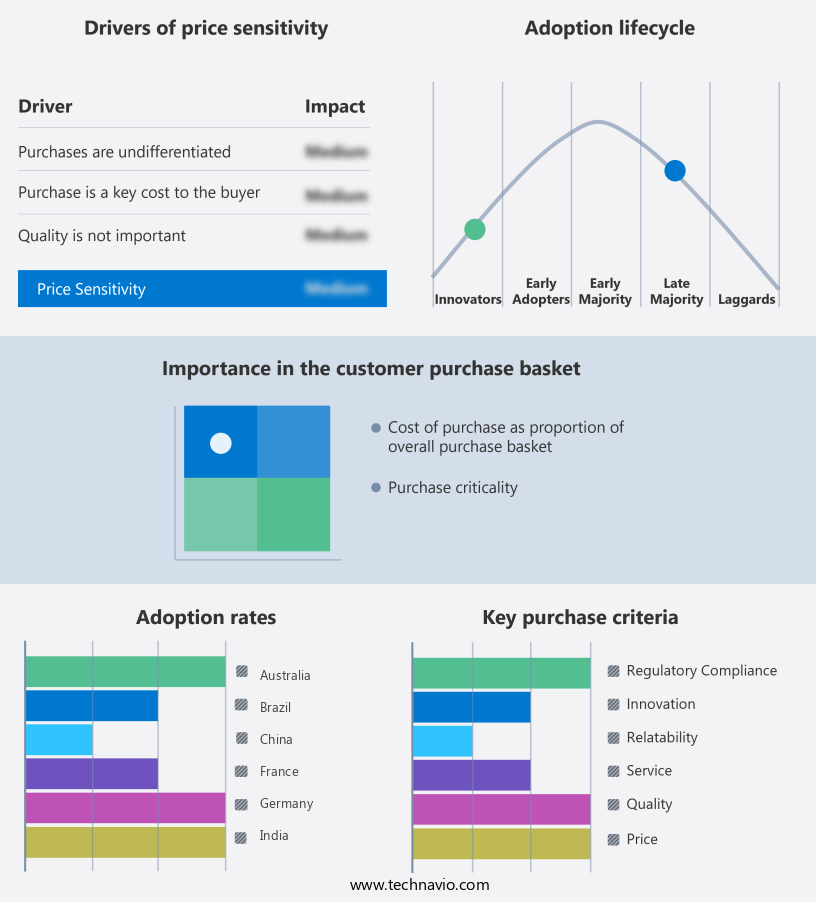
    Exclusive Customer Landscape

    The power generation market forecasting report includes the adoption lifecycle of the market, covering from the innovator’s stage to the laggard’s stage. It focuses on adoption rates in different regions based on penetration. Furthermore, the power generation market report also includes key purchase criteria and drivers of price sensitivity to help companies evaluate and develop their market growth analysis strategies.

    Power Generation Market Share by Geography

     Customer Landscape

    Key Companies & Market Insights

    Companies are implementing various strategies, such as strategic alliances, power generation market forecast, partnerships, mergers and acquisitions, geographical expansion, and product/service launches, to enhance their presence in the industry.

    Acwa Power Co. - This company specializes in advanced power generation technologies, focusing on the development and implementation of clean coal power stations. Employing sophisticated emission control systems, these stations minimize the release of carbon dioxide (CO2) and other greenhouse gases, ensuring environmental sustainability in power production. By integrating innovative clean coal technologies, the company contributes to the global shift towards reduced carbon emissions and a more sustainable energy future.

    The industry research and growth report includes detailed analyses of the competitive landscape of the market and information about key companies, including:

    • Acwa Power Co.
    • American Electric Power Co. Inc.
    • CHN ENERGY Investment Group Co. LTD.
    • Constellation Energy Corp.
    • Duke Energy Corp.
    • E.ON SE
    • Enel Spa
    • ENGIE SA
    • Fortum Oyj
    • Hitachi Ltd.
    • Iberdrola SA
    • National Grid plc
    • Nextera Energy Inc.
    • PG and E Corp.
    • RWE AG
    • Schneider Electric SE
    • Siemens
    • Southern Co.
    • Toshiba Corp.

    Qualitative and quantitative analysis of companies has been conducted to help clients understand the wider business environment as well as the strengths and weaknesses of key industry players. Data is qualitatively analyzed to categorize companies as pure play, category-focused, industry-focused, and diversified; it is quantitatively analyzed to categorize companies as dominant, leading, strong, tentative, and weak.

    Recent Development and News in Power Generation Market

    • In February 2024, Siemens Gamesa Renewable Energy, a leading wind turbine manufacturer, unveiled its new SG 14-222 DD offshore wind turbine, which boasts a capacity of 14.2 MW, making it one of the most powerful wind turbines globally (Siemens Gamesa Renewable Energy press release, 2024). This technological advancement underscores the company's commitment to driving innovation in the renewable energy sector.
    • In March 2025, General Electric (GE) and Vestas Wind Systems, two major players in the market, announced a strategic collaboration to combine their renewable energy businesses, creating a global leader in wind energy (Reuters, 2025). This merger aims to strengthen their market position and enhance their competitive edge in the rapidly growing renewable energy sector.
    • In May 2024, the European Union (EU) unveiled the REPowerEU Plan, an initiative to accelerate the EU's transition to renewable energy sources and reduce dependence on Russian fossil fuels (European Commission press release, 2024). The plan includes ambitious targets for increasing renewable energy capacity and phasing out coal, signaling a significant policy shift in the European power generation landscape.
    • In July 2025, SoftBank Energy, a subsidiary of SoftBank Group, announced a strategic investment of USD2 billion in Indian renewable energy company, ReNew Power (Bloomberg, 2025). This investment will help ReNew Power expand its renewable energy portfolio and further establish itself as a key player in the Indian the market.

    Research Analyst Overview

    • The market encompasses various technologies, including nuclear power plants, gas-fired and coal-fired power plants. Nuclear and thermal energy storage systems, such as flywheel and pumped hydro, play crucial roles in ensuring power system stability. Power quality concerns, like voltage sags and swells, are addressed through relay protection, circuit breakers, and power factor correction. Power plant decommissioning poses challenges, necessitating advanced power system analysis, fault analysis, and transient stability assessment. Renewable energy integration demands grid-scale energy storage and SCADA systems for effective power system control. Energy conservation and carbon offsetting are key trends, driving the adoption of distributed control systems and energy audits.
    • Harmonic distortion and voltage sag issues in power systems require sophisticated power system protection and analysis solutions. The market is witnessing increasing focus on renewable energy credits and the integration of renewable energy sources into the grid. Overall, the power generation landscape is characterized by continuous innovation and the pursuit of sustainable, efficient, and reliable energy solutions.

    Dive into Technavio’s robust research methodology, blending expert interviews, extensive data synthesis, and validated models for unparalleled Power Generation Market insights. See full methodology.

    Market Scope

    Report Coverage

    Details

    Page number

    213

    Base year

    2024

    Historic period

    2019-2023

    Forecast period

    2025-2029

    Growth momentum & CAGR

    Accelerate at a CAGR of 4.7%

    Market growth 2025-2029

    USD 462.8 billion

    Market structure

    Fragmented

    YoY growth 2024-2025(%)

    4.6

    Key countries

    China, US, India, Japan, Germany, South Korea, Australia, France, Brazil, and UK

    Competitive landscape

    Leading Companies, Market Positioning of Companies, Competitive Strategies, and Industry Risks

    Request Free Sample

    What are the Key Data Covered in this Power Generation Market Research and Growth Report?

    • CAGR of the Power Generation industry during the forecast period
    • Detailed information on factors that will drive the growth and forecasting between 2025 and 2029
    • Precise estimation of the size of the market and its contribution of the industry in focus to the parent market
    • Accurate predictions about upcoming growth and trends and changes in consumer behaviour
    • Growth of the market across APAC, North America, Europe, Middle East and Africa, and South America
    • Thorough analysis of the market’s competitive landscape and detailed information about companies
    • Comprehensive analysis of factors that will challenge the power generation market growth of industry companies

    We can help! Our analysts can customize this power generation market research report to meet your requirements.

    Get in touch


    1 Executive Summary

    • 1.1 Market overview
      • Executive Summary - Chart on Market Overview
      • Executive Summary - Data Table on Market Overview
      • Executive Summary - Chart on Global Market Characteristics
      • Executive Summary - Chart on Market by Geography
      • Executive Summary - Chart on Market Segmentation by Type
      • Executive Summary - Chart on Market Segmentation by End-user
      • Executive Summary - Chart on Incremental Growth
      • Executive Summary - Data Table on Incremental Growth
      • Executive Summary - Chart on Company Market Positioning

    2 Technavio Analysis

    • 2.1 Analysis of price sensitivity, lifecycle, customer purchase basket, adoption rates, and purchase criteria
      • Analysis of price sensitivity, lifecycle, customer purchase basket, adoption rates, and purchase criteria
    • 2.2 Criticality of inputs and Factors of differentiation
      • Overview on criticality of inputs and factors of differentiation
    • 2.3 Factors of disruption
      • Overview on factors of disruption
    • 2.4 Impact of drivers and challenges
      • Impact of drivers and challenges in 2024 and 2029

    3 Market Landscape

    • 3.1 Market ecosystem
      • Parent Market
      • Data Table on - Parent Market
    • 3.2 Market characteristics
      • Market characteristics analysis
    • 3.3 Value chain analysis
      • Value chain analysis

    4 Market Sizing

    • 4.1 Market definition
      • Offerings of companies included in the market definition
    • 4.2 Market segment analysis
      • Market segments
    • 4.3 Market size 2024
      • 4.4 Market outlook: Forecast for 2024-2029
        • Chart on Global - Market size and forecast 2024-2029 ($ billion)
        • Data Table on Global - Market size and forecast 2024-2029 ($ billion)
        • Chart on Global Market: Year-over-year growth 2024-2029 (%)
        • Data Table on Global Market: Year-over-year growth 2024-2029 (%)

      5 Historic Market Size

      • 5.1 Global Power Generation Market 2019 - 2023
        • Historic Market Size - Data Table on Global Power Generation Market 2019 - 2023 ($ billion)
      • 5.2 Type segment analysis 2019 - 2023
        • Historic Market Size - Type Segment 2019 - 2023 ($ billion)
      • 5.3 End-user segment analysis 2019 - 2023
        • Historic Market Size - End-user Segment 2019 - 2023 ($ billion)
      • 5.4 Geography segment analysis 2019 - 2023
        • Historic Market Size - Geography Segment 2019 - 2023 ($ billion)
      • 5.5 Country segment analysis 2019 - 2023
        • Historic Market Size - Country Segment 2019 - 2023 ($ billion)

      6 Qualitative Analysis

      • 6.1 Impact of AI on Global Power Generation Market

        7 Five Forces Analysis

        • 7.1 Five forces summary
          • Five forces analysis - Comparison between 2024 and 2029
        • 7.2 Bargaining power of buyers
          • Bargaining power of buyers - Impact of key factors 2024 and 2029
        • 7.3 Bargaining power of suppliers
          • Bargaining power of suppliers - Impact of key factors in 2024 and 2029
        • 7.4 Threat of new entrants
          • Threat of new entrants - Impact of key factors in 2024 and 2029
        • 7.5 Threat of substitutes
          • Threat of substitutes - Impact of key factors in 2024 and 2029
        • 7.6 Threat of rivalry
          • Threat of rivalry - Impact of key factors in 2024 and 2029
        • 7.7 Market condition
          • Chart on Market condition - Five forces 2024 and 2029

        8 Market Segmentation by Type

        • 8.1 Market segments
          • Chart on Type - Market share 2024-2029 (%)
          • Data Table on Type - Market share 2024-2029 (%)
        • 8.2 Comparison by Type
          • Chart on Comparison by Type
          • Data Table on Comparison by Type
        • 8.3 Fossil fuel - Market size and forecast 2024-2029
          • Chart on Fossil fuel - Market size and forecast 2024-2029 ($ billion)
          • Data Table on Fossil fuel - Market size and forecast 2024-2029 ($ billion)
          • Chart on Fossil fuel - Year-over-year growth 2024-2029 (%)
          • Data Table on Fossil fuel - Year-over-year growth 2024-2029 (%)
        • 8.4 Renewable energy - Market size and forecast 2024-2029
          • Chart on Renewable energy - Market size and forecast 2024-2029 ($ billion)
          • Data Table on Renewable energy - Market size and forecast 2024-2029 ($ billion)
          • Chart on Renewable energy - Year-over-year growth 2024-2029 (%)
          • Data Table on Renewable energy - Year-over-year growth 2024-2029 (%)
        • 8.5 Nuclear power - Market size and forecast 2024-2029
          • Chart on Nuclear power - Market size and forecast 2024-2029 ($ billion)
          • Data Table on Nuclear power - Market size and forecast 2024-2029 ($ billion)
          • Chart on Nuclear power - Year-over-year growth 2024-2029 (%)
          • Data Table on Nuclear power - Year-over-year growth 2024-2029 (%)
        • 8.6 Market opportunity by Type
          • Market opportunity by Type ($ billion)
          • Data Table on Market opportunity by Type ($ billion)

        9 Market Segmentation by End-user

        • 9.1 Market segments
          • Chart on End-user - Market share 2024-2029 (%)
          • Data Table on End-user - Market share 2024-2029 (%)
        • 9.2 Comparison by End-user
          • Chart on Comparison by End-user
          • Data Table on Comparison by End-user
        • 9.3 Industrial - Market size and forecast 2024-2029
          • Chart on Industrial - Market size and forecast 2024-2029 ($ billion)
          • Data Table on Industrial - Market size and forecast 2024-2029 ($ billion)
          • Chart on Industrial - Year-over-year growth 2024-2029 (%)
          • Data Table on Industrial - Year-over-year growth 2024-2029 (%)
        • 9.4 Residential - Market size and forecast 2024-2029
          • Chart on Residential - Market size and forecast 2024-2029 ($ billion)
          • Data Table on Residential - Market size and forecast 2024-2029 ($ billion)
          • Chart on Residential - Year-over-year growth 2024-2029 (%)
          • Data Table on Residential - Year-over-year growth 2024-2029 (%)
        • 9.5 Commercial - Market size and forecast 2024-2029
          • Chart on Commercial - Market size and forecast 2024-2029 ($ billion)
          • Data Table on Commercial - Market size and forecast 2024-2029 ($ billion)
          • Chart on Commercial - Year-over-year growth 2024-2029 (%)
          • Data Table on Commercial - Year-over-year growth 2024-2029 (%)
        • 9.6 Utilities - Market size and forecast 2024-2029
          • Chart on Utilities - Market size and forecast 2024-2029 ($ billion)
          • Data Table on Utilities - Market size and forecast 2024-2029 ($ billion)
          • Chart on Utilities - Year-over-year growth 2024-2029 (%)
          • Data Table on Utilities - Year-over-year growth 2024-2029 (%)
        • 9.7 Market opportunity by End-user
          • Market opportunity by End-user ($ billion)
          • Data Table on Market opportunity by End-user ($ billion)

        10 Customer Landscape

        • 10.1 Customer landscape overview
          • Analysis of price sensitivity, lifecycle, customer purchase basket, adoption rates, and purchase criteria

        11 Geographic Landscape

        • 11.1 Geographic segmentation
          • Chart on Market share by geography 2024-2029 (%)
          • Data Table on Market share by geography 2024-2029 (%)
        • 11.2 Geographic comparison
          • Chart on Geographic comparison
          • Data Table on Geographic comparison
        • 11.3 APAC - Market size and forecast 2024-2029
          • Chart on APAC - Market size and forecast 2024-2029 ($ billion)
          • Data Table on APAC - Market size and forecast 2024-2029 ($ billion)
          • Chart on APAC - Year-over-year growth 2024-2029 (%)
          • Data Table on APAC - Year-over-year growth 2024-2029 (%)
        • 11.4 North America - Market size and forecast 2024-2029
          • Chart on North America - Market size and forecast 2024-2029 ($ billion)
          • Data Table on North America - Market size and forecast 2024-2029 ($ billion)
          • Chart on North America - Year-over-year growth 2024-2029 (%)
          • Data Table on North America - Year-over-year growth 2024-2029 (%)
        • 11.5 Europe - Market size and forecast 2024-2029
          • Chart on Europe - Market size and forecast 2024-2029 ($ billion)
          • Data Table on Europe - Market size and forecast 2024-2029 ($ billion)
          • Chart on Europe - Year-over-year growth 2024-2029 (%)
          • Data Table on Europe - Year-over-year growth 2024-2029 (%)
        • 11.6 Middle East and Africa - Market size and forecast 2024-2029
          • Chart on Middle East and Africa - Market size and forecast 2024-2029 ($ billion)
          • Data Table on Middle East and Africa - Market size and forecast 2024-2029 ($ billion)
          • Chart on Middle East and Africa - Year-over-year growth 2024-2029 (%)
          • Data Table on Middle East and Africa - Year-over-year growth 2024-2029 (%)
        • 11.7 South America - Market size and forecast 2024-2029
          • Chart on South America - Market size and forecast 2024-2029 ($ billion)
          • Data Table on South America - Market size and forecast 2024-2029 ($ billion)
          • Chart on South America - Year-over-year growth 2024-2029 (%)
          • Data Table on South America - Year-over-year growth 2024-2029 (%)
        • 11.8 China - Market size and forecast 2024-2029
          • Chart on China - Market size and forecast 2024-2029 ($ billion)
          • Data Table on China - Market size and forecast 2024-2029 ($ billion)
          • Chart on China - Year-over-year growth 2024-2029 (%)
          • Data Table on China - Year-over-year growth 2024-2029 (%)
        • 11.9 US - Market size and forecast 2024-2029
          • Chart on US - Market size and forecast 2024-2029 ($ billion)
          • Data Table on US - Market size and forecast 2024-2029 ($ billion)
          • Chart on US - Year-over-year growth 2024-2029 (%)
          • Data Table on US - Year-over-year growth 2024-2029 (%)
        • 11.10 India - Market size and forecast 2024-2029
          • Chart on India - Market size and forecast 2024-2029 ($ billion)
          • Data Table on India - Market size and forecast 2024-2029 ($ billion)
          • Chart on India - Year-over-year growth 2024-2029 (%)
          • Data Table on India - Year-over-year growth 2024-2029 (%)
        • 11.11 Japan - Market size and forecast 2024-2029
          • Chart on Japan - Market size and forecast 2024-2029 ($ billion)
          • Data Table on Japan - Market size and forecast 2024-2029 ($ billion)
          • Chart on Japan - Year-over-year growth 2024-2029 (%)
          • Data Table on Japan - Year-over-year growth 2024-2029 (%)
        • 11.12 Germany - Market size and forecast 2024-2029
          • Chart on Germany - Market size and forecast 2024-2029 ($ billion)
          • Data Table on Germany - Market size and forecast 2024-2029 ($ billion)
          • Chart on Germany - Year-over-year growth 2024-2029 (%)
          • Data Table on Germany - Year-over-year growth 2024-2029 (%)
        • 11.13 South Korea - Market size and forecast 2024-2029
          • Chart on South Korea - Market size and forecast 2024-2029 ($ billion)
          • Data Table on South Korea - Market size and forecast 2024-2029 ($ billion)
          • Chart on South Korea - Year-over-year growth 2024-2029 (%)
          • Data Table on South Korea - Year-over-year growth 2024-2029 (%)
        • 11.14 Australia - Market size and forecast 2024-2029
          • Chart on Australia - Market size and forecast 2024-2029 ($ billion)
          • Data Table on Australia - Market size and forecast 2024-2029 ($ billion)
          • Chart on Australia - Year-over-year growth 2024-2029 (%)
          • Data Table on Australia - Year-over-year growth 2024-2029 (%)
        • 11.15 France - Market size and forecast 2024-2029
          • Chart on France - Market size and forecast 2024-2029 ($ billion)
          • Data Table on France - Market size and forecast 2024-2029 ($ billion)
          • Chart on France - Year-over-year growth 2024-2029 (%)
          • Data Table on France - Year-over-year growth 2024-2029 (%)
        • 11.16 Brazil - Market size and forecast 2024-2029
          • Chart on Brazil - Market size and forecast 2024-2029 ($ billion)
          • Data Table on Brazil - Market size and forecast 2024-2029 ($ billion)
          • Chart on Brazil - Year-over-year growth 2024-2029 (%)
          • Data Table on Brazil - Year-over-year growth 2024-2029 (%)
        • 11.17 UK - Market size and forecast 2024-2029
          • Chart on UK - Market size and forecast 2024-2029 ($ billion)
          • Data Table on UK - Market size and forecast 2024-2029 ($ billion)
          • Chart on UK - Year-over-year growth 2024-2029 (%)
          • Data Table on UK - Year-over-year growth 2024-2029 (%)
        • 11.18 Market opportunity by geography
          • Market opportunity by geography ($ billion)
          • Data Tables on Market opportunity by geography ($ billion)

        12 Drivers, Challenges, and Opportunity/Restraints

        • 12.1 Market drivers
          • 12.2 Market challenges
            • 12.3 Impact of drivers and challenges
              • Impact of drivers and challenges in 2024 and 2029
            • 12.4 Market opportunities/restraints

              13 Competitive Landscape

              • 13.1 Overview
                • 13.2 Competitive Landscape
                  • Overview on criticality of inputs and factors of differentiation
                • 13.3 Landscape disruption
                  • Overview on factors of disruption
                • 13.4 Industry risks
                  • Impact of key risks on business

                14 Competitive Analysis

                • 14.1 Companies profiled
                  • Companies covered
                • 14.2 Company ranking index
                  • Company ranking index
                • 14.3 Market positioning of companies
                  • Matrix on companies position and classification
                • 14.4 Acwa Power Co.
                  • Acwa Power Co. - Overview
                  • Acwa Power Co. - Product / Service
                  • Acwa Power Co. - Key offerings
                  • SWOT
                • 14.5 American Electric Power Co. Inc.
                  • American Electric Power Co. Inc. - Overview
                  • American Electric Power Co. Inc. - Business segments
                  • American Electric Power Co. Inc. - Key offerings
                  • American Electric Power Co. Inc. - Segment focus
                  • SWOT
                • 14.6 Constellation Energy Corp.
                  • Constellation Energy Corp. - Overview
                  • Constellation Energy Corp. - Business segments
                  • Constellation Energy Corp. - Key offerings
                  • Constellation Energy Corp. - Segment focus
                  • SWOT
                • 14.7 Duke Energy Corp.
                  • Duke Energy Corp. - Overview
                  • Duke Energy Corp. - Business segments
                  • Duke Energy Corp. - Key offerings
                  • Duke Energy Corp. - Segment focus
                  • SWOT
                • 14.8 E.ON SE
                  • E.ON SE - Overview
                  • E.ON SE - Business segments
                  • E.ON SE - Key offerings
                  • E.ON SE - Segment focus
                  • SWOT
                • 14.9 Enel Spa
                  • Enel Spa - Overview
                  • Enel Spa - Product / Service
                  • Enel Spa - Key news
                  • Enel Spa - Key offerings
                  • SWOT
                • 14.10 ENGIE SA
                  • ENGIE SA - Overview
                  • ENGIE SA - Business segments
                  • ENGIE SA - Key offerings
                  • ENGIE SA - Segment focus
                  • SWOT
                • 14.11 Fortum Oyj
                  • Fortum Oyj - Overview
                  • Fortum Oyj - Business segments
                  • Fortum Oyj - Key offerings
                  • Fortum Oyj - Segment focus
                  • SWOT
                • 14.12 Iberdrola SA
                  • Iberdrola SA - Overview
                  • Iberdrola SA - Business segments
                  • Iberdrola SA - Key offerings
                  • Iberdrola SA - Segment focus
                  • SWOT
                • 14.13 National Grid plc
                  • National Grid plc - Overview
                  • National Grid plc - Business segments
                  • National Grid plc - Key offerings
                  • National Grid plc - Segment focus
                  • SWOT
                • 14.14 Nextera Energy Inc.
                  • Nextera Energy Inc. - Overview
                  • Nextera Energy Inc. - Business segments
                  • Nextera Energy Inc. - Key offerings
                  • Nextera Energy Inc. - Segment focus
                  • SWOT
                • 14.15 PG and E Corp.
                  • PG and E Corp. - Overview
                  • PG and E Corp. - Product / Service
                  • PG and E Corp. - Key offerings
                  • SWOT
                • 14.16 Schneider Electric SE
                  • Schneider Electric SE - Overview
                  • Schneider Electric SE - Business segments
                  • Schneider Electric SE - Key news
                  • Schneider Electric SE - Key offerings
                  • Schneider Electric SE - Segment focus
                  • SWOT
                • 14.17 Siemens
                  • Siemens - Overview
                  • Siemens - Business segments
                  • Siemens - Key news
                  • Siemens - Key offerings
                  • Siemens - Segment focus
                  • SWOT
                • 14.18 Southern Co.
                  • Southern Co. - Overview
                  • Southern Co. - Business segments
                  • Southern Co. - Key offerings
                  • Southern Co. - Segment focus
                  • SWOT

                15 Appendix

                • 15.1 Scope of the report
                  • 15.2 Inclusions and exclusions checklist
                    • Inclusions checklist
                    • Exclusions checklist
                  • 15.3 Currency conversion rates for US$
                    • Currency conversion rates for US$
                  • 15.4 Research methodology
                    • Research methodology
                  • 15.5 Data procurement
                    • Information sources
                  • 15.6 Data validation
                    • Data validation
                  • 15.7 Validation techniques employed for market sizing
                    • Validation techniques employed for market sizing
                  • 15.8 Data synthesis
                    • Data synthesis
                  • 15.9 360 degree market analysis
                    • 360 degree market analysis
                  • 15.10 List of abbreviations
                    • List of abbreviations

                  Research Methodology

                  Technavio presents a detailed picture of the market by way of study, synthesis, and summation of data from multiple sources. The analysts have presented the various facets of the market with a particular focus on identifying the key industry influencers. The data thus presented is comprehensive, reliable, and the result of extensive research, both primary and secondary.

                  INFORMATION SOURCES

                  Primary sources

                  • Manufacturers and suppliers
                  • Channel partners
                  • Industry experts
                  • Strategic decision makers

                  Secondary sources

                  • Industry journals and periodicals
                  • Government data
                  • Financial reports of key industry players
                  • Historical data
                  • Press releases

                  DATA ANALYSIS

                  Data Synthesis

                  • Collation of data
                  • Estimation of key figures
                  • Analysis of derived insights

                  Data Validation

                  • Triangulation with data models
                  • Reference against proprietary databases
                  • Corroboration with industry experts

                  REPORT WRITING

                  Qualitative

                  • Market drivers
                  • Market challenges
                  • Market trends
                  • Five forces analysis

                  Quantitative

                  • Market size and forecast
                  • Market segmentation
                  • Geographical insights
                  • Competitive landscape

                  Interested in this report?

                  Get your sample now to see our research methodology and insights!

                  Download Now

                  Frequently Asked Questions

                  Power Generation market growth will increase by $ 462.8 bn during 2025-2029 .

                  The Power Generation market is expected to grow at a CAGR of 4.7% during 2025-2029 .

                  Power Generation market is segmented by Type( Fossil fuel, Renewable energy, Nuclear power) End-user( Industrial, Residential, Commercial, Utilities)

                  Acwa Power Co., American Electric Power Co. Inc., CHN ENERGY Investment Group Co. LTD., Constellation Energy Corp., Duke Energy Corp., E.ON SE, Enel Spa, ENGIE SA, Fortum Oyj, Hitachi Ltd., Iberdrola SA, National Grid plc, Nextera Energy Inc., PG and E Corp., RWE AG, Schneider Electric SE, Siemens, Southern Co., Toshiba Corp. are a few of the key vendors in the Power Generation market.

                  APAC will register the highest growth rate of 58% among the other regions. Therefore, the Power Generation market in APAC is expected to garner significant business opportunities for the vendors during the forecast period.

                  China, US, India, Japan, Germany, South Korea, Australia, France, Brazil, UK

                  • Increasing energy consumptionThe global power generation market is significantly driven by increasing energy consumption is the driving factor this market.
                  • a trend that is expected to continue in the coming years. In 2023 is the driving factor this market.
                  • approximately 56% of the worlds population is the driving factor this market.
                  • or 4.4 billion people is the driving factor this market.
                  • resided in urban areas. This urbanization trend is projected to persist is the driving factor this market.
                  • with the urban population expected to more than double by 2050 is the driving factor this market.
                  • resulting in nearly 70% of the global population living in cities. This rapid urbanization is a major factor contributing to the rising demand for electricity.In 2023 is the driving factor this market.
                  • global electricity demand grew by around 2.2%. Looking ahead is the driving factor this market.
                  • electricity demand is anticipated to increase at a faster pace is the driving factor this market.
                  • with an average annual growth rate of approximately 3.4% through 2026. This growth will be driven by an improving economic outlook is the driving factor this market.
                  • which will spur faster electricity demand growth in both advanced and emerging economies. In particular is the driving factor this market.
                  • advanced economies and China are expected to see significant increases in electricity demand is the driving factor this market.
                  • supported by the ongoing electrification of the residential and transport sectors is the driving factor this market.
                  • as well as the expansion of the data center sector.The share of electricity in final energy consumption reached an estimated 20% in 2023 is the driving factor this market.
                  • up from 18% in 2015. This increase reflects the growing reliance on electricity as a primary energy source. However is the driving factor this market.
                  • to meet global decarbonization targets is the driving factor this market.
                  • the pace of electrification needs to accelerate rapidly. The transition to electric vehicles is the driving factor this market.
                  • the adoption of electric heating and cooling systems is the driving factor this market.
                  • and the proliferation of digital technologies are all contributing to this shift.As the demand for electricity continues to rise is the driving factor this market.
                  • the power generation industry will need to expand its capacity and enhance its infrastructure to meet the growing needs of a rapidly urbanizing and technologically advancing world. is the driving factor this market.

                  The Power Generation market vendors should focus on grabbing business opportunities from the Fossil fuel segment as it accounted for the largest market share in the base year.