Industrial Sensors Market Analysis APAC, Europe, North America, Middle East and Africa, South America - US, China, Japan, Germany, France - Size and Forecast 2024-2028

Industrial Sensors Market Analysis APAC, Europe, North America, Middle East and Africa, South America - US, China, Japan, Germany, France - Size and Forecast 2024-2028

Published: Aug 2024 185 Pages SKU: IRTNTR70995

Market Overview at a Glance

$14.3 B
Market Opportunity
9.44%
CAGR
8.37
YoY growth 2023-2024(%)

Industrial Sensors Market Size 2024-2028

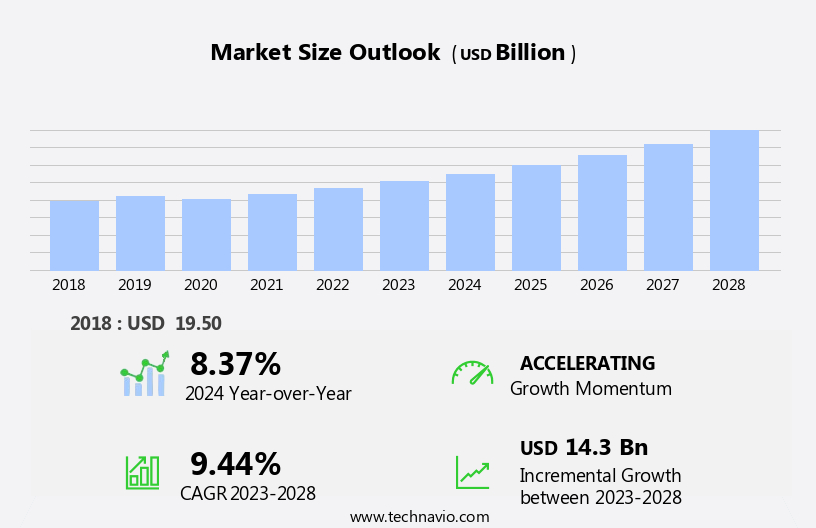
The industrial sensors market size is forecast to increase by USD 14.3 billion at a CAGR of 9.44% between 2023 and 2028.

  • The industrial sensors market is driven by the rise in demand for smart factories and the Industrial Internet of Things (IIoT), which require advanced sensing technologies for automation and real-time data collection. An emerging trend in the market is the increasing demand for sensors for remote monitoring. 
  • As industries move towards more automated and flexible operations, there is a growing need for sensors that can provide remote, real-time data on machinery, equipment, and environmental conditions to improve efficiency and safety. Sensors play a crucial role in these applications by enabling real-time monitoring and data collection. Additionally, the need for remote monitoring and predictive maintenance is leading to increased demand for sensors. 

What will be the Size of the Industrial Sensors Market During the Forecast Period?

Industrial Sensors Market Size

 Request Free Sample

  • The market is experiencing significant growth, driven by the increasing adoption of Internet of Things (IoT) technology and the demand for real-time data in various industries. Transparency and efficiency are key priorities for businesses seeking to improve profitability through predictive maintenance and automated machinery. Sensors play a crucial role in this trend, enabling condition monitoring of operational equipment and facilitating machine uptime. A diverse range of sensors are utilized in industrial applications, including level sensors, pressure sensors, image sensors, and various electronic devices. These sensors employ advanced technologies such as machine learning algorithms, platinum sensors, and IPX8 waterproofing. The market for industrial sensors is vast, encompassing various sectors and applications, from semiconductor manufacturing to storage corporations.
  • Sensing technology continues to evolve, with innovations in CMOS image sensors and the development of cost-effective facilities for mass production. The integration of IoT and advanced analytics enables more sophisticated data collection and analysis, enhancing the overall value proposition of industrial sensors. The market is expected to continue its upward trajectory, fueled by the ongoing digital transformation and the increasing importance of data-driven decision-making in industrial communities.

How is this Industrial Sensors Industry segmented and which is the largest segment?

The industrial sensors industry research report provides comprehensive data (region-wise segment analysis), with forecasts and estimates in "USD billion" for the period 2024-2028, as well as historical data from 2018-2022 for the following segments.

  • End-user
    • Process industries
    • Discrete industries
  • Product
    • Pressure
    • Temperature
    • Proximity
    • Flow
    • Others
  • Geography
    • APAC
      • China
      • Japan
    • Europe
      • Germany
      • France
    • North America
      • US
    • Middle East and Africa
    • South America

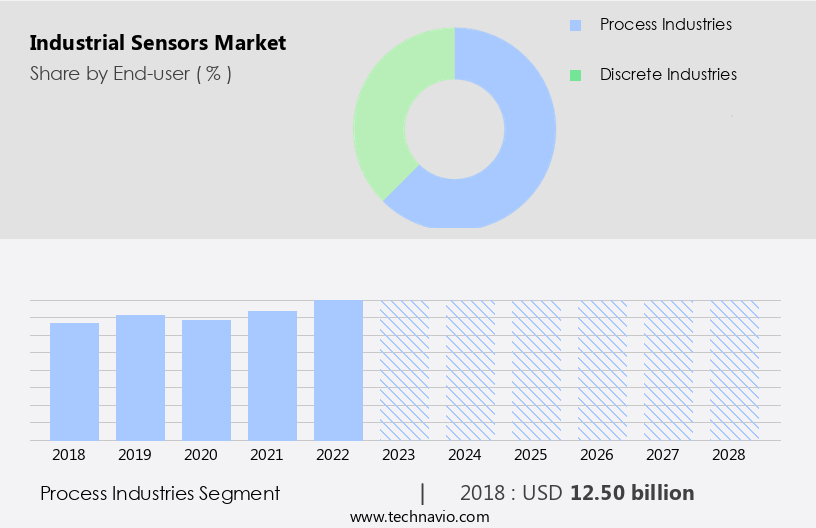
By End-user Insights

  • The process industries segment is estimated to witness significant growth during the forecast period.

Industrial sensors play a crucial role in process industries, including oil and gas, food and beverage, pharmaceuticals and healthcare, and water and wastewater treatment. In the oil and gas sector, sensors facilitate effective supply chain management, production optimization, and quality control, while ensuring minimal environmental impact. The integration of renewable energy sources and fossil fuels is a priority for industry players, making sensors essential for monitoring and managing energy production. Industrial sensors are utilized in process equipment, control units, storage management, logistics, and terminal automation. Real-time data generated from these sensors enhances operational efficiency, profitability, and predictive maintenance capabilities.

Machine learning algorithms and automated machinery enable condition monitoring, level sensors, pressure sensors, and temperature sensors provide precise process control and quality control. Infrastructure development in smart cities, renewable energy, and legacy machinery also benefits from the implementation of industrial sensors. Industrial sensors are integral to factory automation, enhancing machine uptime, industrial automation, and sensing technology. Data collection on manufacturing floors enables cost-effective facilities and improved industrial communities. Advanced software and connected devices enable remote sensing, monitoring capabilities, material sorting, inventory counting, and real-time pictures for quality inspection. Wireless connectivity and robotics further expand the capabilities of industrial sensors, facilitating liquid pressure measurement, monitoring vacuum pumps, and industrial process control.

Industrial Sensors Market Size

Get a glance at the Industrial Sensors Industry report of share of various segments Request Free Sample

The Process industries segment was valued at USD 12.50 billion in 2018 and showed a gradual increase during the forecast period.

Regional Analysis

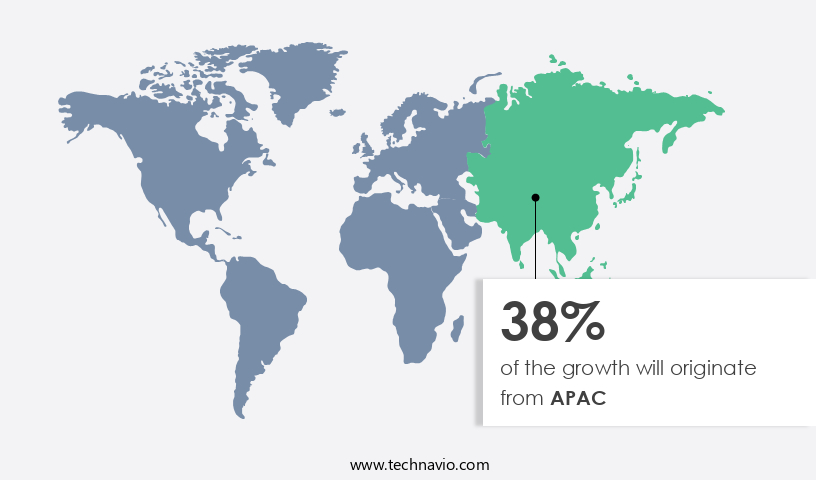
  • APAC is estimated to contribute 38% to the growth of the global market during the forecast period.

Technavio's analysts have elaborately explained the regional trends and drivers that shape the market during the forecast period.

Industrial Sensors Market Share by Geography

For more insights on the market share of various regions, Request Free Sample

The market in APAC is experiencing significant growth due to government initiatives, increasing automobile manufacturing, and the robust manufacturing sector. Key contributors to the global market include China, India, Japan, and South Korea. To address challenges such as outdated equipment, production instability, and reliance on manual labor, manufacturers are adopting automation. Countries like Japan, China, Taiwan, South Korea, Singapore, Thailand, Vietnam, and the Philippines are leading this trend, focusing on efficient processes for cleanliness and environmental control. Industrial sensors play a crucial role in various applications, including real-time data collection, transparency, predictive maintenance, and profitability. Technologies such as machine learning algorithms, pressure sensors, level sensors, process control, quality control, and image sensors are essential for advanced automation systems and industrial processes.

Additionally, infrastructure development in smart cities, renewable energy, and legacy machinery are further driving market growth. Wireless autonomous sensors, temperature sensors, motion sensors, and flow sensors are integral components of industrial automation, enabling machine uptime, cost-effective facilities, and improved productivity.

Market Dynamics

Our  researchers analyzed the data with 2023 as the base year, along with the key drivers, trends, and challenges. A holistic analysis of drivers will help companies refine their marketing strategies to gain a competitive advantage.

What are the key market drivers leading to the rise In the adoption of Industrial Sensors Industry?

Rise in demand for smart factories and IIoT is the key driver of the market.

  • The market is experiencing significant growth due to the increasing adoption of the Internet of Things (IoT) in factories worldwide. This trend is driven by the need for transparency, efficiency, and profitability in industrial processes. Industrial sensors play a crucial role in this transformation by providing real-time data for predictive maintenance, machine learning algorithms, and condition monitoring. These sensors are used in various applications, including level sensors, pressure sensors, image sensors, and motion sensors, among others. They enable automated machinery to perform tasks such as liquid pressure measurement, monitoring vacuum pumps, and detecting gas leakages. Additionally, sensors are used in quality control, process control, and inventory counting, ensuring machine uptime and optimizing operational equipment.
  • Infrastructure development in sectors such as smart cities, renewable energy, and legacy machinery also contributes to the market's growth. The integration of advanced automation systems, digital technologies, and connected devices enhances monitoring capabilities and improves productivity. Wireless connectivity and robotics applications further expand the market's scope. Overall, the market is expected to continue its growth trajectory, providing valuable insights and optimizing industrial processes.

What are the market trends shaping the Industrial Sensors Industry?

Increasing demand for sensors for remote monitoring is the upcoming market trend.

  • The market is experiencing significant growth due to the increasing adoption of Internet of Things (IoT) technology in various industries. Real-time data transparency, efficiency, profitability, and predictive maintenance are key drivers for this market. Machine learning algorithms and automated machinery are revolutionizing condition monitoring, level sensors, process control, and quality control. Infrastructure development in sectors such as smart cities, renewable energy, and industrial communities is also fueling the demand for advanced sensing technology. Legacy machinery in industries like manufacturing, factory automation, and operational equipment management can benefit from the integration of sensors for machine uptime improvement and industrial process optimization.
  • Pressure sensors, image sensors, and electronic devices are essential components in various applications, including liquid pressure measurement, monitoring vacuum pumps, and temperature sensing. Sensor technology plays a crucial role in monitoring potential anomalies and optimizing machine performance. Wireless autonomous sensors from companies like Hiber BV and Viezo enable remote sensing and monitoring capabilities for various industries. Predictive maintenance and high-accuracy asset tracking using advanced software and smart sensors are essential for reducing facility stoppages, false detection, and raw material wastage. Connected devices and digital technologies are transforming industrial processes by providing real-time pictures for quality inspection and wireless connectivity for robotics applications.
  • Liquid pressure measurement, gas leakages, flammable gases, ethanol, and breathalyzer tests are some of the applications where sensors play a vital role. Flow sensors, motion sensors, and proximity sensors help monitor changes in temperature, movements, and quantity, ensuring cost-effective facilities and increased productivity.

What challenges does the Industrial Sensors Industry face during its growth?

Growing challenges in delivering high quality at low cost is a key challenge affecting the industry growth.

  • Industrial sensors play a crucial role in enhancing the efficiency and profitability of industrial processes by providing real-time data for predictive maintenance and condition monitoring. The integration of Internet of Things (IoT) technology in industrial automation systems has led to the development of smart sensors, enabling transparency and improving machine performance. Machine learning algorithms and automated machinery utilize these sensors for level sensing, process control, quality control, and infrastructure development in various sectors such as smart cities, renewable energy, and legacy machinery. Sensor companies face the challenge of balancing cost-effectiveness with technological advancement, as customized sensors for specific industrial applications can be more expensive due to their advanced features.
  • However, the falling cost of off-the-shelf sensors has made industrial automation more accessible. Industrial sensors are essential for various applications, including pressure sensors, image sensors, and motion sensors, which monitor changes in temperature, movements, flow rates, and potential anomalies. These sensors are integrated into advanced automation systems to optimize machine uptime, reduce facility stoppages, and improve productivity. Industrial communities, including manufacturers, rely on these sensors for digital technologies, connected devices, and advanced software to ensure high-accuracy asset tracking, material sorting, inventory counting, and quality inspection. Wireless connectivity and robotics applications further enhance the capabilities of industrial sensors, enabling remote sensing and monitoring.

Exclusive Customer Landscape

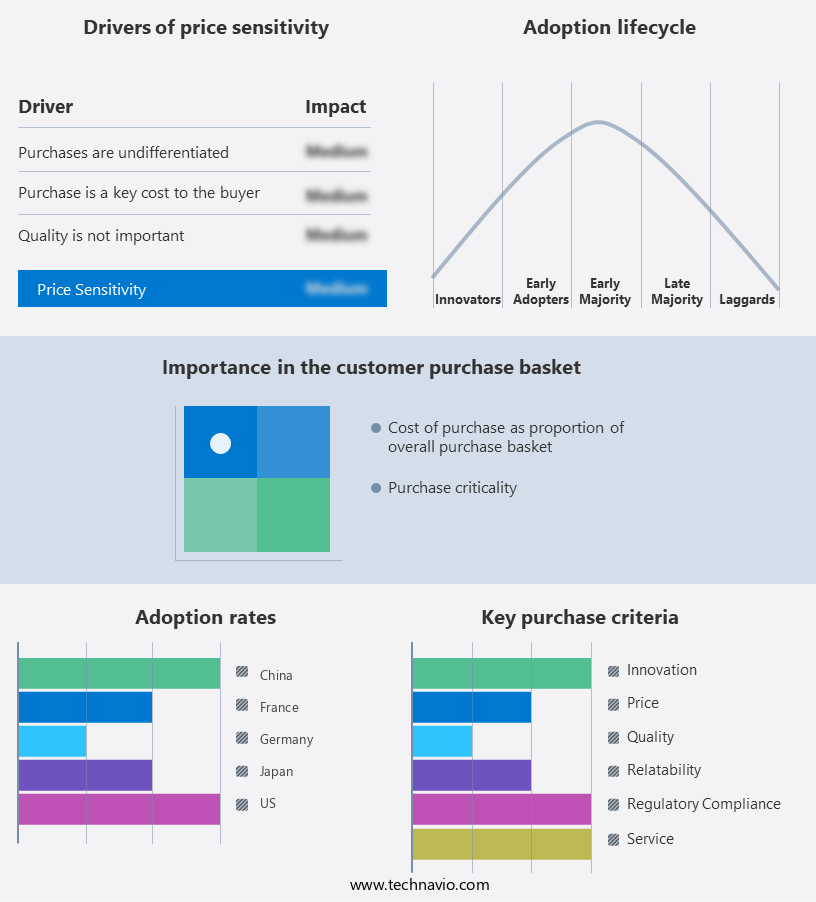
The industrial sensors market forecasting report includes the adoption lifecycle of the market, covering from the innovator's stage to the laggard's stage. It focuses on adoption rates in different regions based on penetration. Furthermore, the industrial sensors market report also includes key purchase criteria and drivers of price sensitivity to help companies evaluate and develop their market growth analysis strategies.

Industrial Sensors Market Share by Geography

 Customer Landscape

Key Companies & Market Insights

Companies are implementing various strategies, such as strategic alliances, industrial sensors market forecast, partnerships, mergers and acquisitions, geographical expansion, and product/service launches, to enhance their presence In the industry.

The industry research and growth report includes detailed analyses of the competitive landscape of the market and information about key companies, including:

  • Amkor Technology Inc.
  • Amphenol Advanced Sensors
  • Analog Devices Inc.
  • Broadcom Inc.
  • Excelitas Technologies Corp.
  • Hamamatsu Photonics KK
  • Honeywell International Inc.
  • Itron Inc.
  • Maxim Integrated Products Inc.
  • Motion Solutions
  • Murata Manufacturing Co. Ltd.
  • NXP Semiconductors NV
  • Renesas Electronics Corp.
  • Robert Bosch GmbH
  • Rockwell Automation Inc.
  • ROHM Co. Ltd.
  • Sensata Technologies Inc.
  • Siemens AG
  • STMicroelectronics International N.V.
  • TDK Corp.
  • TE Connectivity Ltd.
  • Texas Instruments Inc.

Qualitative and quantitative analysis of companies has been conducted to help clients understand the wider business environment as well as the strengths and weaknesses of key industry players. Data is qualitatively analyzed to categorize companies as pure play, category-focused, industry-focused, and diversified; it is quantitatively analyzed to categorize companies as dominant, leading, strong, tentative, and weak.

Research Analyst Overview

The market is experiencing significant growth due to the increasing demand for real-time data and transparency in various industries. The integration of sensors into automated machinery and infrastructure development is leading to increased efficiency and profitability. Predictive maintenance through machine learning algorithms is becoming increasingly popular, allowing for early detection of potential anomalies and reducing downtime. Sensing technology plays a crucial role in various industrial processes, from condition monitoring in manufacturing floors to quality control in production lines. Level sensors, pressure sensors, and temperature sensors are essential components in ensuring optimal machine performance and preventing facility stoppages and slowdowns.

The use of advanced automation systems and digital technologies in industrial processes is driving the demand for cost-effective facilities and smart sensors. Smart sensors enable remote sensing and monitoring capabilities, providing real-time pictures for quality inspection and inventory counting. The integration of sensors into industrial communities, such as smart cities and renewable energy, is also on the rise. Wireless autonomous sensors are being used to monitor gas leakages, flammable gases, and changes in temperature in various applications. Motion sensors are used for material sorting and root error detection in various industrial processes. The use of sensors is not limited to new machinery but also extends to legacy machinery.

Sensors can be used to monitor the performance of automated machinery and identify potential issues before they become major problems. The use of sensors in industrial processes also extends to robotics applications, where they are used for liquid pressure measurement and monitoring vacuum pumps. The integration of sensors into industrial processes is also leading to the development of advanced software and connected devices. This enables real-time data collection and analysis, allowing for more informed decision-making and improved productivity. The use of sensors in industrial processes is also leading to the development of new applications, such as trace sensors for high-accuracy asset tracking and flow sensors for measuring quantity and flow rate in moving liquids and gases.

In conclusion, the market is experiencing significant growth due to the increasing demand for real-time data and transparency in various industries. The integration of sensors into industrial processes is leading to increased efficiency, profitability, and productivity. The use of sensors is not limited to new machinery but also extends to legacy machinery, and the development of advanced software and connected devices is enabling new applications and improving operational equipment performance.

Market Scope

Report Coverage

Details

Page number

185

Base year

2023

Historic period

2018-2022

Forecast period

2024-2028

Growth momentum & CAGR

Accelerate at a CAGR of 9.44%

Market growth 2024-2028

USD 14.3 billion

Market structure

Fragmented

YoY growth 2023-2024(%)

8.37

Key countries

US, China, Japan, Germany, and France

Competitive landscape

Leading Companies, Market Positioning of Companies, Competitive Strategies, and Industry Risks

Request Free Sample

What are the Key Data Covered in this Industrial Sensors Market Research and Growth Report?

  • CAGR of the Industrial Sensors industry during the forecast period
  • Detailed information on factors that will drive the growth and forecasting between 2024 and 2028
  • Precise estimation of the size of the market and its contribution of the industry in focus to the parent market
  • Accurate predictions about upcoming growth and trends and changes in consumer behaviour
  • Growth of the market across APAC, Europe, North America, Middle East and Africa, and South America
  • Thorough analysis of the market's competitive landscape and detailed information about companies
  • Comprehensive analysis of factors that will challenge the industrial sensors market growth of industry companies

We can help! Our analysts can customize this industrial sensors market research report to meet your requirements.

Get in touch

1 Executive Summary

  • 1.1 Market overview
    • Executive Summary - Chart on Market Overview
    • Executive Summary - Data Table on Market Overview
    • Executive Summary - Chart on Global Market Characteristics
    • Executive Summary - Chart on Market by Geography
    • Executive Summary - Chart on Market Segmentation by End-user
    • Executive Summary - Chart on Market Segmentation by Product
    • Executive Summary - Chart on Incremental Growth
    • Executive Summary - Data Table on Incremental Growth
    • Executive Summary - Chart on Company Market Positioning

2 Market Landscape

  • 2.1 Market ecosystem
    • Parent Market
    • Data Table on - Parent Market
  • 2.2 Market characteristics
    • Market characteristics analysis
  • 2.3 Value chain analysis
    • Value Chain Analysis

3 Market Sizing

  • 3.1 Market definition
    • Offerings of companies included in the market definition
  • 3.2 Market segment analysis
    • Market segments
  • 3.3 Market size 2023
    • 3.4 Market outlook: Forecast for 2023-2028
      • Chart on Global - Market size and forecast 2023-2028 ($ billion)
      • Data Table on Global - Market size and forecast 2023-2028 ($ billion)
      • Chart on Global Market: Year-over-year growth 2023-2028 (%)
      • Data Table on Global Market: Year-over-year growth 2023-2028 (%)

    4 Historic Market Size

    • 4.1 Global Industrial Sensors Market 2018 - 2022
      • Historic Market Size - Data Table on Global Industrial Sensors Market 2018 - 2022 ($ billion)
    • 4.2 End-user segment analysis 2018 - 2022
      • Historic Market Size - End-user Segment 2018 - 2022 ($ billion)
    • 4.3 Product segment analysis 2018 - 2022
      • Historic Market Size - Product Segment 2018 - 2022 ($ billion)
    • 4.4 Geography segment analysis 2018 - 2022
      • Historic Market Size - Geography Segment 2018 - 2022 ($ billion)
    • 4.5 Country segment analysis 2018 - 2022
      • Historic Market Size - Country Segment 2018 - 2022 ($ billion)

    5 Five Forces Analysis

    • 5.1 Five forces summary
      • Five forces analysis - Comparison between 2023 and 2028
    • 5.2 Bargaining power of buyers
      • Bargaining power of buyers - Impact of key factors 2023 and 2028
    • 5.3 Bargaining power of suppliers
      • Bargaining power of suppliers - Impact of key factors in 2023 and 2028
    • 5.4 Threat of new entrants
      • Threat of new entrants - Impact of key factors in 2023 and 2028
    • 5.5 Threat of substitutes
      • Threat of substitutes - Impact of key factors in 2023 and 2028
    • 5.6 Threat of rivalry
      • Threat of rivalry - Impact of key factors in 2023 and 2028
    • 5.7 Market condition
      • Chart on Market condition - Five forces 2023 and 2028

    6 Market Segmentation by End-user

    • 6.1 Market segments
      • Chart on End-user - Market share 2023-2028 (%)
      • Data Table on End-user - Market share 2023-2028 (%)
    • 6.2 Comparison by End-user
      • Chart on Comparison by End-user
      • Data Table on Comparison by End-user
    • 6.3 Process industries - Market size and forecast 2023-2028
      • Chart on Process industries - Market size and forecast 2023-2028 ($ billion)
      • Data Table on Process industries - Market size and forecast 2023-2028 ($ billion)
      • Chart on Process industries - Year-over-year growth 2023-2028 (%)
      • Data Table on Process industries - Year-over-year growth 2023-2028 (%)
    • 6.4 Discrete industries - Market size and forecast 2023-2028
      • Chart on Discrete industries - Market size and forecast 2023-2028 ($ billion)
      • Data Table on Discrete industries - Market size and forecast 2023-2028 ($ billion)
      • Chart on Discrete industries - Year-over-year growth 2023-2028 (%)
      • Data Table on Discrete industries - Year-over-year growth 2023-2028 (%)
    • 6.5 Market opportunity by End-user
      • Market opportunity by End-user ($ billion)
      • Data Table on Market opportunity by End-user ($ billion)

    7 Market Segmentation by Product

    • 7.1 Market segments
      • Chart on Product - Market share 2023-2028 (%)
      • Data Table on Product - Market share 2023-2028 (%)
    • 7.2 Comparison by Product
      • Chart on Comparison by Product
      • Data Table on Comparison by Product
    • 7.3 Pressure - Market size and forecast 2023-2028
      • Chart on Pressure - Market size and forecast 2023-2028 ($ billion)
      • Data Table on Pressure - Market size and forecast 2023-2028 ($ billion)
      • Chart on Pressure - Year-over-year growth 2023-2028 (%)
      • Data Table on Pressure - Year-over-year growth 2023-2028 (%)
    • 7.4 Temperature - Market size and forecast 2023-2028
      • Chart on Temperature - Market size and forecast 2023-2028 ($ billion)
      • Data Table on Temperature - Market size and forecast 2023-2028 ($ billion)
      • Chart on Temperature - Year-over-year growth 2023-2028 (%)
      • Data Table on Temperature - Year-over-year growth 2023-2028 (%)
    • 7.5 Proximity - Market size and forecast 2023-2028
      • Chart on Proximity - Market size and forecast 2023-2028 ($ billion)
      • Data Table on Proximity - Market size and forecast 2023-2028 ($ billion)
      • Chart on Proximity - Year-over-year growth 2023-2028 (%)
      • Data Table on Proximity - Year-over-year growth 2023-2028 (%)
    • 7.6 Flow - Market size and forecast 2023-2028
      • Chart on Flow - Market size and forecast 2023-2028 ($ billion)
      • Data Table on Flow - Market size and forecast 2023-2028 ($ billion)
      • Chart on Flow - Year-over-year growth 2023-2028 (%)
      • Data Table on Flow - Year-over-year growth 2023-2028 (%)
    • 7.7 Others - Market size and forecast 2023-2028
      • Chart on Others - Market size and forecast 2023-2028 ($ billion)
      • Data Table on Others - Market size and forecast 2023-2028 ($ billion)
      • Chart on Others - Year-over-year growth 2023-2028 (%)
      • Data Table on Others - Year-over-year growth 2023-2028 (%)
    • 7.8 Market opportunity by Product
      • Market opportunity by Product ($ billion)
      • Data Table on Market opportunity by Product ($ billion)

    8 Customer Landscape

    • 8.1 Customer landscape overview
      • Analysis of price sensitivity, lifecycle, customer purchase basket, adoption rates, and purchase criteria

    9 Geographic Landscape

    • 9.1 Geographic segmentation
      • Chart on Market share by geography 2023-2028 (%)
      • Data Table on Market share by geography 2023-2028 (%)
    • 9.2 Geographic comparison
      • Chart on Geographic comparison
      • Data Table on Geographic comparison
    • 9.3 APAC - Market size and forecast 2023-2028
      • Chart on APAC - Market size and forecast 2023-2028 ($ billion)
      • Data Table on APAC - Market size and forecast 2023-2028 ($ billion)
      • Chart on APAC - Year-over-year growth 2023-2028 (%)
      • Data Table on APAC - Year-over-year growth 2023-2028 (%)
    • 9.4 Europe - Market size and forecast 2023-2028
      • Chart on Europe - Market size and forecast 2023-2028 ($ billion)
      • Data Table on Europe - Market size and forecast 2023-2028 ($ billion)
      • Chart on Europe - Year-over-year growth 2023-2028 (%)
      • Data Table on Europe - Year-over-year growth 2023-2028 (%)
    • 9.5 North America - Market size and forecast 2023-2028
      • Chart on North America - Market size and forecast 2023-2028 ($ billion)
      • Data Table on North America - Market size and forecast 2023-2028 ($ billion)
      • Chart on North America - Year-over-year growth 2023-2028 (%)
      • Data Table on North America - Year-over-year growth 2023-2028 (%)
    • 9.6 Middle East and Africa - Market size and forecast 2023-2028
      • Chart on Middle East and Africa - Market size and forecast 2023-2028 ($ billion)
      • Data Table on Middle East and Africa - Market size and forecast 2023-2028 ($ billion)
      • Chart on Middle East and Africa - Year-over-year growth 2023-2028 (%)
      • Data Table on Middle East and Africa - Year-over-year growth 2023-2028 (%)
    • 9.7 South America - Market size and forecast 2023-2028
      • Chart on South America - Market size and forecast 2023-2028 ($ billion)
      • Data Table on South America - Market size and forecast 2023-2028 ($ billion)
      • Chart on South America - Year-over-year growth 2023-2028 (%)
      • Data Table on South America - Year-over-year growth 2023-2028 (%)
    • 9.8 US - Market size and forecast 2023-2028
      • Chart on US - Market size and forecast 2023-2028 ($ billion)
      • Data Table on US - Market size and forecast 2023-2028 ($ billion)
      • Chart on US - Year-over-year growth 2023-2028 (%)
      • Data Table on US - Year-over-year growth 2023-2028 (%)
    • 9.9 China - Market size and forecast 2023-2028
      • Chart on China - Market size and forecast 2023-2028 ($ billion)
      • Data Table on China - Market size and forecast 2023-2028 ($ billion)
      • Chart on China - Year-over-year growth 2023-2028 (%)
      • Data Table on China - Year-over-year growth 2023-2028 (%)
    • 9.10 Japan - Market size and forecast 2023-2028
      • Chart on Japan - Market size and forecast 2023-2028 ($ billion)
      • Data Table on Japan - Market size and forecast 2023-2028 ($ billion)
      • Chart on Japan - Year-over-year growth 2023-2028 (%)
      • Data Table on Japan - Year-over-year growth 2023-2028 (%)
    • 9.11 Germany - Market size and forecast 2023-2028
      • Chart on Germany - Market size and forecast 2023-2028 ($ billion)
      • Data Table on Germany - Market size and forecast 2023-2028 ($ billion)
      • Chart on Germany - Year-over-year growth 2023-2028 (%)
      • Data Table on Germany - Year-over-year growth 2023-2028 (%)
    • 9.12 France - Market size and forecast 2023-2028
      • Chart on France - Market size and forecast 2023-2028 ($ billion)
      • Data Table on France - Market size and forecast 2023-2028 ($ billion)
      • Chart on France - Year-over-year growth 2023-2028 (%)
      • Data Table on France - Year-over-year growth 2023-2028 (%)
    • 9.13 Market opportunity by geography
      • Market opportunity by geography ($ billion)
      • Data Tables on Market opportunity by geography ($ billion)

    10 Drivers, Challenges, and Opportunity/Restraints

    • 10.1 Market drivers
      • 10.2 Market challenges
        • 10.3 Impact of drivers and challenges
          • Impact of drivers and challenges in 2023 and 2028
        • 10.4 Market opportunities/restraints

          11 Competitive Landscape

          • 11.1 Overview
            • 11.2 Competitive Landscape
              • Overview on criticality of inputs and factors of differentiation
            • 11.3 Landscape disruption
              • Overview on factors of disruption
            • 11.4 Industry risks
              • Impact of key risks on business

            12 Competitive Analysis

            • 12.1 Companies profiled
              • Companies covered
            • 12.2 Market positioning of companies
              • Matrix on companies position and classification
            • 12.3 Amkor Technology Inc.
              • Amkor Technology Inc. - Overview
              • Amkor Technology Inc. - Business segments
              • Amkor Technology Inc. - Key news
              • Amkor Technology Inc. - Key offerings
              • Amkor Technology Inc. - Segment focus
            • 12.4 Amphenol Advanced Sensors
              • Amphenol Advanced Sensors - Overview
              • Amphenol Advanced Sensors - Product / Service
              • Amphenol Advanced Sensors - Key offerings
            • 12.5 Analog Devices Inc.
              • Analog Devices Inc. - Overview
              • Analog Devices Inc. - Business segments
              • Analog Devices Inc. - Key news
              • Analog Devices Inc. - Key offerings
              • Analog Devices Inc. - Segment focus
            • 12.6 Broadcom Inc.
              • Broadcom Inc. - Overview
              • Broadcom Inc. - Business segments
              • Broadcom Inc. - Key news
              • Broadcom Inc. - Key offerings
              • Broadcom Inc. - Segment focus
            • 12.7 Hamamatsu Photonics KK
              • Hamamatsu Photonics KK - Overview
              • Hamamatsu Photonics KK - Business segments
              • Hamamatsu Photonics KK - Key news
              • Hamamatsu Photonics KK - Key offerings
              • Hamamatsu Photonics KK - Segment focus
            • 12.8 Honeywell International Inc.
              • Honeywell International Inc. - Overview
              • Honeywell International Inc. - Business segments
              • Honeywell International Inc. - Key news
              • Honeywell International Inc. - Key offerings
              • Honeywell International Inc. - Segment focus
            • 12.9 Maxim Integrated Products Inc.
              • Maxim Integrated Products Inc. - Overview
              • Maxim Integrated Products Inc. - Key offerings
            • 12.10 Motion Solutions
              • Motion Solutions - Overview
              • Motion Solutions - Product / Service
              • Motion Solutions - Key offerings
            • 12.11 NXP Semiconductors NV
              • NXP Semiconductors NV - Overview
              • NXP Semiconductors NV - Product / Service
              • NXP Semiconductors NV - Key news
              • NXP Semiconductors NV - Key offerings
            • 12.12 Renesas Electronics Corp.
              • Renesas Electronics Corp. - Overview
              • Renesas Electronics Corp. - Business segments
              • Renesas Electronics Corp. - Key news
              • Renesas Electronics Corp. - Key offerings
              • Renesas Electronics Corp. - Segment focus
            • 12.13 Robert Bosch GmbH
              • Robert Bosch GmbH - Overview
              • Robert Bosch GmbH - Product / Service
              • Robert Bosch GmbH - Key news
              • Robert Bosch GmbH - Key offerings
            • 12.14 Rockwell Automation Inc.
              • Rockwell Automation Inc. - Overview
              • Rockwell Automation Inc. - Business segments
              • Rockwell Automation Inc. - Key news
              • Rockwell Automation Inc. - Key offerings
              • Rockwell Automation Inc. - Segment focus
            • 12.15 Siemens AG
              • Siemens AG - Overview
              • Siemens AG - Business segments
              • Siemens AG - Key news
              • Siemens AG - Key offerings
              • Siemens AG - Segment focus
            • 12.16 STMicroelectronics International N.V.
              • STMicroelectronics International N.V. - Overview
              • STMicroelectronics International N.V. - Business segments
              • STMicroelectronics International N.V. - Key news
              • STMicroelectronics International N.V. - Key offerings
              • STMicroelectronics International N.V. - Segment focus
            • 12.17 TDK Corp.
              • TDK Corp. - Overview
              • TDK Corp. - Business segments
              • TDK Corp. - Key news
              • TDK Corp. - Key offerings
              • TDK Corp. - Segment focus

            13 Appendix

            • 13.1 Scope of the report
              • 13.2 Inclusions and exclusions checklist
                • Inclusions checklist
                • Exclusions checklist
              • 13.3 Currency conversion rates for US$
                • Currency conversion rates for US$
              • 13.4 Research methodology
                • Research methodology
              • 13.5 Data procurement
                • Information sources
              • 13.6 Data validation
                • Data validation
              • 13.7 Validation techniques employed for market sizing
                • Validation techniques employed for market sizing
              • 13.8 Data synthesis
                • Data synthesis
              • 360 degree market analysis
                • 360 degree market analysis
              • 13.10 List of abbreviations
                • List of abbreviations

              Research Methodology

              Technavio presents a detailed picture of the market by way of study, synthesis, and summation of data from multiple sources. The analysts have presented the various facets of the market with a particular focus on identifying the key industry influencers. The data thus presented is comprehensive, reliable, and the result of extensive research, both primary and secondary.

              INFORMATION SOURCES

              Primary sources

              • Manufacturers and suppliers
              • Channel partners
              • Industry experts
              • Strategic decision makers

              Secondary sources

              • Industry journals and periodicals
              • Government data
              • Financial reports of key industry players
              • Historical data
              • Press releases

              DATA ANALYSIS

              Data Synthesis

              • Collation of data
              • Estimation of key figures
              • Analysis of derived insights

              Data Validation

              • Triangulation with data models
              • Reference against proprietary databases
              • Corroboration with industry experts

              REPORT WRITING

              Qualitative

              • Market drivers
              • Market challenges
              • Market trends
              • Five forces analysis

              Quantitative

              • Market size and forecast
              • Market segmentation
              • Geographical insights
              • Competitive landscape

              Interested in this report?

              Get your sample now to see our research methodology and insights!

              Download Now

              Frequently Asked Questions

              Industrial Sensors market growth will increase by $ 14.3 bn during 2024-2028 .

              The Industrial Sensors market is expected to grow at a CAGR of 9.44% during 2024-2028 .

              Industrial Sensors market is segmented by End-user( Process industries, Discrete industries, Proximity, Flow, Others) Product( Pressure, Temperature, Proximity, Flow, Others)

              Amkor Technology Inc., Amphenol Advanced Sensors, Analog Devices Inc., Broadcom Inc., Excelitas Technologies Corp., Hamamatsu Photonics KK, Honeywell International Inc., Itron Inc., Maxim Integrated Products Inc., Motion Solutions, Murata Manufacturing Co. Ltd., NXP Semiconductors NV, Renesas Electronics Corp., Robert Bosch GmbH, Rockwell Automation Inc., ROHM Co. Ltd., Sensata Technologies Inc., Siemens AG, STMicroelectronics International N.V., TDK Corp., TE Connectivity Ltd., Texas Instruments Inc. are a few of the key vendors in the Industrial Sensors market.

              APAC will register the highest growth rate of 38% among the other regions. Therefore, the Industrial Sensors market in APAC is expected to garner significant business opportunities for the vendors during the forecast period.

              US, China, Japan, Germany, France

              • Rise in demand for smart factories and IIoTOver the years is the driving factor this market.
              • the need for smart factories has increased globally. This trend is expected to continue during the forecast period with the emergence of the IIoT that assimilates smart machines is the driving factor this market.
              • warehouses is the driving factor this market.
              • industrial robots is the driving factor this market.
              • and entire production facilities to achieve corporate goals and key performance indicators (KPIs). Various industrial sensors placed in factories gather and relay real-time information is the driving factor this market.
              • enabling relevant floor decisions and helping operators. Sensor information can also guide robots and machines to perform production and assembly processes and handle toxic chemicals is the driving factor this market.
              • among other jobs is the driving factor this market.
              • and ensure the safety of the human workforce. It also prevents damage to machinery. Therefore is the driving factor this market.
              • the integration of the IIoT in factories transforms them into connected and synchronized units.Manufacturing companies in countries such as China and Germany have already adopted industrial sensors to ensure better communication and precise coordination among organizations. During the forecast period is the driving factor this market.
              • the adoption of automation in end-to-end processes will increase. Automation will involve the use of robots is the driving factor this market.
              • sensors is the driving factor this market.
              • software is the driving factor this market.
              • wireless systems is the driving factor this market.
              • programmable logic controllers (PLCs) is the driving factor this market.
              • and software solutions such as distributed control systems. The concept of smart factories can only be achieved in industries that have advanced real-time monitoring and control using industrial sensors and digital interfaces.The global market will gain traction during the forecast period. This is primarily because of the increased demand for smart asset monitoring in asset-intensive industries such as oil and gas. For instance is the driving factor this market.
              • in the oil and gas industry is the driving factor this market.
              • the majority of its capital is in the form of physical assets such as drilling platforms is the driving factor this market.
              • pipelines is the driving factor this market.
              • tanks is the driving factor this market.
              • and pumps. These complex assets are exposed to remote and challenging climatic environments. Since the overall financial performance of firms in the industry is largely dependent on the return on assets (ROA) is the driving factor this market.
              • it is essential that assets are monitored effectively.Hence is the driving factor this market.
              • during the forecast period is the driving factor this market.
              • industrial sensors will increasingly be used in conjunction with analytics and Big Data for the improvement of productivity and operational excellence. The sensors guarantee minimum downtime and ensure a reduced need for backup equipment. Industrial sensors also improve automated workflows with the use of real-time alerts is the driving factor this market.
              • insights from data is the driving factor this market.
              • dynamic edge control of assets is the driving factor this market.
              • and predictive maintenance. This will boost the global market growth during the forecast period. is the driving factor this market.

              The Industrial Sensors market vendors should focus on grabbing business opportunities from the Process industries segment as it accounted for the largest market share in the base year.