
Influencering Platform Market Size 2026-2030
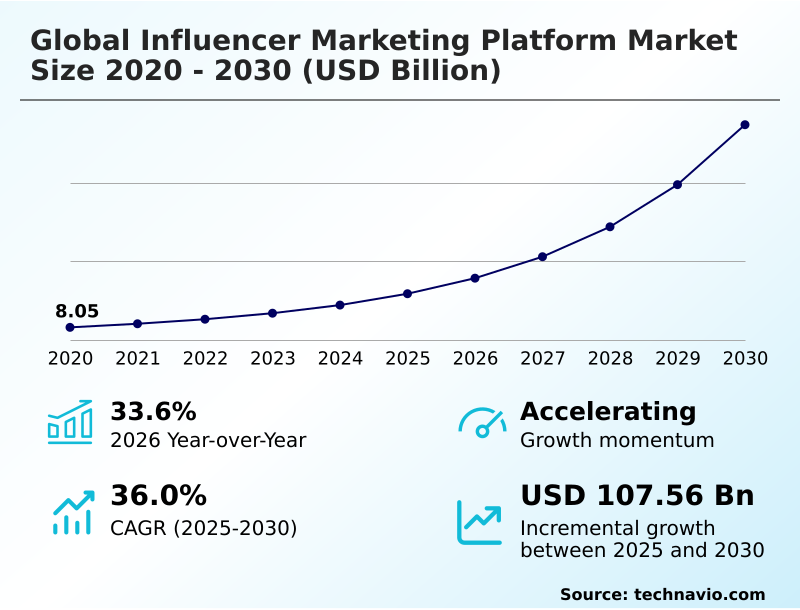
The influencering platform market size is valued to increase by USD 107.56 billion, at a CAGR of 36% from 2025 to 2030. Escalating proliferation of social media and maturation of creator economy will drive the influencering platform market.
Major Market Trends & Insights
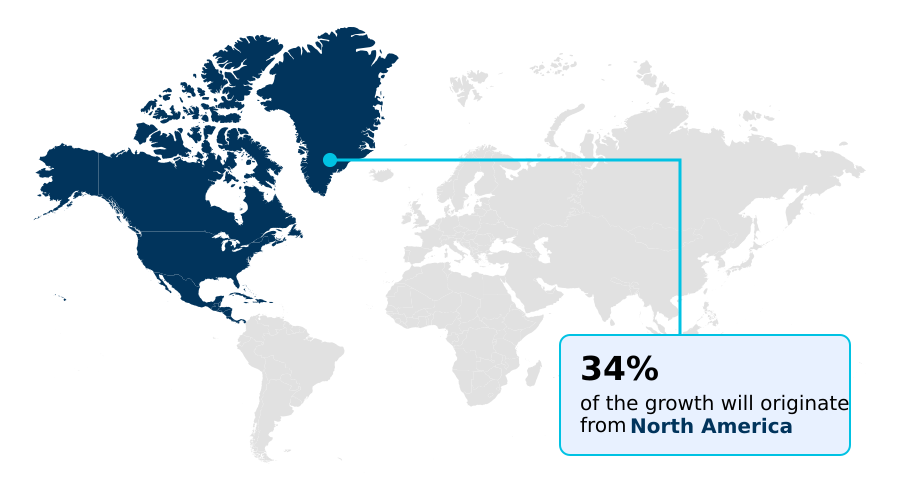
- North America dominated the market and accounted for a 33.9% growth during the forecast period.
- By End-user - Large enterprise segment was valued at USD 14.40 billion in 2024
- By Application - Fashion and lifestyle segment accounted for the largest market revenue share in 2024
Market Size & Forecast
- Market Opportunities: USD 128.96 billion
- Market Future Opportunities: USD 107.56 billion
- CAGR from 2025 to 2030 : 36%
Market Summary
- The influencer marketing platform market is defined by a strategic pivot toward data-driven accountability and operational scale. As brands move beyond manual, relationship-based approaches, they require technology that provides an influencer discovery engine, robust campaign workflow automation, and sophisticated influencer analytics. The core value lies in transforming influencer partnerships from a speculative art into a measurable science.
- For instance, a global consumer packaged goods company can leverage a platform’s content collaboration portal to manage a campaign with 500 micro-influencers across five countries, ensuring consistent messaging and brand safety protocols. The platform automates the entire process, from the initial influencer vetting process and contract management automation to integrated payment systems and digital rights management.
- This not only increases operational efficiency but also provides a centralized performance reporting dashboard to calculate return on investment and optimize future spending based on real-time KPI monitoring and audience sentiment analysis. This shift toward technology-enabled management is essential for navigating the complex and expanding creator economy.
What will be the Size of the Influencering Platform Market during the forecast period?
Get Key Insights on Market Forecast (PDF) Get Free Sample
How is the Influencering Platform Market Segmented?
The influencering platform industry research report provides comprehensive data (region-wise segment analysis), with forecasts and estimates in "USD million" for the period 2026-2030, as well as historical data from 2020-2024 for the following segments.
- End-user
- Large enterprise
- Small and medium enterprise
- Application
- Fashion and lifestyle
- Food and entertainment
- Travel and holiday
- Sports and fitness
- Others
- Component
- Software
- Services
- Geography
- North America
- US
- Canada
- Mexico
- Europe
- Germany
- France
- UK
- APAC
- China
- India
- Japan
- Middle East and Africa
- Saudi Arabia
- UAE
- South Africa
- South America
- Brazil
- Argentina
- Colombia
- Rest of World (ROW)
- North America
By End-user Insights
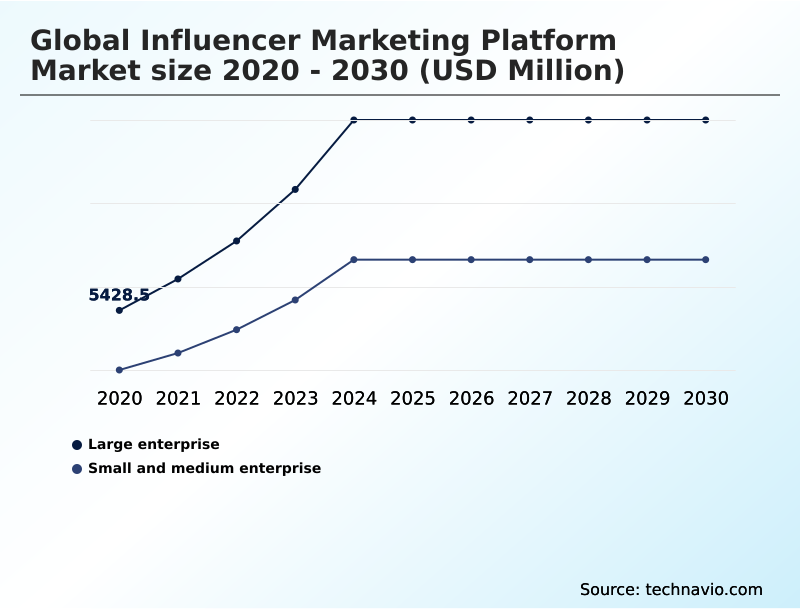
The large enterprise segment is estimated to witness significant growth during the forecast period.
The large enterprise segment demands sophisticated, scalable, and data-centric influencer marketing platforms. These organizations require solutions that offer enterprise-grade security and robust brand safety protocols to mitigate reputational risk across global campaigns.
Key functionalities include advanced creator relationship management and contract management automation to handle complex, multi-regional programs efficiently.
For these clients, platforms are not just discovery tools but integral components of the marketing technology stack, with deep ecommerce system integration and financial management tools.
The focus on a data-driven decision making process is paramount, with an emphasis on using platforms for B2B influencer strategy to achieve operational efficiency.
These advanced systems have demonstrated a capacity to reduce compliance-related errors by over 95% through automated workflow verifications.
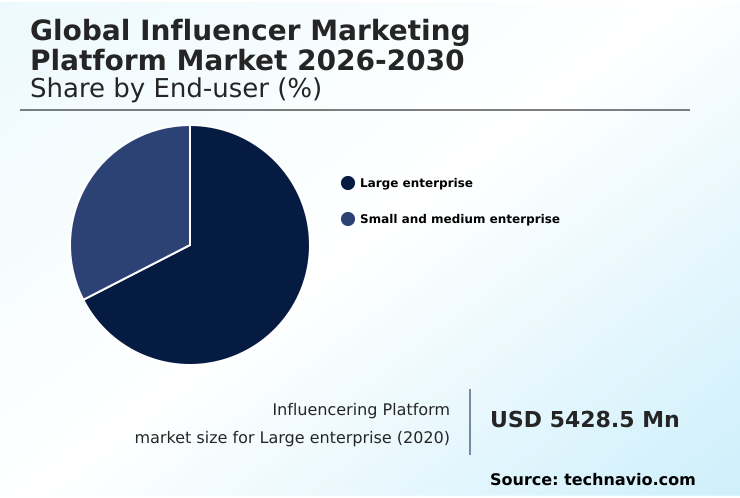
The Large enterprise segment was valued at USD 14.40 billion in 2024 and showed a gradual increase during the forecast period.
Regional Analysis
North America is estimated to contribute 33.9% to the growth of the global market during the forecast period.Technavio’s analysts have elaborately explained the regional trends and drivers that shape the market during the forecast period.
See How Influencering Platform Market Demand is Rising in North America Get Free Sample
The market’s geographic distribution reflects varying levels of digital maturity. In North America, the focus is on return on investment calculation, with platforms delivering advanced campaign performance analytics; businesses here report a 30% improvement in accuracy using integrated tools.
Europe’s fragmented landscape demands pan-regional campaign execution capabilities, with a strong emphasis on data privacy. Meanwhile, the APAC region is characterized by hyper-local influencer engagement, where platforms offering multilingual content analysis see 50% higher client retention.
Across all regions, the ability to conduct a brand lift study and perform real-time KPI monitoring is becoming standard.
Successful expansion requires a deep understanding of local creator ecosystems and audience demographic analysis to effectively measure share of voice and audience sentiment analysis.
Market Dynamics
Our researchers analyzed the data with 2025 as the base year, along with the key drivers, trends, and challenges. A holistic analysis of drivers will help companies refine their marketing strategies to gain a competitive advantage.
- Strategic decision-making in the global influencer marketing platform market 2026-2030 requires a granular understanding of its diverse applications. The approach for the Global Influencer Marketing Platform Market 2026-2030 for large enterprises, which prioritizes scalability and integration, differs significantly from the Global Influencer Marketing Platform Market 2026-2030 for SMEs, which values affordability and ease-of-use.
- The role of AI in Global Influencer Marketing Platform Market 2026-2030 is becoming central to demonstrating value, directly impacting the ROI of Global Influencer Marketing Platform Market 2026-2030. In specialized verticals, B2B Global Influencer Marketing Platform Market 2026-2030 strategies focus on thought leadership, while the Global Influencer Marketing Platform Market 2026-2030 for fashion industry thrives on visual discovery.
- Similarly, the approaches for the Global Influencer Marketing Platform Market 2026-2030 for travel marketing and the Global Influencer Marketing Platform Market 2026-2030 for gaming influencers are highly distinct. Modern platforms are defined by their Global Influencer Marketing Platform Market 2026-2030 social commerce integration and full-funnel attribution in Global Influencer Marketing Platform Market 2026-2030.
- A crucial element for sustaining trust is the effectiveness of Global Influencer Marketing Platform Market 2026-2030 fraud detection solutions. Firms are scaling influencer programs with Global Influencer Marketing Platform Market 2026-2030, which requires advanced tools for managing micro-influencers with Global Influencer Marketing Platform Market 2026-2030.
- The ability to demonstrate ROI relies on measuring Global Influencer Marketing Platform Market 2026-2030 campaign success accurately. This involves navigating Global Influencer Marketing Platform Market 2026-2030 and data privacy compliance and leveraging predictive analytics in Global Influencer Marketing Platform Market 2026-2030.
- Operationally, Global Influencer Marketing Platform Market 2026-2030 API integration capabilities and influencer payment automation with Global Influencer Marketing Platform Market 2026-2030 are key, while a strategic Global Influencer Marketing Platform Market 2026-2030 vendor comparison is essential for Global Influencer Marketing Platform Market 2026-2030 for B2C brands.
- Businesses using integrated platforms report an operational workflow that is twice as efficient as those using disparate manual tools.
What are the key market drivers leading to the rise in the adoption of Influencering Platform Industry?
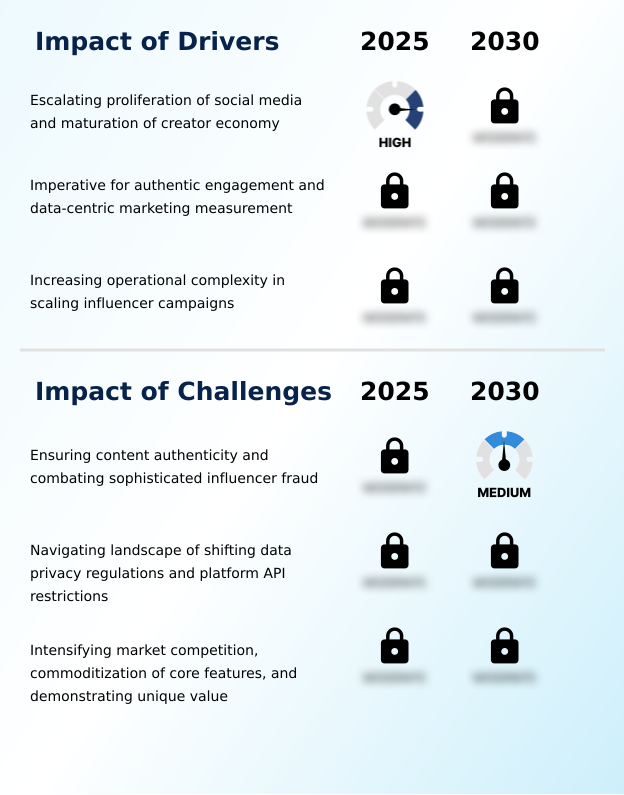
- The escalating proliferation of social media, coupled with the maturation of the creator economy, serves as a fundamental driver for market expansion.
- The market's primary driver is the operational complexity of scaling influencer marketing in a maturing creator economy. As brands shift to long-tail creator partnerships, the manual management of hundreds of micro-influencers becomes unfeasible.
- Platforms address this with a powerful influencer discovery engine and creator database, reducing recruitment time by up to 60%.
- The need for end-to-end campaign management is critical, with automated campaign workflow automation and product seeding automation leading to a 40% reduction in administrative overhead. These systems serve as a centralized creator marketplace, enabling efficient multi-platform campaign orchestration.
- The demand for a clear performance reporting dashboard that proves the value of influencer-generated content and fosters community trust underpins the entire market's expansion.
What are the market trends shaping the Influencering Platform Industry?
- The integration of AI and machine learning is a dominant trend, enabling predictive analytics for enhanced efficiency. This technological infusion elevates platforms into intelligent, strategic engines for campaign optimization.
- A transformative trend is the infusion of AI into platforms, enabling predictive performance analytics and elevating campaign intelligence. This allows for sophisticated brand-influencer selection, with AI-driven tools forecasting engagement with 20% greater accuracy than manual methods.
- The convergence with social commerce functionality is another dominant trend; platforms with integrated affiliate link integration and conversion tracking are demonstrating a direct ROI, with some brands reporting a 15% uplift in sales from influencer-led live stream shopping tools. This focus on full-funnel attribution reshapes influencer marketing into a direct revenue driver.
- The rise of virtual influencer management and professional talent management agencies necessitates platforms that can handle diverse creator types, ensuring authentic consumer engagement through advanced peer-to-peer recommendation frameworks.
What challenges does the Influencering Platform Industry face during its growth?
- Ensuring content authenticity while combating sophisticated influencer fraud presents a primary challenge to the industry's sustained growth and credibility.
- A core challenge is maintaining integrity against sophisticated fraud and navigating a restrictive data landscape. Platforms must continuously advance their fraudulent activity detection systems, as campaigns can waste up to 15% of their budget on inauthentic engagement. A robust audience authenticity assessment and influencer vetting process are no longer optional.
- Concurrently, social media API restrictions can impact influencer analytics capabilities by as much as 25% overnight. Adherence to data privacy regulations compliance adds complexity, particularly for cross-border payment solutions. Platforms must innovate with secure content collaboration portals and strong digital rights management while ensuring effective ROI tracking through compliant integrated payment systems.
Exclusive Technavio Analysis on Customer Landscape
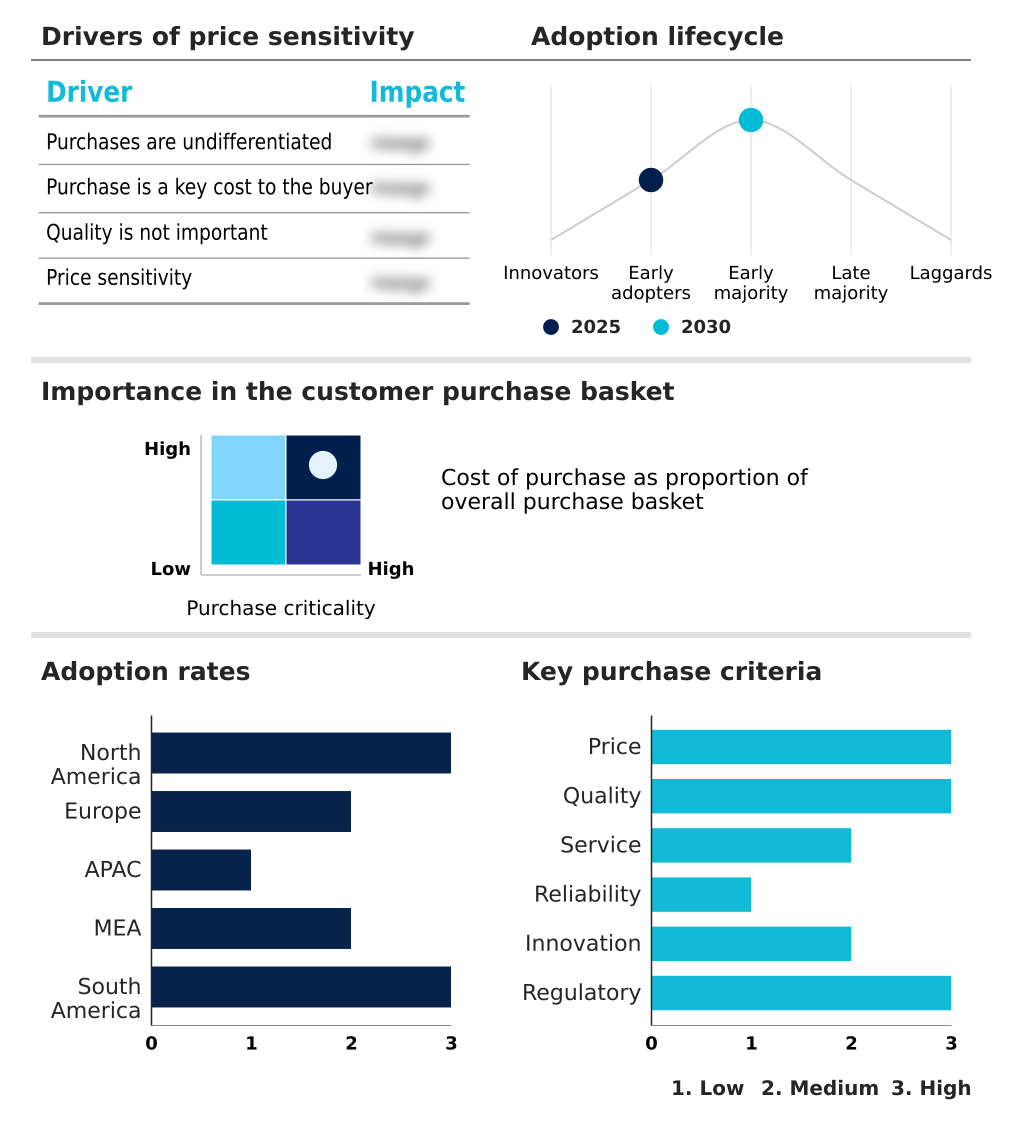
The influencering platform market forecasting report includes the adoption lifecycle of the market, covering from the innovator’s stage to the laggard’s stage. It focuses on adoption rates in different regions based on penetration. Furthermore, the influencering platform market report also includes key purchase criteria and drivers of price sensitivity to help companies evaluate and develop their market growth analysis strategies.
Customer Landscape of Influencering Platform Industry
Competitive Landscape
Companies are implementing various strategies, such as strategic alliances, influencering platform market forecast, partnerships, mergers and acquisitions, geographical expansion, and product/service launches, to enhance their presence in the industry.
AspireIQ Inc. - Platforms provide end-to-end software solutions, from creator discovery and campaign management to performance analytics, enabling data-driven, scalable influencer marketing strategies for modern enterprises.
The industry research and growth report includes detailed analyses of the competitive landscape of the market and information about key companies, including:
- AspireIQ Inc.
- Captiv8 Inc.
- Cision US Inc.
- CreatorIQ
- Emplifi Inc.
- ExpertVoice Inc.
- Fashion GPS Inc.
- Grin Technologies Inc.
- Ifluenz
- IZEA Worldwide Inc.
- JuliusWorks Inc.
- Linqia Inc.
- Lumanu Inc.
- Mavrck LLC
- Meltwater NV
- Obviously Social LLC
- Onalytica Ltd.
- Social Beat Digital Marketing
- The Cirqle
- Upfluence Inc.
Qualitative and quantitative analysis of companies has been conducted to help clients understand the wider business environment as well as the strengths and weaknesses of key industry players. Data is qualitatively analyzed to categorize companies as pure play, category-focused, industry-focused, and diversified; it is quantitatively analyzed to categorize companies as dominant, leading, strong, tentative, and weak.
Recent Development and News in Influencering platform market
- In May 2024, Tagger by Sprout Social launched a new feature set designed to enhance social commerce and affiliate marketing capabilities, empowering direct-to-consumer brands to connect influencer marketing efforts with direct sales outcomes.
- In December 2024, CreatorIQ announced in a report that its platform had tracked a 17% year-over-year increase in campaigns launched and a 29% rise in creator posts, highlighting the expanding scale of creator partnerships managed through sophisticated platforms.
- In February 2025, Sprout Social announced the official launch of its rebranded influencer marketing platform, Sprout Social Influencer Marketing, formerly known as Tagger Media, signifying the full integration of a dedicated influencer solution into its broader social media management suite.
- In February 2025, the social media marketing platform Later announced a strategic partnership with Snap Inc. to provide a comprehensive integration for a social and influencer marketing suite, enabling users to access more advanced tools and analytics for Snapchat.
Dive into Technavio’s robust research methodology, blending expert interviews, extensive data synthesis, and validated models for unparalleled Influencering Platform Market insights. See full methodology.
| Market Scope | |
|---|---|
| Page number | 294 |
| Base year | 2025 |
| Historic period | 2020-2024 |
| Forecast period | 2026-2030 |
| Growth momentum & CAGR | Accelerate at a CAGR of 36% |
| Market growth 2026-2030 | USD 107556.5 million |
| Market structure | Fragmented |
| YoY growth 2025-2026(%) | 33.6% |
| Key countries | US, Canada, Mexico, Germany, France, UK, Italy, Spain, The Netherlands, China, India, Japan, South Korea, Australia, Indonesia, Saudi Arabia, UAE, South Africa, Egypt, Nigeria, Brazil, Argentina and Colombia |
| Competitive landscape | Leading Companies, Market Positioning of Companies, Competitive Strategies, and Industry Risks |
Research Analyst Overview
- The influencer marketing platform market is defined by a transition toward integrated, technology-driven ecosystems. The core offering is an influencer discovery engine built upon a comprehensive creator database, enabling granular audience demographic analysis. These systems provide end-to-end campaign management, incorporating a streamlined content approval workflow, digital rights management, and integrated payment systems for efficient influencer payment processing.
- A critical function is the campaign performance analytics suite, featuring a performance reporting dashboard for return on investment calculation. Advanced solutions now include predictive performance analytics and an audience authenticity assessment to combat fraud. Brand safety protocols and a rigorous influencer vetting process are standard.
- Operationally, a centralized communication hub, contract management automation, and sophisticated financial management tools with a budget tracking system are essential. Real-time KPI monitoring allows for dynamic optimization, supported by analytics for share of voice measurement, audience sentiment analysis, and brand lift study results.
- Platforms delivering these capabilities, including social commerce functionality, live stream shopping tools, and robust ecommerce system integration, see adoption rates increase by over 25% year-over-year.
What are the Key Data Covered in this Influencering Platform Market Research and Growth Report?
-
What is the expected growth of the Influencering Platform Market between 2026 and 2030?
-
USD 107.56 billion, at a CAGR of 36%
-
-
What segmentation does the market report cover?
-
The report is segmented by End-user (Large enterprise, and Small and medium enterprise), Application (Fashion and lifestyle, Food and entertainment, Travel and holiday, Sports and fitness, and Others), Component (Software, and Services) and Geography (North America, Europe, APAC, Middle East and Africa, South America)
-
-
Which regions are analyzed in the report?
-
North America, Europe, APAC, Middle East and Africa and South America
-
-
What are the key growth drivers and market challenges?
-
Escalating proliferation of social media and maturation of creator economy, Ensuring content authenticity and combating sophisticated influencer fraud
-
-
Who are the major players in the Influencering Platform Market?
-
AspireIQ Inc., Captiv8 Inc., Cision US Inc., CreatorIQ, Emplifi Inc., ExpertVoice Inc., Fashion GPS Inc., Grin Technologies Inc., Ifluenz, IZEA Worldwide Inc., JuliusWorks Inc., Linqia Inc., Lumanu Inc., Mavrck LLC, Meltwater NV, Obviously Social LLC, Onalytica Ltd., Social Beat Digital Marketing, The Cirqle and Upfluence Inc.
-
Market Research Insights
- The professionalization of the creator economy and the demand for authentic consumer engagement are reshaping marketing strategies. Companies leveraging platforms for data-driven decision making report a 25% higher campaign ROI compared to manual methods. This shift is driving adoption of tools that facilitate long-tail creator partnerships and micro-influencer campaign scaling.
- Effective multi-platform campaign orchestration through a centralized system reduces administrative overhead by up to 40%. As influencer-generated content becomes a primary performance marketing channel, platforms must manage social media API restrictions and ensure data privacy regulations compliance.
- The ability to generate community trust through peer-to-peer recommendations is now a critical business metric, with brands achieving a 15% greater brand lift when using vetted, authentic creators.
We can help! Our analysts can customize this influencering platform market research report to meet your requirements.
 RIA -
RIA - 
