
Insurance Third Party Administrators Market Size 2026-2030
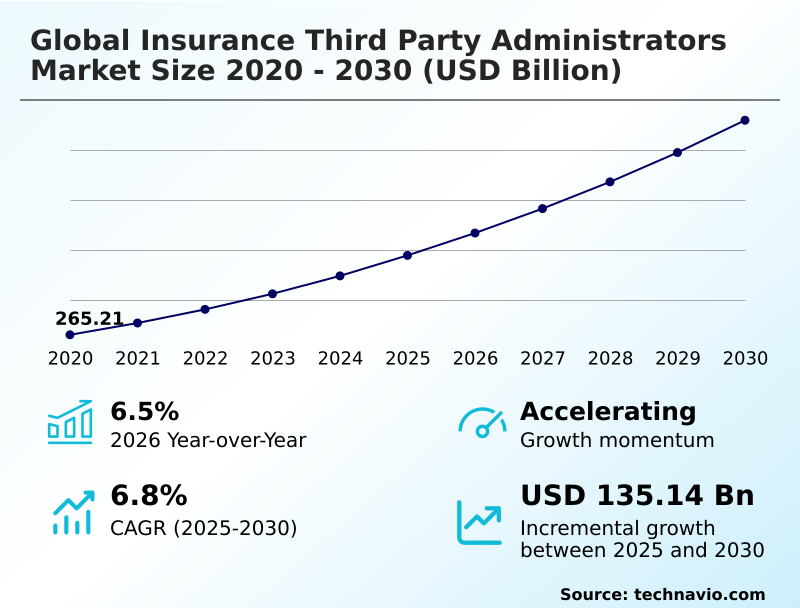
The insurance third party administrators market size is valued to increase by USD 135.14 billion, at a CAGR of 6.8% from 2025 to 2030. Intensified strategic focus on core insurance competencies will drive the insurance third party administrators market.
Major Market Trends & Insights
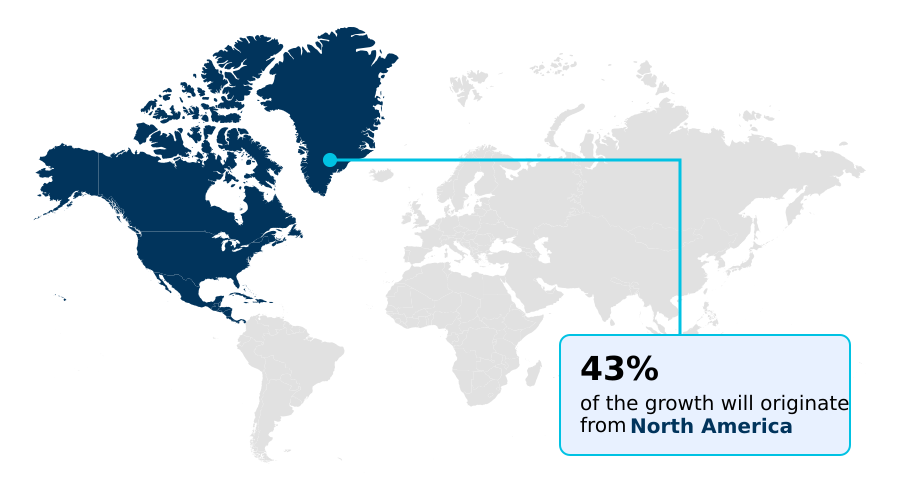
- North America dominated the market and accounted for a 43.2% growth during the forecast period.
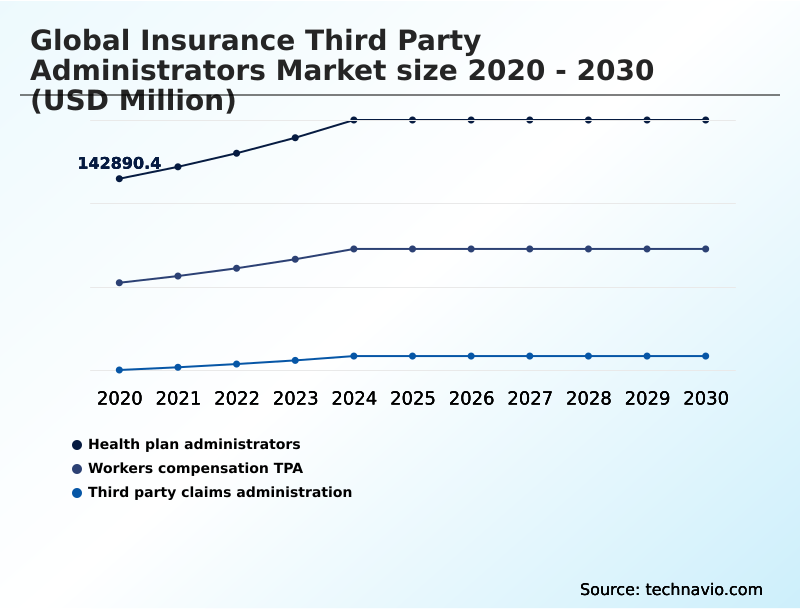
- By Service Type - Health plan administrators segment was valued at USD 175.39 billion in 2024
- By Type - Large enterprises segment accounted for the largest market revenue share in 2024
Market Size & Forecast
- Market Opportunities: USD 214.55 billion
- Market Future Opportunities: USD 135.14 billion
- CAGR from 2025 to 2030 : 6.8%
Market Summary
- The Insurance Third Party Administrators Market is defined by organizations that provide outsourced administrative and claims processing services, allowing insurance carriers and self-insured companies to focus on core competencies. A primary driver is the need for operational efficiency, as insurers offload functions like claims adjudication, policy management, and customer service to specialized TPAs.
- This shift is particularly evident in the administration of self-funded health plans, where TPAs manage everything from claims to regulatory compliance with ERISA and HIPAA.
- For example, a large, self-insured corporation might partner with a TPA to not only process claims but also to leverage predictive analytics for identifying high-cost claimants and implementing targeted wellness programs, thereby achieving significant cost containment.
- This strategic reliance on TPA expertise is reshaping the industry, with technology, especially AI and data analytics, becoming a cornerstone for enhancing fraud detection, improving claims accuracy, and delivering value beyond basic administration, all while navigating an increasingly complex regulatory and competitive landscape.
What will be the Size of the Insurance Third Party Administrators Market during the forecast period?
Get Key Insights on Market Forecast (PDF) Get Free Sample
How is the Insurance Third Party Administrators Market Segmented?
The insurance third party administrators industry research report provides comprehensive data (region-wise segment analysis), with forecasts and estimates in "USD million" for the period 2026-2030, as well as historical data from 2020-2024 for the following segments.
- Service type
- Health plan administrators
- Workers compensation TPA
- Third party claims administration
- Type
- Large enterprises
- Small and medium enterprise
- Service
- Claims management
- Policy management
- Commission management
- Application
- Healthcare
- Construction
- Real estate
- Hospitality
- Others
- Geography
- North America
- US
- Canada
- Mexico
- APAC
- China
- Japan
- India
- Europe
- Germany
- UK
- France
- Middle East and Africa
- Saudi Arabia
- UAE
- South Africa
- South America
- Brazil
- Argentina
- Rest of World (ROW)
- North America
By Service Type Insights
The health plan administrators segment is estimated to witness significant growth during the forecast period.
The Insurance Third Party Administrators Market is segmented by service type, type, and geography. Health plan administration constitutes a critical segment, where TPAs serve self-funded employers by managing complex health benefit plans.
These entities offer customized solutions, navigating intricate regulations like ERISA and HIPAA, and are instrumental in cost containment.
The adoption of advanced data analytics and utilization management systems is revolutionizing this sector, enabling sophisticated risk analysis and population health management tools.
For example, TPAs leveraging medical bill review services and analytics have improved claims payment automation and accuracy by over 20%.
This evolution transforms TPAs from administrative bodies into strategic partners in managing employee health and containing spiraling healthcare expenditures through effective self-funded plan administration.
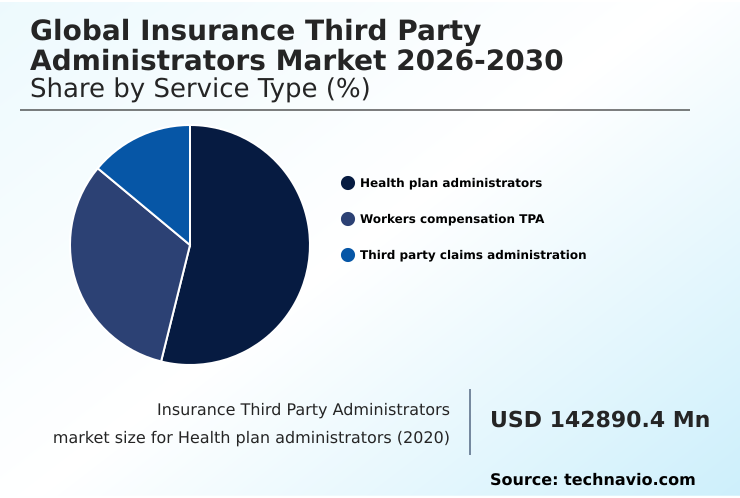
The Health plan administrators segment was valued at USD 175.39 billion in 2024 and showed a gradual increase during the forecast period.
Regional Analysis
North America is estimated to contribute 43.2% to the growth of the global market during the forecast period.Technavio’s analysts have elaborately explained the regional trends and drivers that shape the market during the forecast period.
See How Insurance Third Party Administrators Market Demand is Rising in North America Get Free Sample
The geographic landscape of the market is characterized by a mature North America market and a rapidly expanding APAC region.
North America, led by the United States, accounts for over 43% of the market's incremental growth, driven by a complex healthcare system and the prevalence of self-funded health plans managed by property and casualty TPA firms.
Meanwhile, the APAC market is projected to grow at the fastest rate, with a CAGR of 7.3%, fueled by rising insurance penetration.
The technological divide is also notable; for instance, the deployment of generative AI in North America has been shown to reduce claims processing times by up to 40%.
In contrast, TPAs in many APAC countries are focused on building foundational digital claims intake platforms and provider network optimization to manage escalating volumes.
Market Dynamics
Our researchers analyzed the data with 2025 as the base year, along with the key drivers, trends, and challenges. A holistic analysis of drivers will help companies refine their marketing strategies to gain a competitive advantage.
- For organizations evaluating the Global Insurance Third Party Administrators Market 2026-2030, the central question is how to choose a TPA that aligns with strategic goals. Understanding the benefits of using a TPA begins with assessing internal capabilities versus the specialized expertise offered externally.
- A review of a workers compensation TPA services list or a comparison of top health plan administrator companies reveals a wide variance in offerings. Key differentiators often lie in TPA software and platform solutions, which are critical for improving claims processing with automation.
- The role of AI in claims management is no longer a future trend but a present-day reality, fundamentally changing how TPAs help in cost containment. When considering TPA vs ASO in healthcare, the decision often hinges on the level of risk and control a company wishes to retain.
- For insurers, outsourcing policy management for insurers to a TPA can free up significant internal resources. However, decision-makers must also weigh the challenges in third party administration, including potential cybersecurity risks for insurance TPAs.
- The future trends in TPA services point toward deeper specialization, with distinct TPA for property and casualty insurance and solutions tailored for both managing claims for large enterprises and TPA for small and medium enterprises.
- Firms leveraging advanced data analytics tools for TPAs often see a reduction in fraudulent claims that is double that of firms relying on manual reviews, demonstrating a clear ROI on technology investment. Ultimately, calculating the true cost of outsourcing claims administration requires a holistic view of both fees and long-term value.
What are the key market drivers leading to the rise in the adoption of Insurance Third Party Administrators Industry?
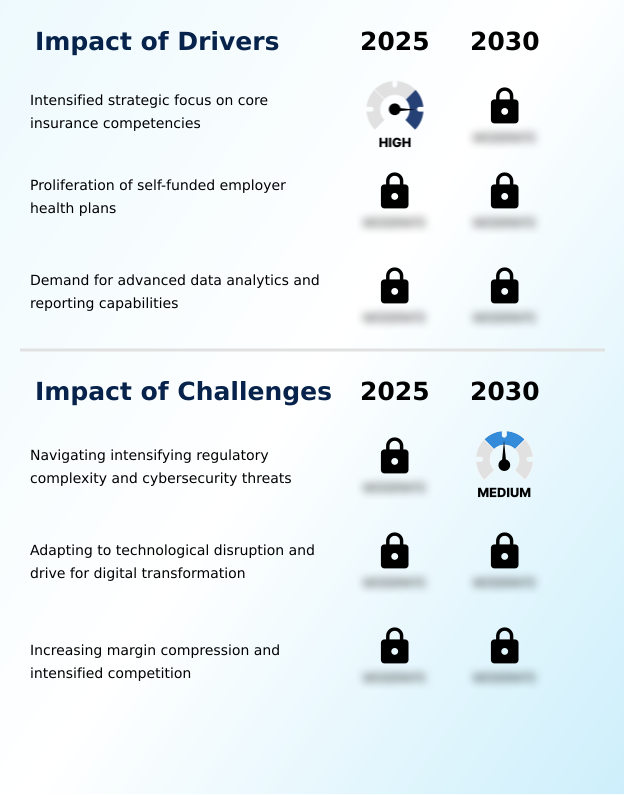
- The market is primarily driven by the intensified strategic focus of insurance carriers on their core competencies.
- The market's growth is primarily fueled by insurers' strategic focus on core competencies and the proliferation of self-funded health plans. By engaging in outsourced claims processing services, carriers can redirect resources from administrative tasks to high-value activities like underwriting.
- Companies that outsource to a TPA report an average of 15% reduction in administrative overhead. Simultaneously, the rise of managing self-insured health plans creates a critical need for expert benefits enrollment systems and claims management solutions.
- Employers leveraging TPA-provided data analytics have been able to lower their annual healthcare cost trends by up to 5% compared to industry averages, highlighting the tangible financial benefits driving the demand for TPA services for insurance carriers and employee benefits administration outsourcing.
What are the market trends shaping the Insurance Third Party Administrators Industry?
- A key market trend is the accelerated integration of artificial intelligence and advanced analytics. This is transforming core TPA functions and enhancing operational efficiency.
- Key trends shaping the market include deepening specialization and the expansion into value-added services. As insurers seek partners with specific domain knowledge, the demand for niche market TPA specialists and TPA for workers compensation is intensifying.
- This move beyond core administration is evident as TPAs integrate services like care management and predictive analytics, with platforms using AI in claims adjudication demonstrating an 18% improvement in fraud detection accuracy. This strategic shift is transforming the TPA role from a processing center to a data-driven partner in risk management outsourcing.
- Consequently, TPAs focusing on specialized areas, such as complex casualty insurance, report customer satisfaction scores up to 25% higher than generalist providers, underscoring the value of targeted expertise and robust insurance administrative services.
What challenges does the Insurance Third Party Administrators Industry face during its growth?
- A key challenge affecting industry growth is navigating the intensifying complexity of regulations and increasing cybersecurity threats.
- Navigating margin compression and significant cybersecurity for insurance administrators are primary challenges in the market. Intense competition leads to price-based differentiation, forcing many TPAs to operate with thin profit margins, while the cost of maintaining regulatory compliance for TPAs has risen by over 50% in recent years.
- This financial pressure is compounded by the threat of data breaches, which demand constant investment in security infrastructure. Despite these pressures, leading firms are countering the trend of TPA vs in-house administration by focusing on operational excellence through automation.
- These top-quartile providers achieve up to 20% greater operational efficiency, enabling them to invest in integrated disability management and other high-value offerings while maintaining profitability.
Exclusive Technavio Analysis on Customer Landscape
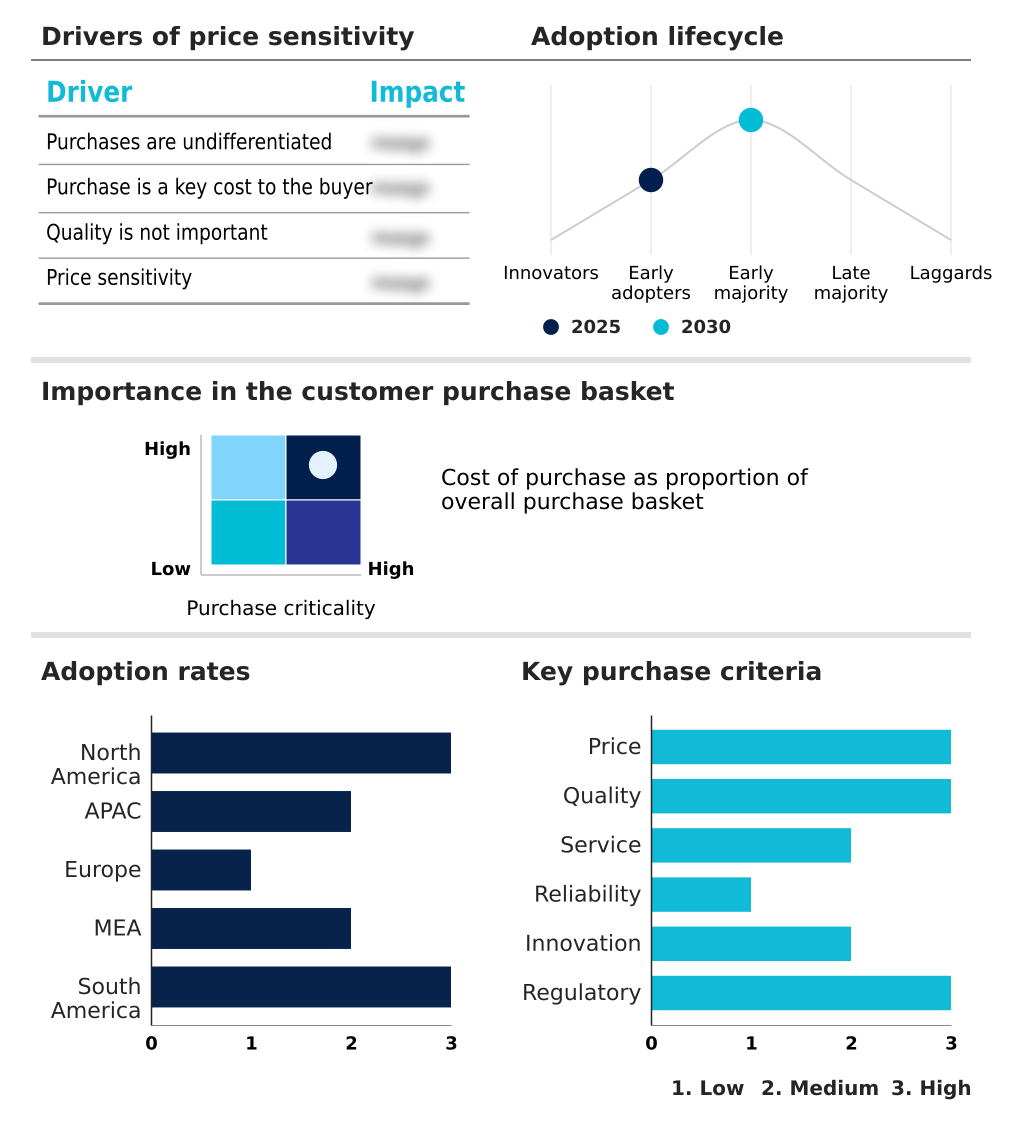
The insurance third party administrators market forecasting report includes the adoption lifecycle of the market, covering from the innovator’s stage to the laggard’s stage. It focuses on adoption rates in different regions based on penetration. Furthermore, the insurance third party administrators market report also includes key purchase criteria and drivers of price sensitivity to help companies evaluate and develop their market growth analysis strategies.
Customer Landscape of Insurance Third Party Administrators Industry
Competitive Landscape
Companies are implementing various strategies, such as strategic alliances, insurance third party administrators market forecast, partnerships, mergers and acquisitions, geographical expansion, and product/service launches, to enhance their presence in the industry.
CCMSI - Specializing in customized claims management, the company provides tailored solutions for workers compensation and liability programs, focusing on client-specific risk control strategies.
The industry research and growth report includes detailed analyses of the competitive landscape of the market and information about key companies, including:
- CCMSI
- Charles Taylor Ltd.
- Chubb Ltd.
- Corvel Corp.
- CVS Health Corp.
- Davies Group
- ExlService Holdings Inc.
- Gallagher Bassett
- Genpact Ltd.
- HealthComp LLC
- NTT DATA Corp.
- Sedgwick
- Sun Life Financial Inc.
- The Cigna Group
- Trustmark
- United Health Group Inc.
- Verity Solutions Group Inc.
Qualitative and quantitative analysis of companies has been conducted to help clients understand the wider business environment as well as the strengths and weaknesses of key industry players. Data is qualitatively analyzed to categorize companies as pure play, category-focused, industry-focused, and diversified; it is quantitatively analyzed to categorize companies as dominant, leading, strong, tentative, and weak.
Recent Development and News in Insurance third party administrators market
- In August 2024, Sedgwick announced the deployment of an AI-powered platform to automate the intake and triage for property and casualty claims, aiming to reduce initial response times.
- In October 2024, Davies Group completed the strategic acquisition of a niche TPA, expanding its capabilities into the specialized cyber insurance claims administration market.
- In November 2024, Davies Group significantly expanded its North American footprint by acquiring SCM Insurance Services, Canada's largest independent claims and risk solutions provider.
- In February 2025, Sedgwick enhanced its viaOne digital portal with a generative AI feature that automatically creates claims summaries to improve efficiency for claims professionals.
Dive into Technavio’s robust research methodology, blending expert interviews, extensive data synthesis, and validated models for unparalleled Insurance Third Party Administrators Market insights. See full methodology.
| Market Scope | |
|---|---|
| Page number | 318 |
| Base year | 2025 |
| Historic period | 2020-2024 |
| Forecast period | 2026-2030 |
| Growth momentum & CAGR | Accelerate at a CAGR of 6.8% |
| Market growth 2026-2030 | USD 135137.4 million |
| Market structure | Fragmented |
| YoY growth 2025-2026(%) | 6.5% |
| Key countries | US, Canada, Mexico, China, Japan, India, South Korea, Australia, Indonesia, Germany, UK, France, Italy, Spain, The Netherlands, Saudi Arabia, UAE, South Africa, Turkey, Israel, Brazil, Argentina and Chile |
| Competitive landscape | Leading Companies, Market Positioning of Companies, Competitive Strategies, and Industry Risks |
Research Analyst Overview
- The Insurance Third Party Administrators Market is evolving from a transactional service industry into a hub of technological innovation and strategic risk management. The core function is shifting beyond basic claims payment automation and disability claims processing to a more integrated model encompassing population health management tools and actuarial support services.
- Leading providers are leveraging claims adjudication software, benefits administration platforms, and medical case management software to offer a holistic service. This requires significant investment in a cloud-based TPA infrastructure and a robust strategy for legacy system modernization.
- The adoption of predictive analytics for claims, AI-powered fraud detection, and robotic process automation in insurance is now a key competitive differentiator, particularly in complex areas like workers compensation claims management and catastrophic claims management.
- Boardroom decisions increasingly center on whether to partner with TPAs that provide not only ERISA compliance solutions and HIPAA compliant data handling but also sophisticated subrogation and recovery services and claims leakage analysis. For instance, the use of generative AI has been proven to reduce claims summary generation times by over 40%, directly impacting operational efficiency and underwriting support services.
- This technological integration is critical for effective provider network optimization, medical bill review services, and general liability claims adjusting.
What are the Key Data Covered in this Insurance Third Party Administrators Market Research and Growth Report?
-
What is the expected growth of the Insurance Third Party Administrators Market between 2026 and 2030?
-
USD 135.14 billion, at a CAGR of 6.8%
-
-
What segmentation does the market report cover?
-
The report is segmented by Service Type (Health plan administrators, Workers compensation TPA, and Third party claims administration), Type (Large enterprises, and Small and medium enterprise), Service (Claims management, Policy management, and Commission management), Application (Healthcare, Construction, Real estate, Hospitality, and Others) and Geography (North America, APAC, Europe, Middle East and Africa, South America)
-
-
Which regions are analyzed in the report?
-
North America, APAC, Europe, Middle East and Africa and South America
-
-
What are the key growth drivers and market challenges?
-
Intensified strategic focus on core insurance competencies, Navigating intensifying regulatory complexity and cybersecurity threats
-
-
Who are the major players in the Insurance Third Party Administrators Market?
-
CCMSI, Charles Taylor Ltd., Chubb Ltd., Corvel Corp., CVS Health Corp., Davies Group, ExlService Holdings Inc., Gallagher Bassett, Genpact Ltd., HealthComp LLC, NTT DATA Corp., Sedgwick, Sun Life Financial Inc., The Cigna Group, Trustmark, United Health Group Inc. and Verity Solutions Group Inc.
-
Market Research Insights
- The market dynamics are shifting from basic administrative outsourcing to strategic partnerships, driven by the demand for value-added TPA services. TPA services for insurance carriers now extend beyond transactional tasks, with a focus on cost containment in healthcare claims and integrated risk management.
- Firms offering advanced outsourced claims processing services report client retention rates up to 15% higher than those providing only basic administration. Furthermore, the adoption of sophisticated TPA technology platforms allows for greater claims processing efficiency, with some providers achieving a 30% reduction in cycle times.
- This evolution highlights a competitive landscape where data analytics in claims handling and customized TPA solutions are becoming standard expectations for both large enterprises and small businesses.
We can help! Our analysts can customize this insurance third party administrators market research report to meet your requirements.
 RIA -
RIA - 
