Intelligent Remote Terminal Unit Market Analysis Europe, North America, APAC, Middle East and Africa, South America - US, Germany, UK, China, Italy, Canada, Japan, France, India, South Korea - Size and Forecast 2025-2029

Intelligent Remote Terminal Unit Market Analysis Europe, North America, APAC, Middle East and Africa, South America - US, Germany, UK, China, Italy, Canada, Japan, France, India, South Korea - Size and Forecast 2025-2029

Published: Dec 2024 213 Pages SKU: IRTNTR41635

Market Overview at a Glance

$2.70 B
Market Opportunity
8%
CAGR
6.9
YoY growth 2024-2025(%)

What is the Intelligent Remote Terminal Unit Market Size?

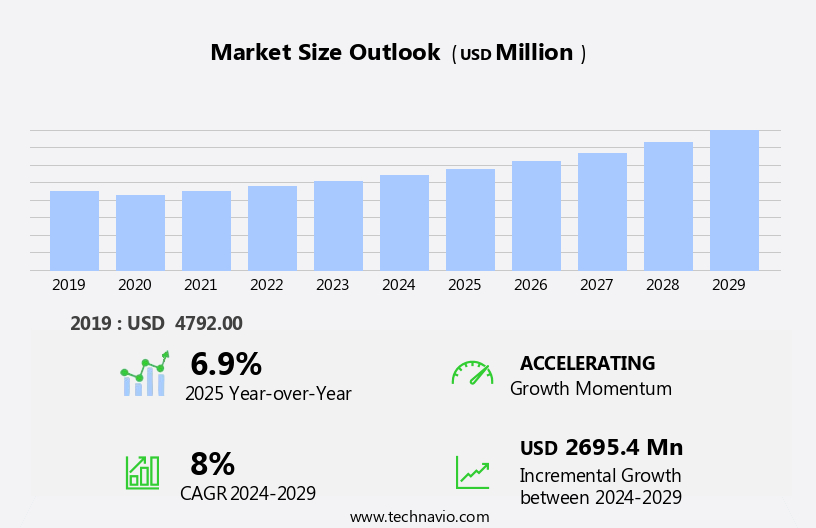
The intelligent remote terminal unit market size is forecast to increase by USD 2.70 billion at a CAGR of 8% between 2024 and 2029. The Intelligent Remote Terminal Unit (RTU) market is experiencing significant growth due to the increasing need for remote monitoring in industrial facilities. This trend is driven by the benefits of real-time data collection and analysis, which enable efficient operations and preventive maintenance. Another key trend is the growing adoption of Supervisory Control and Data Acquisition (SCADA) systems in water monitoring applications, as they offer improved automation and data management capabilities. However, the market also faces challenges, including inadequate cybersecurity measures in the SCADA system, which pose a significant risk to data integrity and system reliability. As a result, there is a pressing need for advanced security solutions to protect against cyber threats and ensure the safe and effective operation of Intelligent RTUs.

What will be the size of Market during the forecast period?

Intelligent Remote Terminal Unit Market Size

Request Free Intelligent Remote Terminal Unit Market Sample

Market Segmentation

The market report provides comprehensive data (region-wise segment analysis), with forecasts and estimates in "USD million" for the period 2025-2029, as well as historical data from 2019 - 2023 for the following segments.
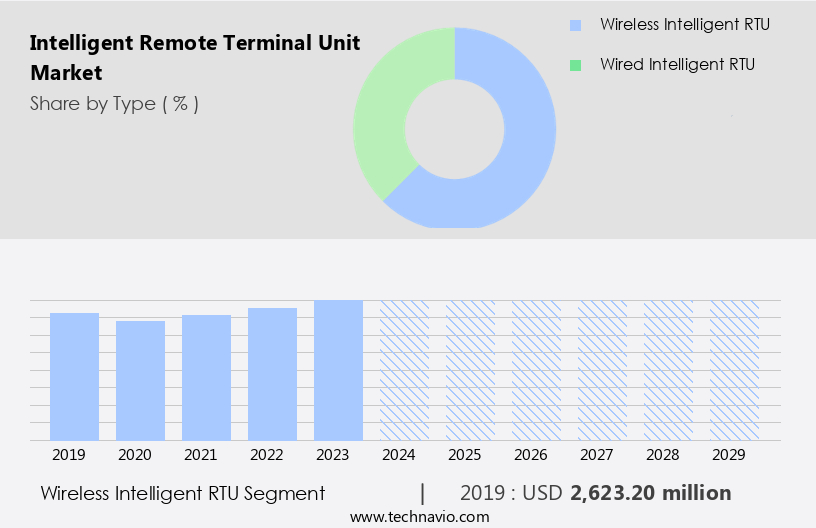
  • Type
    • Wireless intelligent RTU
    • Wired intelligent RTU
  • End-user
    • Oil and gas
    • Power generation
    • Chemical
    • Water and wastewater
    • Others
  • Geography
    • Europe
      • Germany
      • UK
      • Italy
    • North America
      • US
    • APAC
      • China
    • Middle East and Africa
    • South America

Which is the largest segment driving market growth?

The oil and gas segment is estimated to witness significant growth during the forecast period. Intelligent Remote Terminal Units (IRTUs) serve a pivotal function in various industries, particularly in sectors where remote monitoring, control, and automation are indispensable, such as the oil and gas industry. IRTUs function as control terminal devices at wellheads, facilitating real-time monitoring of essential parameters including pressure, temperature, flow rates, and fluid levels. They enable remote control of valves and chokes, optimizing production rates while ensuring safety and environmental compliance. In tank farms, IRTUs are instrumental in monitoring liquid levels, temperatures, and densities of stored commodities like crude oil, refined products, and chemicals. These devices automate inventory management, optimize storage capacity utilization, and ensure adherence to safety regulations for handling hazardous materials.

Intelligent Remote Terminal Unit Market Size

Get a glance at the market share of various regions. Download the PDF Sample

The oil and gas segment was valued at USD 2.62 billion in 2019. and showed a gradual increase during the forecast period. Furthermore, deployed at the sensor network layer, IRTUs interact with the transmission network layer through network interfaces. They collect sensor data and convert it into IP data or serial port data for transmission via communication networks. IRTUs employ various communication protocols, including GPRS/CDMA, for remote communication. IRTUs are equipped with microprocessors, power supplies, and I/O devices for executing control functions, such as analog input/output, remote control, remote signaling, remote adjustment, and central monitoring. They support event-triggered cycles and are integral to automation devices, smart grid systems, and telemetry systems, as well as smart city systems.

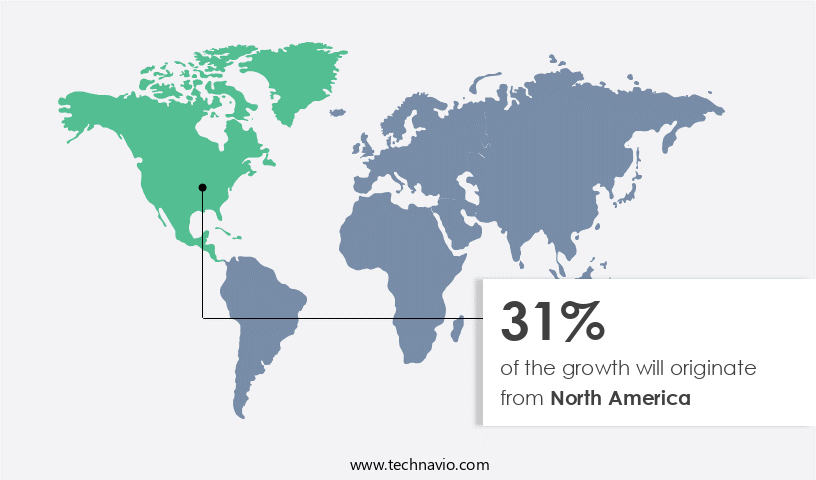
Which region is leading the market?

Intelligent Remote Terminal Unit Market Share by Geography

For more insights on the market share of various regions, Request Free Sample

North America is estimated to contribute 31% to the growth of the global market during the forecast period. Technavio's analysts have elaborately explained the regional trends and drivers that shape the market during the forecast period. The market in Europe is experiencing significant growth, driven by investments in various end-user industries, including power generation, agriculture, telecommunications, water and wastewater treatment, and oil and gas. Among these, the power generation sector is a major contributor to the market's growth, with Europe's increasing focus on renewable energy sources, such as wind and solar, driving demand for IRTUs. Developed economies in Europe, such as Germany and the UK, are leading the way in renewable energy investments, with offshore wind installations accounting for approximately one-fifth of Europe's gross annual wind installations in 2021. Additionally, the agriculture sector is also adopting IRTUs to optimize irrigation and monitor livestock, while the telecommunications industry is utilizing IRTUs to enhance network connectivity and efficiency.

How do company ranking index and market positioning come to your aid?

Companies are implementing various strategies, such as strategic alliances, partnerships, mergers and acquisitions, geographical expansion, and product/service launches, to enhance their presence in the market.

ABB Ltd.: The company offers intelligent remote terminal units such as RTU500 series that enables secure and strong fleet management with the 12.6 release.

Technavio provides the ranking index for the top 20 companies along with insights on the market positioning of:

  • Advantech Co. Ltd.
  • Eaton Corp plc
  • Emerson Electric Co.
  • Enilit Ltd.
  • General Electric Co.
  • Honeywell International Inc.
  • ICP DAS CO. LTD.
  • Kalki Communication Technologies Pvt. Ltd.
  • Mitsubishi Electric Corp.
  • Motorola Solutions Inc.
  • Moxa Inc.
  • Remsdaq Ltd.
  • Schneider Electric SE
  • Schweitzer Engineering Laboratories Inc.
  • Siemens AG
  • Spectris Plc
  • WAGO GmbH and Co. KG
  • Westercom s.r.o
  • Yokogawa Electric Corp.

Explore our company rankings and market positioning. Request Free Sample

How can Technavio assist you in making critical decisions?

Intelligent Remote Terminal Unit Market Size

What is the market structure and year-over-year growth of the Intelligent Remote Terminal Unit Market?

Market structure

Fragmented

YoY growth 2024-2025

6.9

Market Dynamics

The market is rapidly expanding, driven by the growing need for automation and real-time monitoring in sectors like water and wastewater management. The network interface and intelligent terminal device are key components in enhancing system efficiency, allowing seamless integration with Data Transfer Unit (DTU) and wireless terminal device. These devices enable reliable data transmission link, ensuring smooth communication across remote sites. The use of Programmable Logic Controllers (PLCs) in these systems automates processes, offering precise control over operations. Additionally, abnormal alarm are essential in these systems, notifying operators of potential issues before they escalate. The market's growth is fueled by the demand for improved operational efficiency and enhanced system reliability across industries. Our researchers analyzed the data with 2024 as the base year, along with the key drivers, trends, and challenges. A holistic analysis of drivers will help companies refine their marketing strategies to gain a competitive advantage.

What are the primary factors driving the market growth?

Growing need for remote monitoring in industrial facilities is the key factor driving the market growth. In today's industrial landscape, managing and maintaining asset efficiency in remote locations presents a significant challenge. The high energy costs associated with these operations necessitate continuous monitoring and maintenance to prevent downtime and minimize revenue loss. However, the harsh working conditions in some locations pose risks to employees and limit connectivity, making remote asset management a complex task. Intelligent Remote Terminal Units (RTUs) offer a solution to these challenges by providing remote data acquisition, control functions, and communication capabilities. These devices, which include wireless terminal devices and control terminal units, interact with sensor networks at the sensor network layer and transmission network layer.

They collect sensor data, format it, and transmit it via data transmission links, such as serial port data, IP data, or GPRS/CDMA. Intelligent terminal devices are equipped with microprocessors, power supplies, and I/O devices that enable remote control, remote signaling, remote adjustment, and central monitoring. They support various communication protocols, including event-triggered cycles, and can be integrated with automation devices, smart grid systems, telemetry systems, and smart city systems. By automating data collection and interaction, intelligent RTUs improve operational efficiency, reduce the need for on-site maintenance, and enhance overall asset performance. Thus, such factors are driving the growth of the market during the forecast period.

What are the significant trends being witnessed in the market?

Growing adoption of SCADA in water monitoring is the primary trend shaping the market growth. In response to the escalating demand for water due to population growth and urbanization, as well as the depletion of new freshwater resources, the water and wastewater industry has witnessed a significant increase in the adoption of Supervisory Control and Data Acquisition (SCADA) systems. These systems enable remote data acquisition, facility monitoring, and operation control through intelligent terminal devices connected via communication networks. The sensor network layer and transmission network layer facilitate the collection and transmission of sensor data, including abnormal alarms and fault status, from microprocessors and I/O devices. Communication protocols such as GPRS/CDMA are utilized for remote communication, data collection, and format conversion. SCADA systems play a crucial role in automating water and wastewater plants, allowing for event-triggered cycles and remote control of equipment, including pumps and filtration units. Additionally, these systems are integral to smart grid systems, telemetry systems, and smart city systems, enhancing the overall efficiency and sustainability of water infrastructure. Thus, such trends will shape the growth of the market during the forecast period.

What are the major market challenges?

Inadequate cybersecurity measures in SCADA systems is the major challenge that impedes market growth. The market is witnessing significant growth due to the increasing adoption of advanced automation technologies in various industries. These RTUs, which function as control terminal devices at the sensor network and transmission network layers, facilitate remote data acquisition, communication networks, and operation control. Equipped with microprocessors, power supplies, and I/O devices, these wireless or serial port data transmitting terminal devices enable facility monitoring, status monitoring, and equipment control. Communication networks, including GPRS/CDMA, support data transmission links and format conversion for the interaction of sensor data and IP data. Remote control, remote signaling, remote adjustment, and central monitoring are essential control functions offered by these devices. Abnormal alarms and fault status are critical data collected by the RTUs for smart grid systems, telemetry systems, and smart city systems.

However, the increasing use of connected devices and communication protocols in the industrial automation landscape has led to an increased number of interfaces and interactions, posing significant security risks. Cybersecurity threats, such as data hacking and alteration, can disrupt operations and compromise critical infrastructure, including power grids, wastewater plants, and oil and gas facilities. Therefore, ensuring potent cybersecurity measures and implementing event-triggered cycles for automation devices is crucial in mitigating these risks. Hence, the above factors will impede the growth of the market during the forecast period.

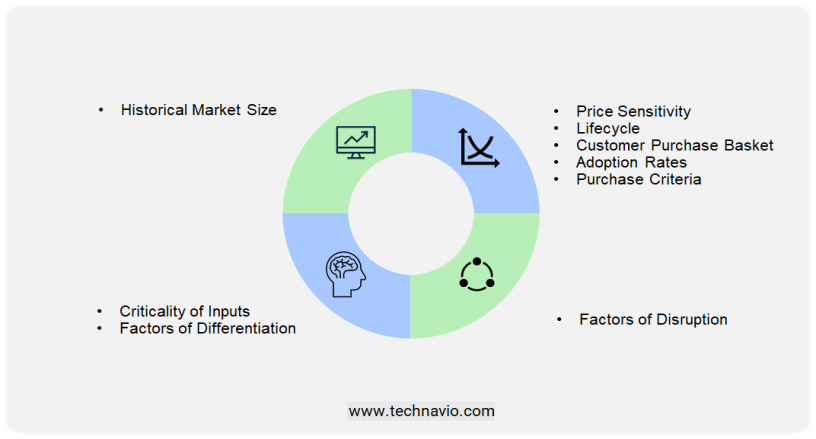
Exclusive Customer Landscape

The market forecasting report includes the adoption lifecycle of the market, covering from the innovator's stage to the laggard's stage. The market forecast report focuses on adoption rates in different regions based on penetration and market trends. Furthermore, the market research and growth report also includes key purchase criteria and drivers of price sensitivity to help companies evaluate and develop their market growth analysis strategies.
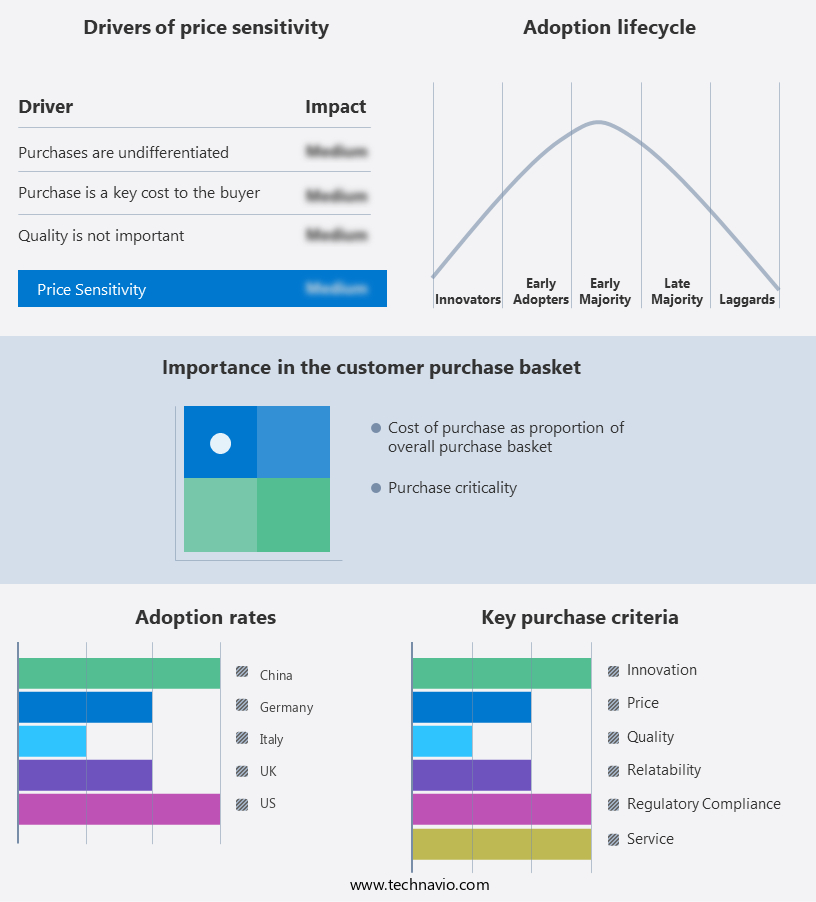
Intelligent Remote Terminal Unit Market Share by Geography

 Customer Landscape

Market Analyst Overview

The market is witnessing significant growth due to the increasing adoption of control terminals in various industries, particularly in the Internet of Things (IoT) sector. These intelligent terminal devices play a crucial role in the sensor network and transmission network layers of IoT systems, facilitating data interaction, operation control, and central monitoring. RTUs are designed to process and store data from various sensors, ensuring data encryption, transmission, and data processing efficiency. They feature network interfaces for IP data and port data communication, microprocessors for data processing, and output modules for remote control, remote signaling, and remote adjustment. Intelligent RTUs support wired and wireless communication, power supplies, and telemetry capabilities, making them ideal for facility monitoring applications in industries such as oil and gas, power, and water and wastewater. They enable real-time data transmission and data processing, enhancing overall system performance and reliability. These devices are integral components of SCADA systems, providing signal input and output functions, ensuring seamless data exchange between various system components and enabling efficient communication between remote and central control systems. With the growing importance of data security and privacy, intelligent RTUs are increasingly being equipped with advanced data encryption features to protect sensitive information during transmission.

Market Scope

Report Coverage

Details

Page number

213

Base year

2024

Historic period

2019 - 2023

Forecast period

2025-2029

Growth momentum & CAGR

Accelerate at a CAGR of 8%

Market growth 2025-2029

USD 2.70 billion

Regional analysis

Europe, North America, APAC, Middle East and Africa, and South America

Performing market contribution

North America at 31%

Key countries

US, Germany, UK, China, and Italy

Competitive landscape

Leading Companies, Market Positioning of Companies, Competitive Strategies, and Industry Risks

Key companies profiled

ABB Ltd., Advantech Co. Ltd., Eaton Corp plc, Emerson Electric Co., Enilit Ltd., General Electric Co., Honeywell International Inc., ICP DAS CO. LTD., Kalki Communication Technologies Pvt. Ltd., Mitsubishi Electric Corp., Motorola Solutions Inc., Moxa Inc., Remsdaq Ltd., Schneider Electric SE, Schweitzer Engineering Laboratories Inc., Siemens AG, Spectris Plc, WAGO GmbH and Co. KG, Westercom s.r.o, and Yokogawa Electric Corp.

Market Segmentation

Type (Wireless intelligent RTU and Wired intelligent RTU), End-user (Oil and gas, Power generation, Chemical, Water and wastewater, and Others), and Geography (Europe, North America, APAC, Middle East and Africa, and South America)

Customization purview

If our report has not included the data that you are looking for, you can reach out to our analysts and get segments customized.

Download PDF Sample

What are the Key Data Covered in this Market Research Report?

  • CAGR of the market during the forecast period
  • Detailed information on factors that will drive the market growth and forecasting between 2025 and 2029
  • Precise estimation of the size of the market  and its contribution of the market in focus to the parent market
  • Accurate predictions about upcoming market growth and trends and changes in consumer behavior
  • Growth of the market across Europe, North America, APAC, Middle East and Africa, and South America
  • Thorough analysis of the market's competitive landscape and detailed information about companies
  • Comprehensive analysis of factors that will challenge the growth of market companies

1 Executive Summary

  • 1.1 Market overview
    • Executive Summary - Chart on Market Overview
    • Executive Summary - Data Table on Market Overview
    • Executive Summary - Chart on Global Market Characteristics
    • Executive Summary - Chart on Market by Geography
    • Executive Summary - Chart on Market Segmentation by Type
    • Executive Summary - Chart on Market Segmentation by End-user
    • Executive Summary - Chart on Incremental Growth
    • Executive Summary - Data Table on Incremental Growth
    • Executive Summary - Chart on Company Market Positioning

2 Technavio Analysis

  • 2.1 Analysis of price sensitivity, lifecycle, customer purchase basket, adoption rates, and purchase criteria
    • Analysis of price sensitivity, lifecycle, customer purchase basket, adoption rates, and purchase criteria
  • 2.2 Criticality of inputs and Factors of differentiation
    • Overview on criticality of inputs and factors of differentiation
  • 2.3 Factors of disruption
    • Overview on factors of disruption
  • 2.4 Impact of drivers and challenges
    • Impact of drivers and challenges in 2024 and 2029

3 Market Landscape

  • 3.1 Market ecosystem
    • Parent Market
    • Data Table on - Parent Market
  • 3.2 Market characteristics
    • Market characteristics analysis
  • 3.3 Value chain analysis
    • Value chain analysis

4 Market Sizing

  • 4.1 Market definition
    • Offerings of companies included in the market definition
  • 4.2 Market segment analysis
    • Market segments
  • 4.3 Market size 2024
    • 4.4 Market outlook: Forecast for 2024-2029
      • Chart on Global - Market size and forecast 2024-2029 ($ million)
      • Data Table on Global - Market size and forecast 2024-2029 ($ million)
      • Chart on Global Market: Year-over-year growth 2024-2029 (%)
      • Data Table on Global Market: Year-over-year growth 2024-2029 (%)

    5 Historic Market Size

    • 5.1 Global Intelligent Remote Terminal Unit Market 2019 - 2023
      • Historic Market Size - Data Table on Global Intelligent Remote Terminal Unit Market 2019 - 2023 ($ million)
    • 5.2 Type segment analysis 2019 - 2023
      • Historic Market Size - Type Segment 2019 - 2023 ($ million)
    • 5.3 End-user segment analysis 2019 - 2023
      • Historic Market Size - End-user Segment 2019 - 2023 ($ million)
    • 5.4 Geography segment analysis 2019 - 2023
      • Historic Market Size - Geography Segment 2019 - 2023 ($ million)
    • 5.5 Country segment analysis 2019 - 2023
      • Historic Market Size - Country Segment 2019 - 2023 ($ million)

    6 Qualitative Analysis

    • 6.1 Impact of AI on Global Intelligent Remote Terminal Unit Market

      7 Five Forces Analysis

      • 7.1 Five forces summary
        • Five forces analysis - Comparison between 2024 and 2029
      • 7.2 Bargaining power of buyers
        • Bargaining power of buyers - Impact of key factors 2024 and 2029
      • 7.3 Bargaining power of suppliers
        • Bargaining power of suppliers - Impact of key factors in 2024 and 2029
      • 7.4 Threat of new entrants
        • Threat of new entrants - Impact of key factors in 2024 and 2029
      • 7.5 Threat of substitutes
        • Threat of substitutes - Impact of key factors in 2024 and 2029
      • 7.6 Threat of rivalry
        • Threat of rivalry - Impact of key factors in 2024 and 2029
      • 7.7 Market condition
        • Chart on Market condition - Five forces 2024 and 2029

      8 Market Segmentation by Type

      • 8.1 Market segments
        • Chart on Type - Market share 2024-2029 (%)
        • Data Table on Type - Market share 2024-2029 (%)
      • 8.2 Comparison by Type
        • Chart on Comparison by Type
        • Data Table on Comparison by Type
      • 8.3 Wireless intelligent RTU - Market size and forecast 2024-2029
        • Chart on Wireless intelligent RTU - Market size and forecast 2024-2029 ($ million)
        • Data Table on Wireless intelligent RTU - Market size and forecast 2024-2029 ($ million)
        • Chart on Wireless intelligent RTU - Year-over-year growth 2024-2029 (%)
        • Data Table on Wireless intelligent RTU - Year-over-year growth 2024-2029 (%)
      • 8.4 Wired intelligent RTU - Market size and forecast 2024-2029
        • Chart on Wired intelligent RTU - Market size and forecast 2024-2029 ($ million)
        • Data Table on Wired intelligent RTU - Market size and forecast 2024-2029 ($ million)
        • Chart on Wired intelligent RTU - Year-over-year growth 2024-2029 (%)
        • Data Table on Wired intelligent RTU - Year-over-year growth 2024-2029 (%)
      • 8.5 Market opportunity by Type
        • Market opportunity by Type ($ million)
        • Data Table on Market opportunity by Type ($ million)

      9 Market Segmentation by End-user

      • 9.1 Market segments
        • Chart on End-user - Market share 2024-2029 (%)
        • Data Table on End-user - Market share 2024-2029 (%)
      • 9.2 Comparison by End-user
        • Chart on Comparison by End-user
        • Data Table on Comparison by End-user
      • 9.3 Oil and gas - Market size and forecast 2024-2029
        • Chart on Oil and gas - Market size and forecast 2024-2029 ($ million)
        • Data Table on Oil and gas - Market size and forecast 2024-2029 ($ million)
        • Chart on Oil and gas - Year-over-year growth 2024-2029 (%)
        • Data Table on Oil and gas - Year-over-year growth 2024-2029 (%)
      • 9.4 Power generation - Market size and forecast 2024-2029
        • Chart on Power generation - Market size and forecast 2024-2029 ($ million)
        • Data Table on Power generation - Market size and forecast 2024-2029 ($ million)
        • Chart on Power generation - Year-over-year growth 2024-2029 (%)
        • Data Table on Power generation - Year-over-year growth 2024-2029 (%)
      • 9.5 Chemical - Market size and forecast 2024-2029
        • Chart on Chemical - Market size and forecast 2024-2029 ($ million)
        • Data Table on Chemical - Market size and forecast 2024-2029 ($ million)
        • Chart on Chemical - Year-over-year growth 2024-2029 (%)
        • Data Table on Chemical - Year-over-year growth 2024-2029 (%)
      • 9.6 Water and wastewater - Market size and forecast 2024-2029
        • Chart on Water and wastewater - Market size and forecast 2024-2029 ($ million)
        • Data Table on Water and wastewater - Market size and forecast 2024-2029 ($ million)
        • Chart on Water and wastewater - Year-over-year growth 2024-2029 (%)
        • Data Table on Water and wastewater - Year-over-year growth 2024-2029 (%)
      • 9.7 Others - Market size and forecast 2024-2029
        • Chart on Others - Market size and forecast 2024-2029 ($ million)
        • Data Table on Others - Market size and forecast 2024-2029 ($ million)
        • Chart on Others - Year-over-year growth 2024-2029 (%)
        • Data Table on Others - Year-over-year growth 2024-2029 (%)
      • 9.8 Market opportunity by End-user
        • Market opportunity by End-user ($ million)
        • Data Table on Market opportunity by End-user ($ million)

      10 Customer Landscape

      • 10.1 Customer landscape overview
        • Analysis of price sensitivity, lifecycle, customer purchase basket, adoption rates, and purchase criteria

      11 Geographic Landscape

      • 11.1 Geographic segmentation
        • Chart on Market share by geography 2024-2029 (%)
        • Data Table on Market share by geography 2024-2029 (%)
      • 11.2 Geographic comparison
        • Chart on Geographic comparison
        • Data Table on Geographic comparison
      • 11.3 Europe - Market size and forecast 2024-2029
        • Chart on Europe - Market size and forecast 2024-2029 ($ million)
        • Data Table on Europe - Market size and forecast 2024-2029 ($ million)
        • Chart on Europe - Year-over-year growth 2024-2029 (%)
        • Data Table on Europe - Year-over-year growth 2024-2029 (%)
      • 11.4 North America - Market size and forecast 2024-2029
        • Chart on North America - Market size and forecast 2024-2029 ($ million)
        • Data Table on North America - Market size and forecast 2024-2029 ($ million)
        • Chart on North America - Year-over-year growth 2024-2029 (%)
        • Data Table on North America - Year-over-year growth 2024-2029 (%)
      • 11.5 APAC - Market size and forecast 2024-2029
        • Chart on APAC - Market size and forecast 2024-2029 ($ million)
        • Data Table on APAC - Market size and forecast 2024-2029 ($ million)
        • Chart on APAC - Year-over-year growth 2024-2029 (%)
        • Data Table on APAC - Year-over-year growth 2024-2029 (%)
      • 11.6 Middle East and Africa - Market size and forecast 2024-2029
        • Chart on Middle East and Africa - Market size and forecast 2024-2029 ($ million)
        • Data Table on Middle East and Africa - Market size and forecast 2024-2029 ($ million)
        • Chart on Middle East and Africa - Year-over-year growth 2024-2029 (%)
        • Data Table on Middle East and Africa - Year-over-year growth 2024-2029 (%)
      • 11.7 South America - Market size and forecast 2024-2029
        • Chart on South America - Market size and forecast 2024-2029 ($ million)
        • Data Table on South America - Market size and forecast 2024-2029 ($ million)
        • Chart on South America - Year-over-year growth 2024-2029 (%)
        • Data Table on South America - Year-over-year growth 2024-2029 (%)
      • 11.8 US - Market size and forecast 2024-2029
        • Chart on US - Market size and forecast 2024-2029 ($ million)
        • Data Table on US - Market size and forecast 2024-2029 ($ million)
        • Chart on US - Year-over-year growth 2024-2029 (%)
        • Data Table on US - Year-over-year growth 2024-2029 (%)
      • 11.9 Germany - Market size and forecast 2024-2029
        • Chart on Germany - Market size and forecast 2024-2029 ($ million)
        • Data Table on Germany - Market size and forecast 2024-2029 ($ million)
        • Chart on Germany - Year-over-year growth 2024-2029 (%)
        • Data Table on Germany - Year-over-year growth 2024-2029 (%)
      • 11.10 UK - Market size and forecast 2024-2029
        • Chart on UK - Market size and forecast 2024-2029 ($ million)
        • Data Table on UK - Market size and forecast 2024-2029 ($ million)
        • Chart on UK - Year-over-year growth 2024-2029 (%)
        • Data Table on UK - Year-over-year growth 2024-2029 (%)
      • 11.11 China - Market size and forecast 2024-2029
        • Chart on China - Market size and forecast 2024-2029 ($ million)
        • Data Table on China - Market size and forecast 2024-2029 ($ million)
        • Chart on China - Year-over-year growth 2024-2029 (%)
        • Data Table on China - Year-over-year growth 2024-2029 (%)
      • 11.12 Italy - Market size and forecast 2024-2029
        • Chart on Italy - Market size and forecast 2024-2029 ($ million)
        • Data Table on Italy - Market size and forecast 2024-2029 ($ million)
        • Chart on Italy - Year-over-year growth 2024-2029 (%)
        • Data Table on Italy - Year-over-year growth 2024-2029 (%)
      • 11.13 Canada - Market size and forecast 2024-2029
        • Chart on Canada - Market size and forecast 2024-2029 ($ million)
        • Data Table on Canada - Market size and forecast 2024-2029 ($ million)
        • Chart on Canada - Year-over-year growth 2024-2029 (%)
        • Data Table on Canada - Year-over-year growth 2024-2029 (%)
      • 11.14 Japan - Market size and forecast 2024-2029
        • Chart on Japan - Market size and forecast 2024-2029 ($ million)
        • Data Table on Japan - Market size and forecast 2024-2029 ($ million)
        • Chart on Japan - Year-over-year growth 2024-2029 (%)
        • Data Table on Japan - Year-over-year growth 2024-2029 (%)
      • 11.15 France - Market size and forecast 2024-2029
        • Chart on France - Market size and forecast 2024-2029 ($ million)
        • Data Table on France - Market size and forecast 2024-2029 ($ million)
        • Chart on France - Year-over-year growth 2024-2029 (%)
        • Data Table on France - Year-over-year growth 2024-2029 (%)
      • 11.16 India - Market size and forecast 2024-2029
        • Chart on India - Market size and forecast 2024-2029 ($ million)
        • Data Table on India - Market size and forecast 2024-2029 ($ million)
        • Chart on India - Year-over-year growth 2024-2029 (%)
        • Data Table on India - Year-over-year growth 2024-2029 (%)
      • 11.17 South Korea - Market size and forecast 2024-2029
        • Chart on South Korea - Market size and forecast 2024-2029 ($ million)
        • Data Table on South Korea - Market size and forecast 2024-2029 ($ million)
        • Chart on South Korea - Year-over-year growth 2024-2029 (%)
        • Data Table on South Korea - Year-over-year growth 2024-2029 (%)
      • 11.18 Market opportunity by geography
        • Market opportunity by geography ($ million)
        • Data Tables on Market opportunity by geography ($ million)

      12 Drivers, Challenges, and Opportunity/Restraints

      • 12.1 Market drivers
        • 12.2 Market challenges
          • 12.3 Impact of drivers and challenges
            • Impact of drivers and challenges in 2024 and 2029
          • 12.4 Market opportunities/restraints

            13 Competitive Landscape

            • 13.1 Overview
              • 13.2 Competitive Landscape
                • Overview on criticality of inputs and factors of differentiation
              • 13.3 Landscape disruption
                • Overview on factors of disruption
              • 13.4 Industry risks
                • Impact of key risks on business

              14 Competitive Analysis

              • 14.1 Companies profiled
                • Companies covered
              • 14.2 Company ranking index
                • Company ranking index
              • 14.3 Market positioning of companies
                • Matrix on companies position and classification
              • 14.4 ABB Ltd.
                • ABB Ltd. - Overview
                • ABB Ltd. - Business segments
                • ABB Ltd. - Key news
                • ABB Ltd. - Key offerings
                • ABB Ltd. - Segment focus
                • SWOT
              • 14.5 Advantech Co. Ltd.
                • Advantech Co. Ltd. - Overview
                • Advantech Co. Ltd. - Business segments
                • Advantech Co. Ltd. - Key news
                • Advantech Co. Ltd. - Key offerings
                • Advantech Co. Ltd. - Segment focus
                • SWOT
              • 14.6 Eaton Corp plc
                • Eaton Corp plc - Overview
                • Eaton Corp plc - Business segments
                • Eaton Corp plc - Key news
                • Eaton Corp plc - Key offerings
                • Eaton Corp plc - Segment focus
                • SWOT
              • 14.7 Emerson Electric Co.
                • Emerson Electric Co. - Overview
                • Emerson Electric Co. - Business segments
                • Emerson Electric Co. - Key news
                • Emerson Electric Co. - Key offerings
                • Emerson Electric Co. - Segment focus
                • SWOT
              • 14.8 General Electric Co.
                • General Electric Co. - Overview
                • General Electric Co. - Business segments
                • General Electric Co. - Key news
                • General Electric Co. - Key offerings
                • General Electric Co. - Segment focus
                • SWOT
              • 14.9 Honeywell International Inc.
                • Honeywell International Inc. - Overview
                • Honeywell International Inc. - Business segments
                • Honeywell International Inc. - Key news
                • Honeywell International Inc. - Key offerings
                • Honeywell International Inc. - Segment focus
                • SWOT
              • 14.10 Mitsubishi Electric Corp.
                • Mitsubishi Electric Corp. - Overview
                • Mitsubishi Electric Corp. - Business segments
                • Mitsubishi Electric Corp. - Key offerings
                • Mitsubishi Electric Corp. - Segment focus
                • SWOT
              • 14.11 Motorola Solutions Inc.
                • Motorola Solutions Inc. - Overview
                • Motorola Solutions Inc. - Business segments
                • Motorola Solutions Inc. - Key news
                • Motorola Solutions Inc. - Key offerings
                • Motorola Solutions Inc. - Segment focus
                • SWOT
              • 14.12 Moxa Inc.
                • Moxa Inc. - Overview
                • Moxa Inc. - Product / Service
                • Moxa Inc. - Key offerings
                • SWOT
              • 14.13 Schneider Electric SE
                • Schneider Electric SE - Overview
                • Schneider Electric SE - Business segments
                • Schneider Electric SE - Key news
                • Schneider Electric SE - Key offerings
                • Schneider Electric SE - Segment focus
                • SWOT
              • 14.14 Schweitzer Engineering Laboratories Inc.
                • Schweitzer Engineering Laboratories Inc. - Overview
                • Schweitzer Engineering Laboratories Inc. - Product / Service
                • Schweitzer Engineering Laboratories Inc. - Key offerings
                • SWOT
              • 14.15 Siemens AG
                • Siemens AG - Overview
                • Siemens AG - Business segments
                • Siemens AG - Key news
                • Siemens AG - Key offerings
                • Siemens AG - Segment focus
                • SWOT
              • 14.16 WAGO GmbH and Co. KG
                • WAGO GmbH and Co. KG - Overview
                • WAGO GmbH and Co. KG - Product / Service
                • WAGO GmbH and Co. KG - Key offerings
                • SWOT
              • 14.17 Westercom s.r.o
                • Westercom s.r.o - Overview
                • Westercom s.r.o - Product / Service
                • Westercom s.r.o - Key offerings
                • SWOT
              • 14.18 Yokogawa Electric Corp.
                • Yokogawa Electric Corp. - Overview
                • Yokogawa Electric Corp. - Business segments
                • Yokogawa Electric Corp. - Key news
                • Yokogawa Electric Corp. - Key offerings
                • Yokogawa Electric Corp. - Segment focus
                • SWOT

              15 Appendix

              • 15.1 Scope of the report
                • 15.2 Inclusions and exclusions checklist
                  • Inclusions checklist
                  • Exclusions checklist
                • 15.3 Currency conversion rates for US$
                  • Currency conversion rates for US$
                • 15.4 Research methodology
                  • Research methodology
                • 15.5 Data procurement
                  • Information sources
                • 15.6 Data validation
                  • Data validation
                • 15.7 Validation techniques employed for market sizing
                  • Validation techniques employed for market sizing
                • 15.8 Data synthesis
                  • Data synthesis
                • 15.9 360 degree market analysis
                  • 360 degree market analysis
                • 15.10 List of abbreviations
                  • List of abbreviations

                Research Methodology

                Technavio presents a detailed picture of the market by way of study, synthesis, and summation of data from multiple sources. The analysts have presented the various facets of the market with a particular focus on identifying the key industry influencers. The data thus presented is comprehensive, reliable, and the result of extensive research, both primary and secondary.

                INFORMATION SOURCES

                Primary sources

                • Manufacturers and suppliers
                • Channel partners
                • Industry experts
                • Strategic decision makers

                Secondary sources

                • Industry journals and periodicals
                • Government data
                • Financial reports of key industry players
                • Historical data
                • Press releases

                DATA ANALYSIS

                Data Synthesis

                • Collation of data
                • Estimation of key figures
                • Analysis of derived insights

                Data Validation

                • Triangulation with data models
                • Reference against proprietary databases
                • Corroboration with industry experts

                REPORT WRITING

                Qualitative

                • Market drivers
                • Market challenges
                • Market trends
                • Five forces analysis

                Quantitative

                • Market size and forecast
                • Market segmentation
                • Geographical insights
                • Competitive landscape

                Interested in this report?

                Get your sample now to see our research methodology and insights!

                Download Now

                Frequently Asked Questions

                Intelligent Remote Terminal Unit market growth will increase by $ 2695.4 mn during 2025-2029.

                The Intelligent Remote Terminal Unit market is expected to grow at a CAGR of 8% during 2025-2029.

                Intelligent Remote Terminal Unit market is segmented by Type( Wireless intelligent RTU, Wired intelligent RTU, Chemical, Water and wastewater, Others) End-user( Oil and gas, Power generation, Chemical, Water and wastewater, Others)

                ABB Ltd., Advantech Co. Ltd., Eaton Corp plc, Emerson Electric Co., Enilit Ltd., General Electric Co., Honeywell International Inc., ICP DAS CO. LTD., Kalki Communication Technologies Pvt. Ltd., Mitsubishi Electric Corp., Motorola Solutions Inc., Moxa Inc., Remsdaq Ltd., Schneider Electric SE, Schweitzer Engineering Laboratories Inc., Siemens AG, Spectris Plc, WAGO GmbH and Co. KG, Westercom s.r.o, Yokogawa Electric Corp. are a few of the key vendors in the Intelligent Remote Terminal Unit market.

                North America will register the highest growth rate of 31% among the other regions. Therefore, the Intelligent Remote Terminal Unit market in North America is expected to garner significant business opportunities for the vendors during the forecast period.

                US, Germany, UK, China, Italy

                • Growing need for remote monitoring in industrial facilitiesIndustries is the driving factor this market.
                • particularly asset-intensive ones is the driving factor this market.
                • face the issue of achieving high operating efficiency while still ensuring that vital assets are adequately maintained. The high energy cost means that even a small disruption can lead to the failure of critical assets is the driving factor this market.
                • leading to high revenue loss. Therefore is the driving factor this market.
                • industries have to manage these assets periodically to avoid any shutdown or downtime in the process. Monitoring and managing these assets become even more difficult in remote locations where it is difficult for operators to work owing to hostile working conditions. In some of these conditions is the driving factor this market.
                • employees may be exposed to high risk. In certain working conditions is the driving factor this market.
                • environmental forces and climatic conditions may require real-time monitoring is the driving factor this market.
                • while in some working environments is the driving factor this market.
                • connectivity may be a constraint. Furthermore is the driving factor this market.
                • maintenance and upgrading in such remote locations becomes highly cost intensive.IRTUs offer proper maintenance and effective management of assets. Whether these assets are machinery or equipment located in a remote plant or an industrial facility is the driving factor this market.
                • an IRTU provides complete visibility of the asset. Vendors are also offering remote monitoring solutions with IRTUs with improved capability. For instance is the driving factor this market.
                • Advantech ADAM-3600 IRTU features the Intelligent Connectivity Diagnosis Manager that can remotely monitor the serial and Ethernet ports status and send alarm information. In the event of a repair is the driving factor this market.
                • adjustment is the driving factor this market.
                • or any asset-related issue is the driving factor this market.
                • the operator does not have to go to the site. Instead is the driving factor this market.
                • the monitoring and maintenance can be done via the Internet is the driving factor this market.
                • and the data collected can be accessed through a cloud server. This helps with significant monetary savings owing to a smaller number of emergency visits and fast system upgrades. Such advanced products are expected to further drive the need for remote monitoring during the forecast period is the driving factor this market.
                • thereby propelling the growth of the global intelligent remote terminal unit market. is the driving factor this market.

                The Intelligent Remote Terminal Unit market vendors should focus on grabbing business opportunities from the Wireless intelligent RTU segment as it accounted for the largest market share in the base year.
                RIA - Research AI Assistant
                Ask RIA