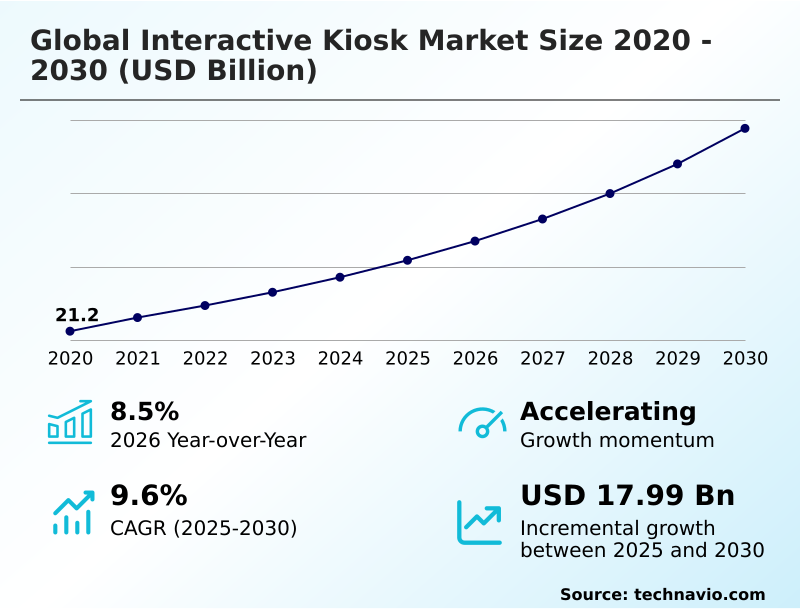
Interactive Kiosk Market Size 2026-2030
The interactive kiosk market size is valued to increase by USD 17.99 billion, at a CAGR of 9.6% from 2025 to 2030. Enhanced customer experience and growing demand for self-service will drive the interactive kiosk market.
Major Market Trends & Insights
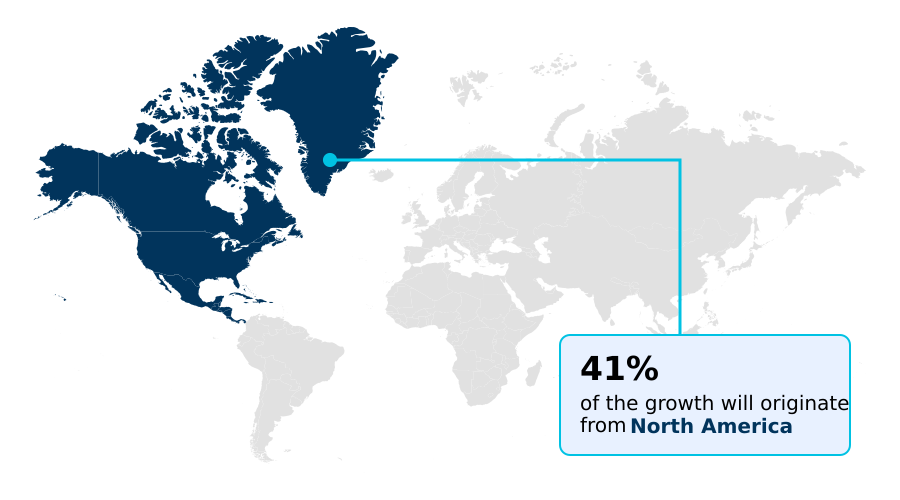
- North America dominated the market and accounted for a 41% growth during the forecast period.
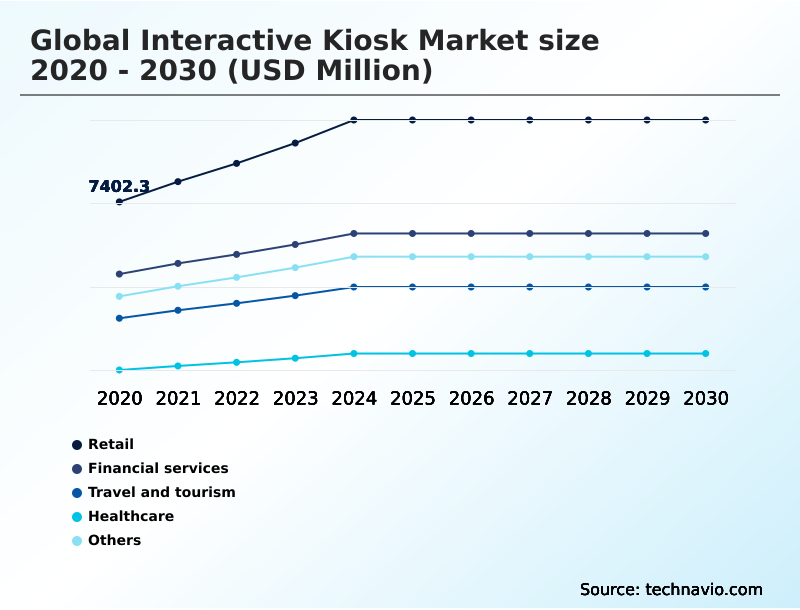
- By End-user - Retail segment was valued at USD 10.27 billion in 2024
- By Component - Services segment accounted for the largest market revenue share in 2024
Market Size & Forecast
- Market Opportunities: USD 27.65 billion
- Market Future Opportunities: USD 17.99 billion
- CAGR from 2025 to 2030 : 9.6%
Market Summary
- The interactive kiosk market is defined by a strategic shift toward intelligent, interconnected self-service platforms. Businesses are moving beyond basic transactional terminals to deploy sophisticated systems that enhance customer autonomy and drive operational efficiency. This evolution is propelled by consumer demand for faster, more convenient service and the need for businesses to optimize labor in high-traffic environments.
- Key trends include the integration of AI for personalized interactions and IoT for remote management, alongside the development of touchless interfaces using voice and gesture controls. For instance, a large hospitality chain can deploy self-check-in systems that not only reduce front-desk queues but also collect valuable guest preference data, allowing for personalized service offerings during current and future stays.
- However, realizing these benefits requires overcoming challenges such as high initial capital investment, complex integration with existing enterprise software, and the constant need to address cybersecurity threats and ensure compliance with data privacy regulations like GDPR. The market’s trajectory is toward creating a seamless omnichannel experience where kiosks serve as a critical, data-rich touchpoint between a business and its customers.
What will be the Size of the Interactive Kiosk Market during the forecast period?
Get Key Insights on Market Forecast (PDF) Get Free Sample
How is the Interactive Kiosk Market Segmented?
The interactive kiosk industry research report provides comprehensive data (region-wise segment analysis), with forecasts and estimates in "USD million" for the period 2026-2030, as well as historical data from 2020-2024 for the following segments.
- End-user
- Retail
- Financial services
- Travel and tourism
- Healthcare
- Others
- Component
- Services
- Hardware
- Software
- Type
- Bank kiosks
- Self service kiosks
- Vending kiosks
- Geography
- North America
- US
- Canada
- Mexico
- APAC
- China
- Japan
- India
- Europe
- Germany
- UK
- France
- Middle East and Africa
- Saudi Arabia
- UAE
- South Africa
- South America
- Brazil
- Argentina
- Colombia
- Rest of World (ROW)
- North America
By End-user Insights
The retail segment is estimated to witness significant growth during the forecast period.
The retail segment leads adoption, driven by the need to create a unified omnichannel retail integration that merges physical and digital storefronts.
Deployments of self-checkout solutions and retail self-ordering kiosks are standard, but the strategy has evolved to include endless aisle retail solutions and interactive product catalogs.
These platforms leverage sophisticated user interface design and peripheral device integration to offer services beyond simple transactions. A well-executed content management system delivers targeted promotions, while transactional data analytics inform inventory and store layout decisions.
This focus on experience and efficiency, where custom kiosk design for unattended retail solutions can slash wait times by a factor of six, underscores the technology’s strategic value in enhancing customer engagement and optimizing in-store operations through secure payment kiosks.
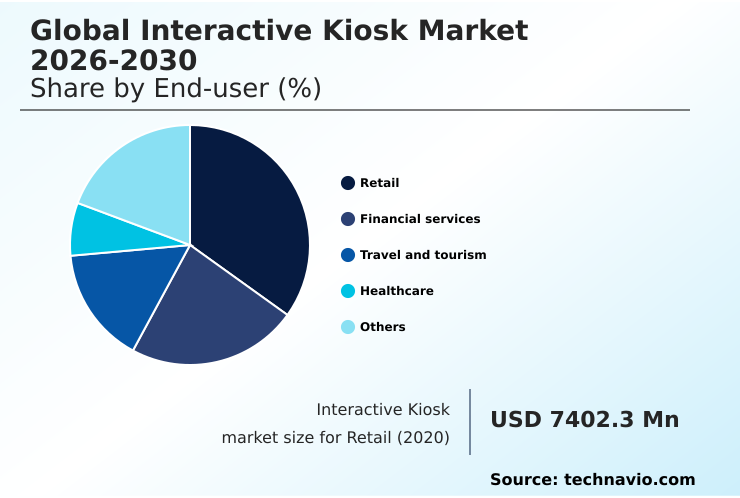
The Retail segment was valued at USD 10.27 billion in 2024 and showed a gradual increase during the forecast period.
Regional Analysis
North America is estimated to contribute 41% to the growth of the global market during the forecast period.Technavio’s analysts have elaborately explained the regional trends and drivers that shape the market during the forecast period.
See How Interactive Kiosk Market Demand is Rising in North America Get Free Sample
The global landscape is characterized by varied adoption drivers, with mature markets focusing on sophisticated modular hardware design and advanced software.
In North America, there is a push for video teller machines and wayfinding kiosk applications enhanced with natural language processing. European deployments prioritize data security and contactless payment systems, often seen in extensive ticketing kiosk systems.
In APAC, rapid urbanization fuels demand for patient-check-in systems and large-scale public service terminals that utilize biometric authentication and facial recognition technology.
Deployment of outdoor kiosk solutions and bill payment kiosk systems is expanding in emerging economies to increase service accessibility.
Across regions, a common goal is improving user experience, with cinema ticketing kiosks and campus information kiosks both seeing adoption of more intuitive interfaces, while gaming and loyalty kiosks leverage interactivity to boost engagement.
In some advanced regions, over 80% of routine banking transactions are now migrated to self-service channels.
Market Dynamics
Our researchers analyzed the data with 2025 as the base year, along with the key drivers, trends, and challenges. A holistic analysis of drivers will help companies refine their marketing strategies to gain a competitive advantage.
- The evolution of the interactive kiosk market is increasingly defined by deep integration and intelligent automation. The focus is now on integrating kiosks with backend ERP systems, a move that improves data consistency and operational visibility. This connectivity is crucial for ai-powered retail upselling kiosks, which rely on real-time inventory and customer data to make relevant offers.
- The push for hygienic interaction has accelerated development in touchless kiosk interface technology, including gesture control for hygienic interaction and voice recognition for accessibility, making these platforms central to smart city public service strategies.
- The ability of managing large scale kiosk deployments effectively hinges on cloud-based content deployment and the remote monitoring of kiosk networks, where IoT sensors for predictive maintenance can reduce downtime by over 40% compared to reactive service models. Security and compliance remain paramount, with an emphasis on secure patient data handling kiosks and biometric authentication in banking kiosks.
- To meet these diverse needs, custom software development for kiosks and modular kiosk design for future upgrades are essential. Advanced analytics from kiosk usage provides insights that refine the omnichannel strategy using retail kiosks and improve durable outdoor kiosk enclosures.
- This shift transforms automated retail vending solutions from simple dispensers to data-generating endpoints, highlighting how self-service kiosks for financial inclusion and enhancing customer experience with kiosks are now core to business strategy, addressing both kiosk solutions for reducing operational costs and data privacy compliance for kiosks.
What are the key market drivers leading to the rise in the adoption of Interactive Kiosk Industry?
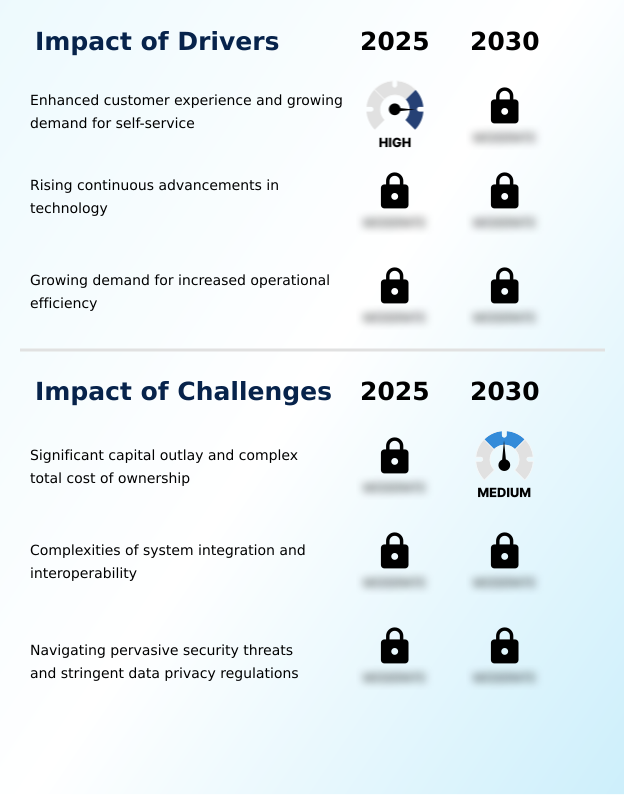
- An enhanced customer experience, driven by the growing demand for convenient and autonomous self-service options, is a key driver of market growth.
- Market growth is fundamentally driven by the pursuit of operational efficiency and enhanced customer experience.
- Businesses are deploying self-service kiosk solutions to meet consumer demand for autonomy, with successful implementations showing that up to 75% of users will choose a self-service option when available.
- This shift dramatically improves service speed, with some hospitality deployments slashing guest wait times by a factor of six.
- The technology is supported by robust hardware, including ruggedized enclosures suitable for high-traffic environments, and sophisticated cloud-based management platform that ensures high uptime.
- Effective backend system integration is critical for ticketing kiosk systems at airports and for automated teller machine networks.
- This push for operational intelligence is seen across sectors, from quick-service restaurant kiosks and hotel self-check-in systems to government service kiosks, all requiring secure kiosk software development to function effectively in providing seamless wayfinding kiosk applications and other services.
What are the market trends shaping the Interactive Kiosk Industry?
- The rapid integration of artificial intelligence and Internet of Things technologies is a defining market trend. This convergence is transforming kiosks into intelligent, interconnected endpoints capable of delivering highly dynamic user experiences.
- Key market trends are redefining self-service technology through advanced intelligence and connectivity. The integration of IoT connectivity enables predictive maintenance, which has been shown to reduce device downtime by up to 30%. Concurrently, remote management software allows for centralized updates and monitoring.
- At the user-facing level, computer vision and biometric security for kiosks are enabling more personalized and secure interactions, while touchless kiosk technology is gaining traction. This includes gesture control interface and voice-activated commands, enhancing accessibility and hygiene. For mobile integration, dynamic QR code generation is used to transfer control to a user's device.
- These trends are transforming platforms like interactive digital signage, smart city information kiosks, and even telehealth kiosk platforms into highly responsive endpoints. Utilizing data analytics for kiosks, businesses can improve forecast accuracy by over 15%, optimizing everything from content delivery to service offerings.
What challenges does the Interactive Kiosk Industry face during its growth?
- A key challenge affecting industry growth is the significant capital outlay required for initial deployment and the complexities of managing the total cost of ownership.
- Significant challenges constrain widespread adoption, primarily revolving around cost, complexity, and security. The initial capital outlay for industrial-grade touchscreens and encrypted payment terminals is substantial. Furthermore, the complexity of system integration can be a major hurdle; ensuring that application programming interfaces communicate flawlessly with legacy systems often increases total ownership costs by over 25%.
- Secure kiosk software development is essential, as each kiosk represents a potential vulnerability. Operators must maintain a secure operating system and ensure secure data encryption for all transactions, especially for healthcare patient check-in kiosks handling electronic health record integration.
- The management of a large kiosk fleet management requires continuous security patching across more than 99% of deployed devices to protect against threats. These factors make custom kiosk manufacturing and maintaining thermal management systems and visitor management systems a resource-intensive endeavor, particularly when dealing with secure financial service automation or smart locker kiosk systems.
Exclusive Technavio Analysis on Customer Landscape
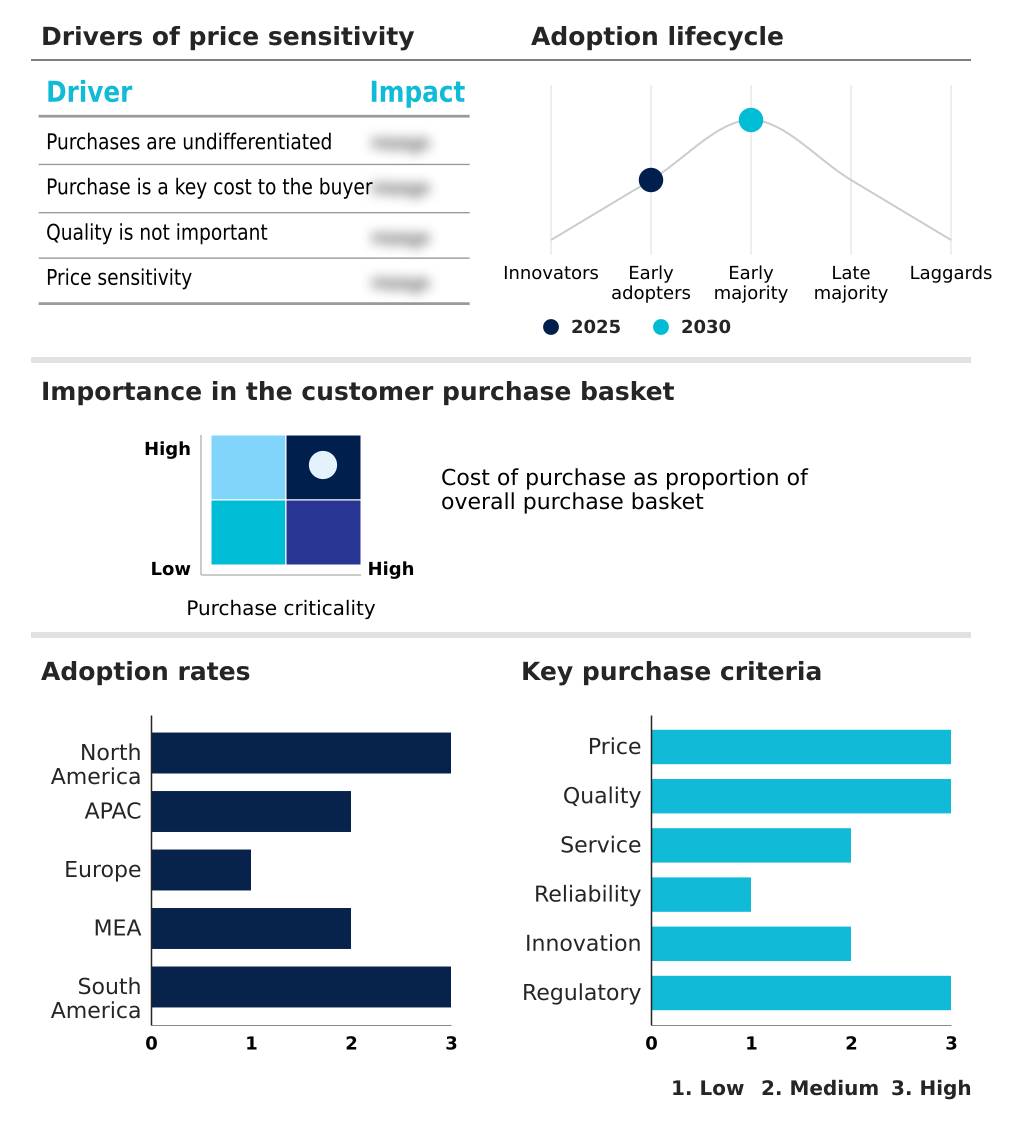
The interactive kiosk market forecasting report includes the adoption lifecycle of the market, covering from the innovator’s stage to the laggard’s stage. It focuses on adoption rates in different regions based on penetration. Furthermore, the interactive kiosk market report also includes key purchase criteria and drivers of price sensitivity to help companies evaluate and develop their market growth analysis strategies.
Customer Landscape of Interactive Kiosk Industry
Competitive Landscape
Companies are implementing various strategies, such as strategic alliances, interactive kiosk market forecast, partnerships, mergers and acquisitions, geographical expansion, and product/service launches, to enhance their presence in the industry.
Advanced Kiosk - Offerings include end-to-end interactive kiosk solutions, providing custom hardware and integrated management software for diverse commercial applications such as wayfinding, ordering, and visitor management.
The industry research and growth report includes detailed analyses of the competitive landscape of the market and information about key companies, including:
- Advanced Kiosk
- AURES Group
- Diebold Nixdorf Incorp.
- DynaTouch Corporation
- Elo Touch Solutions Inc.
- Embross
- Frank Mayer and Associates Inc.
- Glory Ltd.
- KIOSK Information Systems
- LamasaTech Ltd
- Meridian Kiosks
- NCR Voyix Corp.
- Olea Kiosks Inc.
- Peerless Industries Inc.
- Posiflex Technology Inc.
- Pyramid Computer
- RedyRef
- Slabb Kiosks
- Source Technologies
- VeriFone Inc.
Qualitative and quantitative analysis of companies has been conducted to help clients understand the wider business environment as well as the strengths and weaknesses of key industry players. Data is qualitatively analyzed to categorize companies as pure play, category-focused, industry-focused, and diversified; it is quantitatively analyzed to categorize companies as dominant, leading, strong, tentative, and weak.
Recent Development and News in Interactive kiosk market
- In October, 2024, Agilysys announced enhancements to its Agilysys Express Kiosk solutions, designed to help gaming and hospitality properties streamline operations and alleviate staff workload during peak periods.
- In January, 2025, Fiserv Inc. launched its new Clover kiosk, a solution designed to streamline operations and improve the customer experience with self-ordering and payment in quick-service restaurants.
- In February, 2025, Olea Kiosks revealed a partnership with meldCX to deliver more efficient and reliable self-service solutions, with an initial focus on the healthcare industry's patient intake processes.
- In February, 2025, Imply, a Brazilian technology company, announced a partnership with the Gremio football club to implement a comprehensive access control system featuring self-service ticketing kiosks for the team's stadium.
Dive into Technavio’s robust research methodology, blending expert interviews, extensive data synthesis, and validated models for unparalleled Interactive Kiosk Market insights. See full methodology.
| Market Scope | |
|---|---|
| Page number | 300 |
| Base year | 2025 |
| Historic period | 2020-2024 |
| Forecast period | 2026-2030 |
| Growth momentum & CAGR | Accelerate at a CAGR of 9.6% |
| Market growth 2026-2030 | USD 17989.9 million |
| Market structure | Fragmented |
| YoY growth 2025-2026(%) | 8.5% |
| Key countries | US, Canada, Mexico, China, Japan, India, South Korea, Australia, Indonesia, Germany, UK, France, Italy, Spain, The Netherlands, Saudi Arabia, UAE, South Africa, Israel, Turkey, Brazil, Argentina and Colombia |
| Competitive landscape | Leading Companies, Market Positioning of Companies, Competitive Strategies, and Industry Risks |
Research Analyst Overview
- The interactive kiosk market's trajectory is toward highly specialized, intelligent systems. A firm's success now depends on its ability to master both hardware and software, from industrial-grade touchscreens, ruggedized enclosures, and thermal management systems to a secure operating system. Effective deployment requires seamless backend system integration via robust application programming interfaces and a sophisticated cloud-based management platform.
- The user interface design must be intuitive for applications like patient check-in systems and self-ordering systems. The integration of peripherals like encrypted payment terminals and capabilities for electronic health record integration are critical. In boardrooms, the conversation has shifted to data privacy, where ensuring secure data encryption is a top priority to comply with global regulations.
- Non-compliance can lead to severe penalties, making this a critical budgeting consideration. Technologically, the adoption of iot connectivity, computer vision, and natural language processing is standard. We see a focus on predictive maintenance, biometric authentication, and modular hardware design for future-proofing investments.
- Solutions spanning self-checkout solutions, ticketing kiosk systems, omnichannel retail integration, and automated teller machine functionality showcase the market's breadth. For example, businesses leveraging remote management software for their kiosk fleets have reported a 30% reduction in on-site service calls, directly impacting operational costs.
What are the Key Data Covered in this Interactive Kiosk Market Research and Growth Report?
-
What is the expected growth of the Interactive Kiosk Market between 2026 and 2030?
-
USD 17.99 billion, at a CAGR of 9.6%
-
-
What segmentation does the market report cover?
-
The report is segmented by End-user (Retail, Financial services, Travel and tourism, Healthcare, and Others), Component (Services, Hardware, and Software), Type (Bank kiosks, Self service kiosks, and Vending kiosks) and Geography (North America, APAC, Europe, Middle East and Africa, South America)
-
-
Which regions are analyzed in the report?
-
North America, APAC, Europe, Middle East and Africa and South America
-
-
What are the key growth drivers and market challenges?
-
Enhanced customer experience and growing demand for self-service, Significant capital outlay and complex total cost of ownership
-
-
Who are the major players in the Interactive Kiosk Market?
-
Advanced Kiosk, AURES Group, Diebold Nixdorf Incorp., DynaTouch Corporation, Elo Touch Solutions Inc., Embross, Frank Mayer and Associates Inc., Glory Ltd., KIOSK Information Systems, LamasaTech Ltd, Meridian Kiosks, NCR Voyix Corp., Olea Kiosks Inc., Peerless Industries Inc., Posiflex Technology Inc., Pyramid Computer, RedyRef, Slabb Kiosks, Source Technologies and VeriFone Inc.
-
Market Research Insights
- The market’s momentum is fueled by the widespread adoption of self-service kiosk solutions across various sectors. Deployments are increasingly specialized, from airport self-service kiosks and hotel self-check-in systems to unattended retail solutions and government service kiosks.
- In healthcare, patient check-in kiosks have demonstrated the ability to reduce administrative errors by over 30%, while in hospitality, 75% of guests may opt for kiosks, slashing wait times. Quick-service restaurant kiosks, cinema ticketing kiosks, and secure financial service automation platforms are becoming standard.
- This specialization extends to custom kiosk manufacturing for unique use cases like interactive digital signage and secure kiosk software development for bill payment kiosk systems. The emphasis is on tangible ROI, with interactive wayfinding kiosks in large venues improving visitor flow and data analytics for kiosks providing actionable operational insights.
We can help! Our analysts can customize this interactive kiosk market research report to meet your requirements.
 RIA -
RIA - 
