Interface IP Market by End-user, Type and Geography - Forecast and Analysis 2021-2025

Interface IP Market by End-user, Type and Geography - Forecast and Analysis 2021-2025

Published: Sep 2021 120 Pages SKU: IRTNTR43473

Market Overview at a Glance

$343.22 Mn
Market Opportunity
6.98%
CAGR
YoY growth 2020-2021(%)

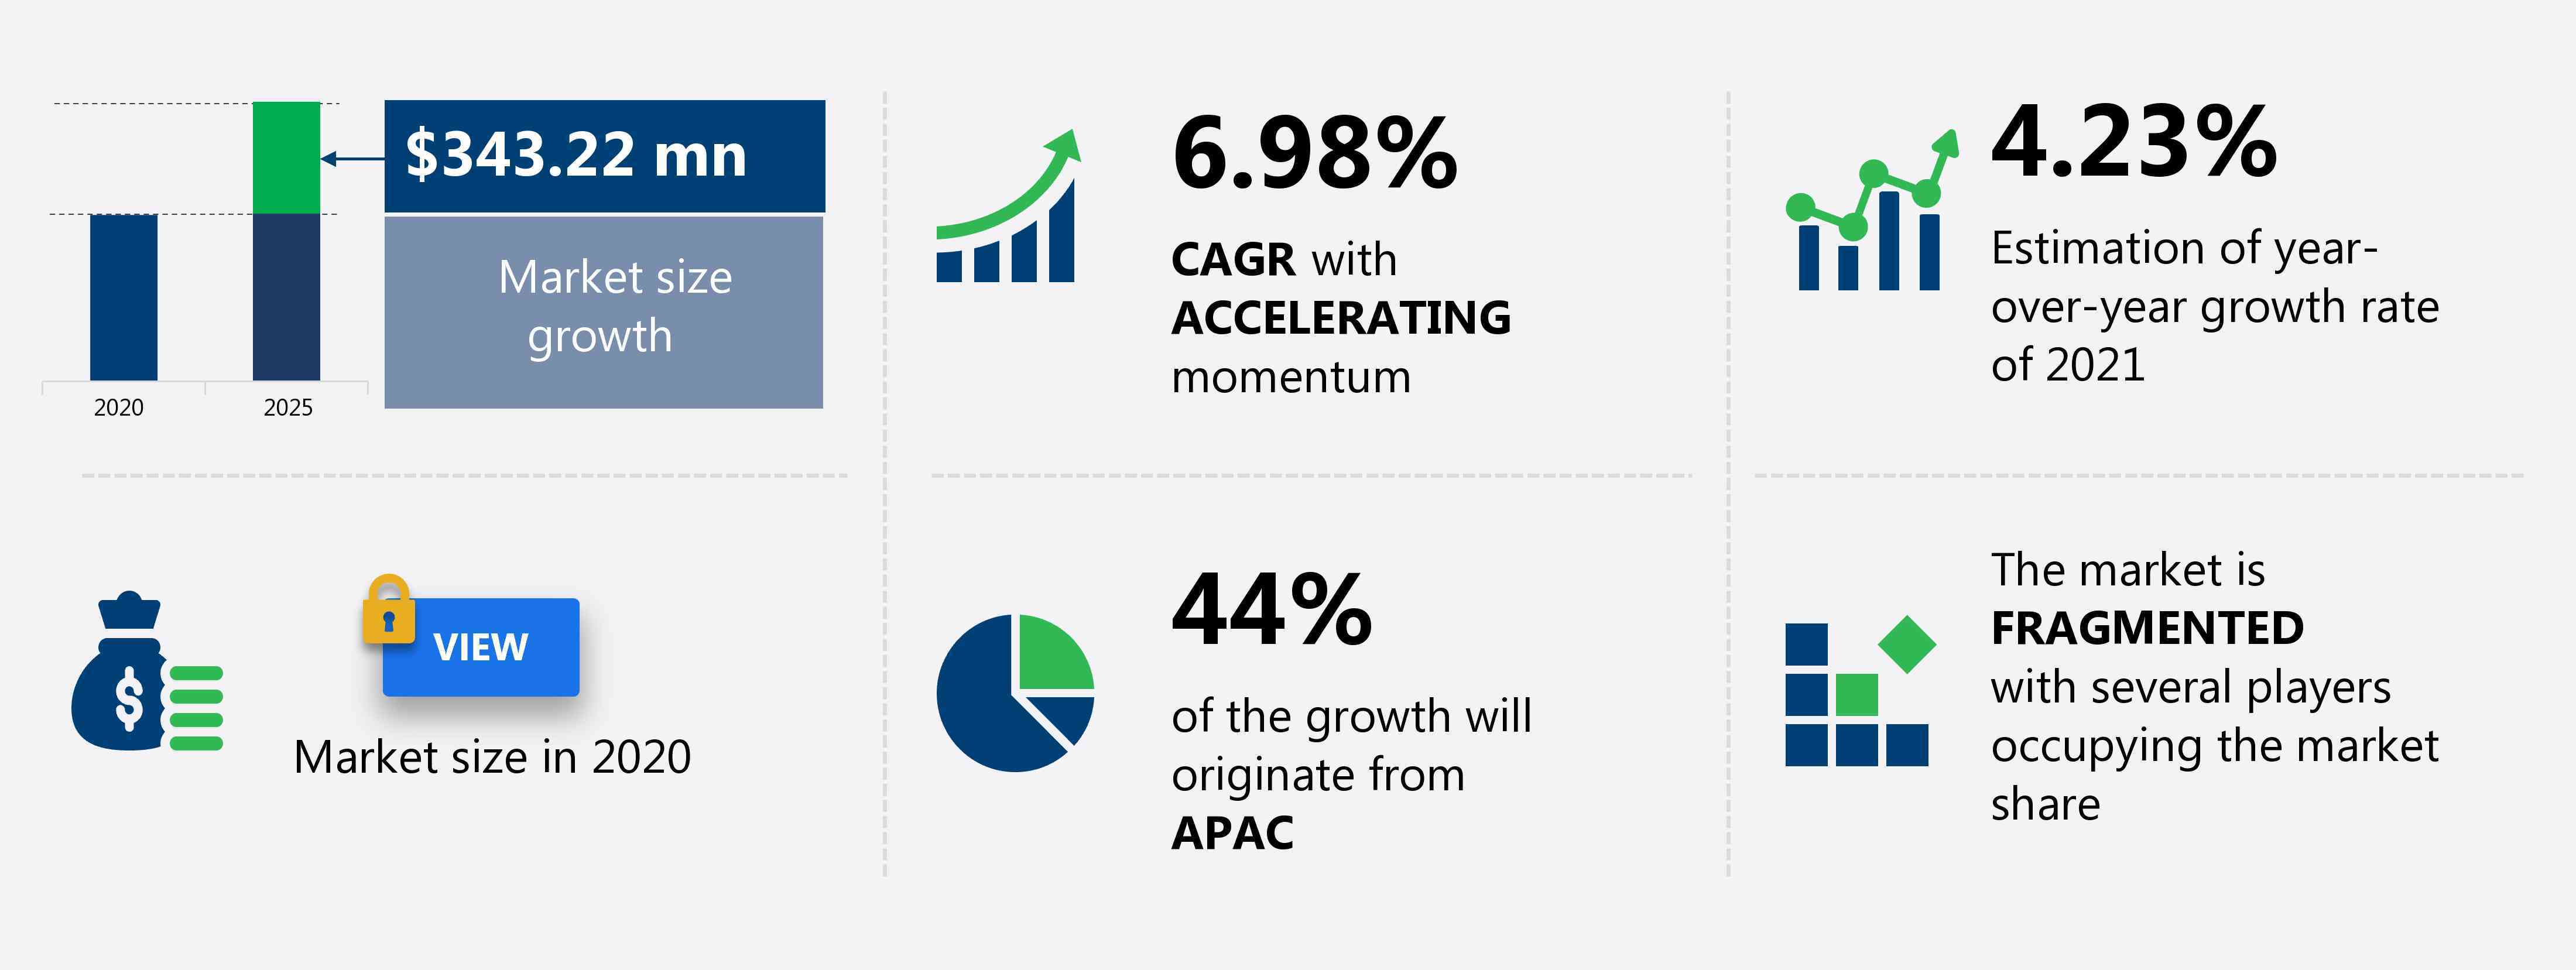
The interface ip market share is expected to increase by USD 343.22 million from 2020 to 2025, and the market’s growth momentum will accelerate at a CAGR of 6.98%.

This interface ip market research report provides valuable insights on the post COVID-19 impact on the market, which will help companies evaluate their business approaches. Furthermore, this report extensively covers interface ip market segmentations by end-user (fabless semiconductor company, idms, and foundries), type (USB, DDRn, PCIe, ethernet, and others), and geography (APAC, North America, Europe, South America, and MEA). The interface ip market report also offers information on several market vendors, including Achronix Semiconductor Corp., Cadence Design Systems Inc., CEVA Inc., eMemory Technology Inc., Lattice Semiconductor Corp., Marvell Technology Group Ltd., Rambus Inc., SoftBank Group Corp., Synopsys Inc., and Xilinx Inc. among others.

What will the Interface IP Market Size be During the Forecast Period?

Download the Free Report Sample to Unlock the Interface IP Market Size for the Forecast Period and Other Important Statistics


Interface IP Market: Key Drivers, Trends, and Challenges

Based on our research output, there has been a neutral impact on the market growth during and post COVID-19 era. The increase in demand for modern soc chips is notably driving the interface ip market growth, although factors such as heavy investments driven by ip core design complexity may impede market growth. Our research analysts have studied the historical data and deduced the key market drivers and the COVID-19 pandemic impact on the interface ip industry. The holistic analysis of the drivers will help in deducing end goals and refining marketing strategies to gain a competitive edge.

Key Interface IP Market Driver

The growing design complexity are one of the key factors driving the growth of the global Interface IP market. Electronic device manufacturers currently try to offer products that have better functionalities while offering power-packed performances in comparison to the previous offerings or the older generations of the same product. This has compelled semiconductor chip manufacturers to ensure that their IC designs are capable of offering high performance. This has catapulted the product development process in the semiconductor industry. Vendors are pitting against each other in terms of the timely delivery of offerings while ensuring high-performing and multi-functional devices. To deliver such high-end multi-functional products, semiconductor device manufacturers have come up with the new and complex architecture and designs of semiconductor ICs. For instance, 3D ICs are compact in size and are more efficient in performance. In addition, they consume less power and have a complex design and manufacturing process. This design complexity will generally hamper the overall productivity of the industry as the number of manufacturing processes has increased considerably. The comparison of the product designing complexity and manufacturing indicates that the designing complexity is growing at a rate of 5% more than the manufacturing productivity.

Key Interface IP Market Trend

The growth of in-vehicle networks will fuel the global Interface IP market growth. The exponential increase in the deployment of advanced electronics, such as actuators, microcontrollers, and sensors, to enable in-vehicle communication is driving the growth of automotive communication protocols. Consumers are demanding smart features in automotive vehicles for convenience, entertainment, and safety. Thus, automotive OEMs are incorporating smart features, such as advanced driver-assistance systems (ADAS), antilock braking systems, automatic transmissions, central locking, and engine management systems, in vehicles. Moreover, the growing demand for higher bandwidth applications and the exponential increase in the number of electronic control modules in vehicles is expected to escalate the number of nodes connected by serial bus protocols. Growth in the number of connected nodes in vehicles will increase the demand for SoCs integrated with automotive communication protocols. The number of connected cars is expected to increase further because of the growing demand for safety features in automotive vehicles and the tightening of vehicle safety regulations. This is expected to accelerate the development of new SoC designs by incorporating advanced IP blocks, which will result in the rapid growth of the global interface IP market during the forecast period.

Key Interface IP Market Challenge

The heavy investments driven by IP core design complexity is a major challenge for the global Interface IP market growth. The design and developmental costs of semiconductor IPs are getting increasingly complex and expensive. This is because semiconductor IP vendors need to invest additional time and money to develop complex algorithms for addressing the growing needs of customers. In addition, heavy investments in R&D by semiconductor IP vendors are resulting in a high price per license and high royalty charges. Moreover, apart from the high cost of R&D investment, there are other cost-related factors involved in the semiconductor IP core development process. The cost of hard IPs is expected to increase at lesser nodes (at 20 nanometers) as a result of the transformation of original transistor devices. However, the same does not occur in the case of soft IPs unless the IP vendor is wholeheartedly involved in the development of the IP. This can be illustrated by taking the example of unconventional complementary metal-oxide-semiconductor (CMOS) processes such as the FinFET tool, which will indirectly increase the cost of soft IPs.

This interface ip market analysis report also provides detailed information on other upcoming trends and challenges that will have a far-reaching effect on the market growth. The actionable insights on the trends and challenges will help companies evaluate and develop growth strategies for 2021-2025.

Parent Market Analysis

Technavio categorizes the global interface IP market as a part of the global semiconductor market, within the overall global semiconductors and semiconductor equipment market. Our research report has extensively covered external factors influencing the parent market growth potential in the coming years, which will determine the levels of growth of the interface ip market during the forecast period.

Who are the Major Interface IP Market Vendors?

The report analyzes the market’s competitive landscape and offers information on several market vendors, including:


  • Achronix Semiconductor Corp.
  • Cadence Design Systems Inc.
  • CEVA Inc.
  • eMemory Technology Inc.
  • Lattice Semiconductor Corp.
  • Marvell Technology Group Ltd.
  • Rambus Inc.
  • SoftBank Group Corp.
  • Synopsys Inc.
  • Xilinx Inc.


This statistical study of the interface ip market encompasses successful business strategies deployed by the key vendors. The interface ip market is fragmented and the vendors are deploying growth strategies such as price, quality, technology, brand identity, and distribution to compete in the market.

Product Insights and News

  • Achronix Semiconductor Corp. - The company offers interface IP such as Speedcore eFPGA IP.

To make the most of the opportunities and recover from post COVID-19 impact, market vendors should focus more on the growth prospects in the fast-growing segments, while maintaining their positions in the slow-growing segments.

The interface ip market forecast report offers in-depth insights into key vendor profiles. The profiles include information on the production, sustainability, and prospects of the leading companies.

Interface IP Market Value Chain Analysis

Our report provides extensive information on the value chain analysis for the interface ip market, which vendors can leverage to gain a competitive advantage during the forecast period. The end-to-end understanding of the value chain is essential in profit margin optimization and evaluation of business strategies. The data available in our value chain analysis segment can help vendors drive costs and enhance customer services during the forecast period.

The value chain of the global semiconductor market includes the following core components:

  • Inputs
  • Inbound logistics
  • Operations
  • Outbound logistics
  • Marketing and sales
  • Service
  • Support activities
  • Innovation

The report has further elucidated on other innovative approaches being followed by service providers to ensure a sustainable market presence.

Which are the Key Regions for Interface IP Market?

For more insights on the market share of various regions Request for a FREE sample now!

44% of the market’s growth will originate from APAC during the forecast period. China, and Japan are the key markets for the interface ip market in APAC. Market growth in this region will be faster than the growth of the market in regions.

The growing design complexity will facilitate the interface ip market growth in APAC over the forecast period. This market research report entails detailed information on the competitive intelligence, marketing gaps, and regional opportunities in store for vendors, which will assist in creating efficient business plans.

COVID Impact and Recovery Analysis

The interface IP market in APAC witnessed certain challenges in 2020, owing to the COVID-19 outbreak. The outbreak affected many countries in the region, such as China, India, South Korea, and Japan. Since early 2020, many countries have been imposing nationwide lockdowns to prevent the community's spread of the disease. The outbreak affected the economy, supply chains, and the industrial and commercial sectors in the region. However, in 2021, the initiation of large-scale vaccination drives has lifted the lockdown and travel restrictions, which led to the resumption of supply chain activities. Such factors are expected to drive the market during the forecast period.

What are the Revenue-generating End-User Segments in the Interface IP Market?

To gain further insights on the market contribution of various segments Request for a FREE sample

The interface ip market share growth by the fabless semiconductor company segment will be significant during the forecast period. Fabless semiconductor companies only consider the design aspect of the semiconductor device. The main reason for this is to reduce the overhead expenses related to maintaining manufacturing units.

This report provides an accurate prediction of the contribution of all the segments to the growth of the interface ip market size and actionable market insights on post COVID-19 impact on each segment.

Interface IP Market Scope

Report Coverage

Details

Page number

120

Base year

2020

Forecast period

2021-2025

Growth momentum & CAGR

Accelerate at a CAGR of 6.98%

Market growth 2021-2025

$ 343.22 million

Market structure

Fragmented

YoY growth (%)

4.23

Regional analysis

APAC, North America, Europe, South America, and MEA

Performing market contribution

APAC at 44%

Key consumer countries

US, China, South Korea (Republic of Korea), Japan, and Germany

Competitive landscape

Leading companies, Competitive strategies, Consumer engagement scope

Key companies profiled

Achronix Semiconductor Corp., Cadence Design Systems Inc., CEVA Inc., eMemory Technology Inc., Lattice Semiconductor Corp., Marvell Technology Group Ltd., Rambus Inc., SoftBank Group Corp., Synopsys Inc., and Xilinx Inc.

Market dynamics

Parent market analysis, Market growth inducers and obstacles, Fast-growing and slow-growing segment analysis, COVID 19 impact and recovery analysis and future consumer dynamics, Market condition analysis for forecast period

Customization purview

If our report has not included the data that you are looking for, you can reach out to our analysts and get segments customized.

Request for a FREE sample

What are the Key Data Covered in this Interface IP Market Report?

  • CAGR of the market during the forecast period 2021-2025
  • Detailed information on factors that will drive interface ip market growth during the next five years
  • Precise estimation of the interface ip market size and its contribution to the parent market
  • Accurate predictions on upcoming trends and changes in consumer behavior
  • The growth of the interface ip industry across APAC, North America, Europe, South America, and MEA
  • A thorough analysis of the market’s competitive landscape and detailed information on vendors
  • Comprehensive details of factors that will challenge the growth of interface ip market vendors

We can help! Our analysts can customize this report to meet your requirements. Get in touch

1 Executive Summary

2 Market Landscape

  • 2.1 Market ecosystem
    • Exhibit 01: Parent market
    • Exhibit 02: Market characteristics
  • 2.2 Value chain analysis
    • Exhibit 03: Value chain analysis: Semiconductors

3 Market Sizing

  • 3.1 Market definition
    • Exhibit 04: Offerings of vendors included in the market definition
  • 3.2 Market segment analysis
    • Exhibit 05: Market segments
  • 3.3 Market size 2020
    • 3.4 Market outlook: Forecast for 2020 - 2025
      • Exhibit 06: Global - Market size and forecast 2020 - 2025 ($ million)
      • Exhibit 07: Global market: Year-over-year growth 2020 - 2025 (%)

    4 Five Forces Analysis

    • 4.1 Five forces analysis
      • Exhibit 08: Five forces analysis 2020 & 2025
    • 4.2 Bargaining power of buyers
      • Exhibit 09: Bargaining power of buyers
    • 4.3 Bargaining power of suppliers
      • Exhibit 10: Bargaining power of suppliers
    • 4.4 Threat of new entrants
      • Exhibit 11: Threat of new entrants
    • 4.5 Threat of substitutes
      • Exhibit 12: Threat of substitutes
    • 4.6 Threat of rivalry
      • Exhibit 13: Threat of rivalry
    • 4.7 Market condition
      • Exhibit 14: Market condition - Five forces 2020

    5 Market Segmentation by End-user

    • 5.1 Market segments
      • Exhibit 15: End-user - Market share 2020-2025 (%)
    • 5.2 Comparison by End-user
      • Exhibit 16: Comparison by End-user
    • 5.3 Fabless semiconductor company - Market size and forecast 2020-2025
      • Exhibit 17: Fabless semiconductor company - Market size and forecast 2020-2025 ($ million)
      • Exhibit 18: Fabless semiconductor company - Year-over-year growth 2020-2025 (%)
    • 5.4 IDMs - Market size and forecast 2020-2025
      • Exhibit 19: IDMs - Market size and forecast 2020-2025 ($ million)
      • Exhibit 20: IDMs - Year-over-year growth 2020-2025 (%)
    • 5.5 Foundries - Market size and forecast 2020-2025
      • Exhibit 21: Foundries - Market size and forecast 2020-2025 ($ million)
      • Exhibit 22: Foundries - Year-over-year growth 2020-2025 (%)
    • 5.6 Market opportunity by End-user
      • Exhibit 23: Market opportunity by End-user

    6 Market Segmentation by Type

    • 6.1 Market segments
      • Exhibit 24: Type - Market share 2020-2025 (%)
    • 6.2 Comparison by Type
      • Exhibit 25: Comparison by Type
    • 6.3 USB - Market size and forecast 2020-2025
      • Exhibit 26: USB - Market size and forecast 2020-2025 ($ million)
      • Exhibit 27: USB - Year-over-year growth 2020-2025 (%)
    • 6.4 DDRn - Market size and forecast 2020-2025
      • Exhibit 28: DDRn - Market size and forecast 2020-2025 ($ million)
      • Exhibit 29: DDRn - Year-over-year growth 2020-2025 (%)
    • 6.5 PCIe - Market size and forecast 2020-2025
      • Exhibit 30: PCIe - Market size and forecast 2020-2025 ($ million)
      • Exhibit 31: PCIe - Year-over-year growth 2020-2025 (%)
    • 6.6 Ethernet - Market size and forecast 2020-2025
      • Exhibit 32: Ethernet - Market size and forecast 2020-2025 ($ million)
      • Exhibit 33: Ethernet - Year-over-year growth 2020-2025 (%)
    • 6.7 Others - Market size and forecast 2020-2025
      • Exhibit 34: Others - Market size and forecast 2020-2025 ($ million)
      • Exhibit 35: Others - Year-over-year growth 2020-2025 (%)
    • 6.8 Market opportunity by Type
      • Exhibit 36: Market opportunity by Type

    7 Customer landscape

    8 Geographic Landscape

    • 8.1 Geographic segmentation
      • Exhibit 38: Market share by geography 2020-2025 (%)
    • 8.2 Geographic comparison
      • Exhibit 39: Geographic comparison
    • 8.3 APAC - Market size and forecast 2020-2025
      • Exhibit 40: APAC - Market size and forecast 2020-2025 ($ million)
      • Exhibit 41: APAC - Year-over-year growth 2020-2025 (%)
    • 8.4 North America - Market size and forecast 2020-2025
      • Exhibit 42: North America - Market size and forecast 2020-2025 ($ million)
      • Exhibit 43: North America - Year-over-year growth 2020-2025 (%)
    • 8.5 Europe - Market size and forecast 2020-2025
      • Exhibit 44: Europe - Market size and forecast 2020-2025 ($ million)
      • Exhibit 45: Europe - Year-over-year growth 2020-2025 (%)
    • 8.6 South America - Market size and forecast 2020-2025
      • Exhibit 46: South America - Market size and forecast 2020-2025 ($ million)
      • Exhibit 47: South America - Year-over-year growth 2020-2025 (%)
    • 8.7 MEA - Market size and forecast 2020-2025
      • Exhibit 48: MEA - Market size and forecast 2020-2025 ($ million)
      • Exhibit 49: MEA - Year-over-year growth 2020-2025 (%)
    • 8.8 Key leading countries
      • 8.9 Market opportunity by geography
        • Exhibit 51: Market opportunity by geography ($ million)

      9 Drivers, Challenges, and Trends

      • 9.1 Market drivers
        • 9.2 Market challenges
          • Exhibit 52: Impact of drivers and challenges
        • 9.3 Market trends

          10 Vendor Landscape

          • 10.1 Overview
            • 10.2 Vendor landscape
              • Exhibit 53: Vendor landscape
            • 10.3 Landscape disruption
              • Exhibit 54: Landscape disruption
              • Exhibit 55: Industry risks

            11 Vendor Analysis

            • 11.1 Vendors covered
              • Exhibit 56: Vendors covered
            • 11.2 Market positioning of vendors
              • Exhibit 57: Market positioning of vendors
            • 11.3 Achronix Semiconductor Corp.
              • Exhibit 58: Achronix Semiconductor Corp. - Overview
              • Exhibit 59: Achronix Semiconductor Corp. - Product and service
              • Exhibit 60: Achronix Semiconductor Corp.- Key news
              • Exhibit 61: Achronix Semiconductor Corp. - Key offerings
            • 11.4 Cadence Design Systems Inc.
              • Exhibit 62: Cadence Design Systems Inc. - Overview
              • Exhibit 63: Cadence Design Systems Inc. - Product and service
              • Exhibit 64: Cadence Design Systems Inc. - Key offerings
            • 11.5 CEVA Inc.
              • Exhibit 65: CEVA Inc. - Overview
              • Exhibit 66: CEVA Inc. - Business segments
              • Exhibit 67: CEVA Inc.- Key news
              • Exhibit 68: CEVA Inc. - Key offerings
              • Exhibit 69: CEVA Inc. - Segment focus
            • 11.6 eMemory Technology Inc.
              • Exhibit 70: eMemory Technology Inc. - Overview
              • Exhibit 71: eMemory Technology Inc. - Business segments
              • Exhibit 72: eMemory Technology Inc. - Key offerings
              • Exhibit 73: eMemory Technology Inc. - Segment focus
            • 11.7 Lattice Semiconductor Corp.
              • Exhibit 74: Lattice Semiconductor Corp. - Overview
              • Exhibit 75: Lattice Semiconductor Corp. - Business segments
              • Exhibit 76: Lattice Semiconductor Corp. - Key offerings
              • Exhibit 77: Lattice Semiconductor Corp. - Segment focus
            • 11.8 Marvell Technology Group Ltd.
              • Exhibit 78: Marvell Technology Group Ltd. - Overview
              • Exhibit 79: Marvell Technology Group Ltd. - Business segments
              • Exhibit 80: Marvell Technology Group Ltd. - Key offerings
              • Exhibit 81: Marvell Technology Group Ltd. - Segment focus
            • 11.9 Rambus Inc.
              • Exhibit 82: Rambus Inc. - Overview
              • Exhibit 83: Rambus Inc. - Business segments
              • Exhibit 84: Rambus Inc.- Key news
              • Exhibit 85: Rambus Inc. - Key offerings
              • Exhibit 86: Rambus Inc. - Segment focus
            • 11.10 SoftBank Group Corp.
              • Exhibit 87: SoftBank Group Corp. - Overview
              • Exhibit 88: SoftBank Group Corp. - Business segments
              • Exhibit 89: SoftBank Group Corp.- Key news
              • Exhibit 90: SoftBank Group Corp. - Key offerings
              • Exhibit 91: SoftBank Group Corp. - Segment focus
            • 11.11 Synopsys Inc.
              • Exhibit 92: Synopsys Inc. - Overview
              • Exhibit 93: Synopsys Inc. - Business segments
              • Exhibit 94: Synopsys Inc.- Key news
              • Exhibit 95: Synopsys Inc. - Key offerings
              • Exhibit 96: Synopsys Inc. - Segment focus
            • 11.12 Xilinx Inc.
              • Exhibit 97: Xilinx Inc. - Overview
              • Exhibit 98: Xilinx Inc. - Business segments
              • Exhibit 99: Xilinx Inc.- Key news
              • Exhibit 100: Xilinx Inc. - Key offerings
              • Exhibit 101: Xilinx Inc. - Segment focus

            12 Appendix

            • 12.1 Scope of the report
              • 12.2 Currency conversion rates for US$
                • Exhibit 102: Currency conversion rates for US$
              • 12.3 Research methodology
                • Exhibit 103: Research Methodology
                • Exhibit 104: Validation techniques employed for market sizing
                • Exhibit 105: Information sources
              • 12.4 List of abbreviations
                • Exhibit 106: List of abbreviations

              Research Methodology

              Technavio presents a detailed picture of the market by way of study, synthesis, and summation of data from multiple sources. The analysts have presented the various facets of the market with a particular focus on identifying the key industry influencers. The data thus presented is comprehensive, reliable, and the result of extensive research, both primary and secondary.

              INFORMATION SOURCES

              Primary sources

              • Manufacturers and suppliers
              • Channel partners
              • Industry experts
              • Strategic decision makers

              Secondary sources

              • Industry journals and periodicals
              • Government data
              • Financial reports of key industry players
              • Historical data
              • Press releases

              DATA ANALYSIS

              Data Synthesis

              • Collation of data
              • Estimation of key figures
              • Analysis of derived insights

              Data Validation

              • Triangulation with data models
              • Reference against proprietary databases
              • Corroboration with industry experts

              REPORT WRITING

              Qualitative

              • Market drivers
              • Market challenges
              • Market trends
              • Five forces analysis

              Quantitative

              • Market size and forecast
              • Market segmentation
              • Geographical insights
              • Competitive landscape

              Interested in this report?

              Get your sample now to see our research methodology and insights!

              Download Now

              Frequently Asked Questions

              Interface IP market growth will increase by $ 343.22 mn during 2021-2025.

              The Interface IP market is expected to grow at a CAGR of 6.98% during 2021-2025.

              Interface IP market is segmented by End-user( fabless semiconductor company, idms, foundries) Type( USB, DDRn, PCle, ethernet, others)

              Achronix Semiconductor Corp., Cadence Design Systems Inc., CEVA Inc., eMemory Technology Inc., Lattice Semiconductor Corp., Marvell Technology Group Ltd., Rambus Inc., SoftBank Group Corp., Synopsys Inc., Xilinx Inc. are a few of the key vendors in the Interface IP market.

              APAC will register the highest growth rate of 44% among the other regions. Therefore, the Interface IP market in APAC is expected to garner significant business opportunities for the vendors during the forecast period.

              US, China, South Korea (Republic of Korea), Japan, Germany

              • Growing design complexityElectronic device manufacturers currently try to offer products that have better functionalities while offering power-packed performances in comparison to the previous offerings or the older generations of the same product. This has compelled semiconductor chip manufacturers to ensure that their IC designs are capable of offering high performance. This has catapulted the product development process in the semiconductor industry. Vendors are pitting against each other in terms of the timely delivery of offerings while ensuring high-performing and multi-functional devices. To deliver such high-end multi-functional products is the driving factor this market.
              • semiconductor device manufacturers have come up with the new and complex architecture and designs of semiconductor ICs. For instance is the driving factor this market.
              • 3D ICs are compact in size and are more efficient in performance. In addition is the driving factor this market.
              • they consume less power and have a complex design and manufacturing process. This design complexity will generally hamper the overall productivity of the industry as the number of manufacturing processes has increased considerably. The comparison of the product designing complexity and manufacturing indicates that the designing complexity is growing at a rate of 5% more than the manufacturing productivity.In the development of SoC designs is the driving factor this market.
              • pre-designed and pre-verified blocks is the driving factor this market.
              • such as IP blocks is the driving factor this market.
              • IP cores is the driving factor this market.
              • and virtual components is the driving factor this market.
              • are combined on a single chip. Currently is the driving factor this market.
              • 85% of SoCs are mixed-signal SoCs is the driving factor this market.
              • which contain both digital and analog circuits. This has provided SoC manufacturers a platform not only to reduce the size of the ICs but also to integrate a large number of functions on a single IC is the driving factor this market.
              • which can handle many application-specific processing functions. Since ICs continue to shrink in size is the driving factor this market.
              • their design complexity is increasing. As a result of this is the driving factor this market.
              • IP building blocks are getting bigger and more complex. This can be understood from the fact that USB 3.1 is approximately 25 times more complex to design and verify than USB 2.0. Also is the driving factor this market.
              • the new standard will be compatible with billions of existing USB products. Design complexity is generally defined as a hurdle at the time of the semiconductor product development process is the driving factor this market.
              • from the point of initiation to that of the commercialization of the product. It has been observed that the design complexity is surpassing the productivity level; hence is the driving factor this market.
              • complexity has grown fundamentally over the last five years. This is driving the demand for third-party IP blocks incorporated into designs. In response to technological advances is the driving factor this market.
              • semiconductor manufacturers are incorporating new processes and design technologies to manufacture smaller and powerful devices at a lower cost. Therefore is the driving factor this market.
              • foundries are working closely with IP vendors to ensure the availability of IP building blocks for their new process technologies. is the driving factor this market.

              The Interface IP market vendors should focus on grabbing business opportunities from the fabless semiconductor company segment as it accounted for the largest market share in the base year.
              RIA - Research AI Assistant
              Ask RIA