Interior Design Services Market Analysis, Size, and Forecast 2026-2030: APAC (China, Japan, and South Korea), North America (US, Canada, and Mexico), Europe (Germany, UK, and France), South America (Brazil and Argentina), Middle East and Africa (Saudi Arabia, Turkey, and UAE), and Rest of World (ROW)

Interior Design Services Market Analysis, Size, and Forecast 2026-2030:
APAC (China, Japan, and South Korea), North America (US, Canada, and Mexico), Europe (Germany, UK, and France), South America (Brazil and Argentina), Middle East and Africa (Saudi Arabia, Turkey, and UAE), and Rest of World (ROW)

Published: Mar 2026 285 Pages SKU: IRTNTR70472

Market Overview at a Glance

$31.96 B
Market Opportunity
4.4%
CAGR 2025 - 2030
42.3%
APAC Growth
$70.09 B
Commercial segment 2024

Interior Design Services Market Size 2026-2030

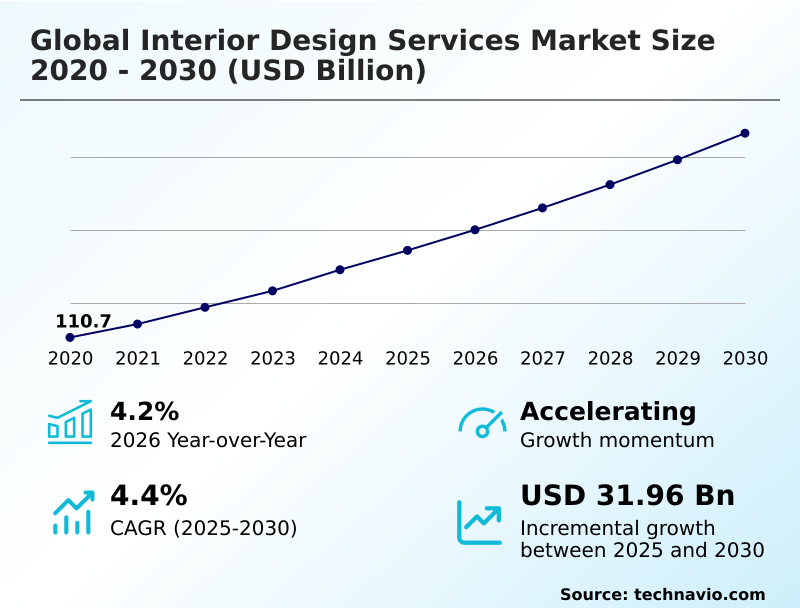
The interior design services market size is valued to increase by USD 31.96 billion, at a CAGR of 4.4% from 2025 to 2030. Increasing integration of immersive VR and generative AI tools will drive the interior design services market.

Major Market Trends & Insights

  • APAC dominated the market and accounted for a 42.3% growth during the forecast period.
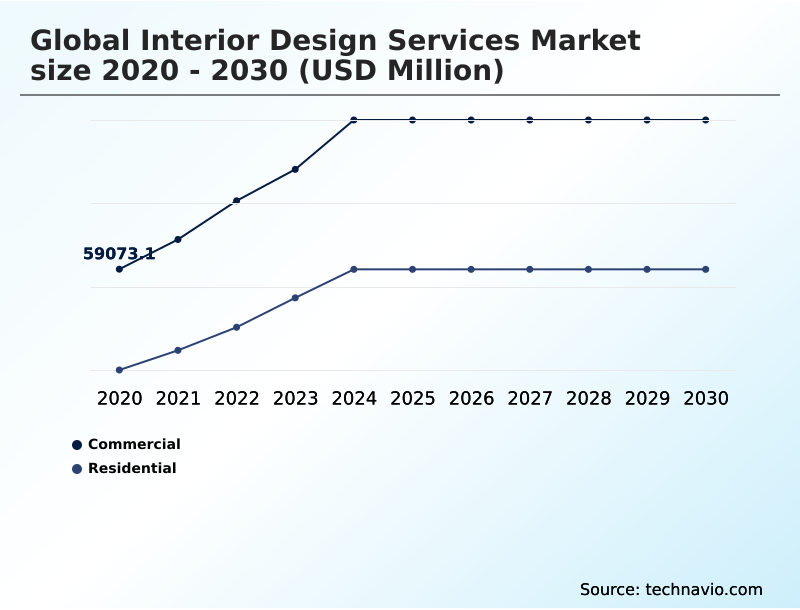
  • By End-user - Commercial segment was valued at USD 70.09 billion in 2024
  • By Application - Newly decorated segment accounted for the largest market revenue share in 2024

Market Size & Forecast

  • Market Opportunities: USD 55.70 billion
  • Market Future Opportunities: USD 31.96 billion
  • CAGR from 2025 to 2030 : 4.4%

Market Summary

  • The interior design services market is undergoing a significant transformation, moving beyond aesthetics to become integral to strategic business outcomes. This evolution is driven by the imperative to create environments that enhance productivity, well-being, and brand identity.
  • A key trend is the integration of digital technologies such as building information modeling (bim) and generative design algorithms, which enable firms to optimize spatial layouts and material selections with unprecedented efficiency.
  • For instance, a corporation redesigning its headquarters can use digital twin integration to simulate employee movement and collaboration patterns, leading to an evidence-based layout that improves workflow and reduces underutilized space. Concurrently, there is a strong push toward sustainability, with a focus on whole-life carbon assessment and the use of bio-fabricated materials.
  • This requires navigating complex challenges like sustainable material procurement and ensuring data transparency across the supply chain. The industry is also shaped by the demand for wellness-centric design interventions, incorporating elements like circadian lighting solutions and advanced air purification systems to improve occupant health.
  • This convergence of technology, sustainability, and human-centered design defines the modern competitive landscape, where value is measured not just in visual appeal but in tangible performance metrics.

What will be the Size of the Interior Design Services Market during the forecast period?

Get Key Insights on Market Forecast (PDF) Request Free Sample

How is the Interior Design Services Market Segmented?

The interior design services industry research report provides comprehensive data (region-wise segment analysis), with forecasts and estimates in "USD million" for the period 2026-2030, as well as historical data from 2020-2024 for the following segments.

  • End-user
    • Commercial
    • Residential
  • Application
    • Newly decorated
    • Repeated decorated
  • Price range
    • Mid range
    • Premium
    • Economy
  • Geography
    • APAC
      • China
      • Japan
      • South Korea
    • North America
      • US
      • Canada
      • Mexico
    • Europe
      • Germany
      • UK
      • France
    • South America
      • Brazil
      • Argentina
    • Middle East and Africa
      • Saudi Arabia
      • Turkey
      • UAE
    • Rest of World (ROW)

By End-user Insights

The commercial segment is estimated to witness significant growth during the forecast period.

The commercial segment is being reshaped by the demand for flexible workspace solutions that reflect a strong brand identity. This includes the design of multi-purpose area design and modular spatial configurations to accommodate dynamic operational needs.

Firms are increasingly adopting prefabricated interior components, which can accelerate project timelines by 30%. In hospitality, heritage property restoration and experiential retail design are key focus areas.

Residential design is adapting to multi-generational household design and extensive internet of things (iot) integration. Across both sectors, universal design services are becoming essential for ensuring accessibility, while high-concept luxury interiors continue to drive the premium end of the market.

Request Free Sample

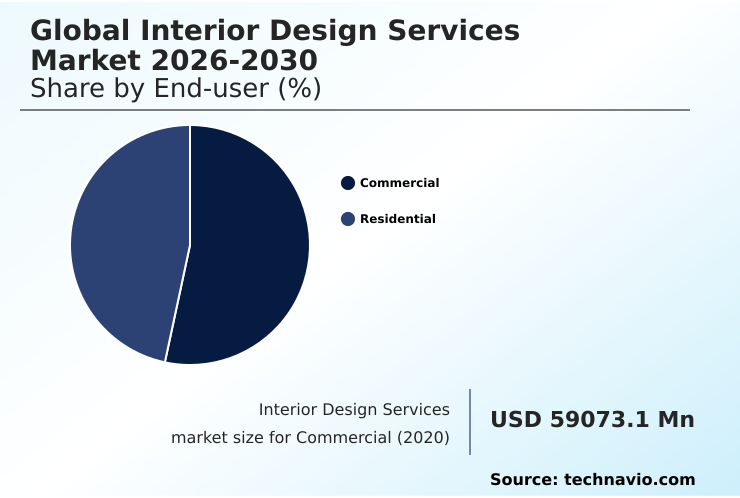
The Commercial segment was valued at USD 70.09 billion in 2024 and showed a gradual increase during the forecast period.

Request Free Sample

Regional Analysis

APAC is estimated to contribute 42.3% to the growth of the global market during the forecast period.Technavio’s analysts have elaborately explained the regional trends and drivers that shape the market during the forecast period.

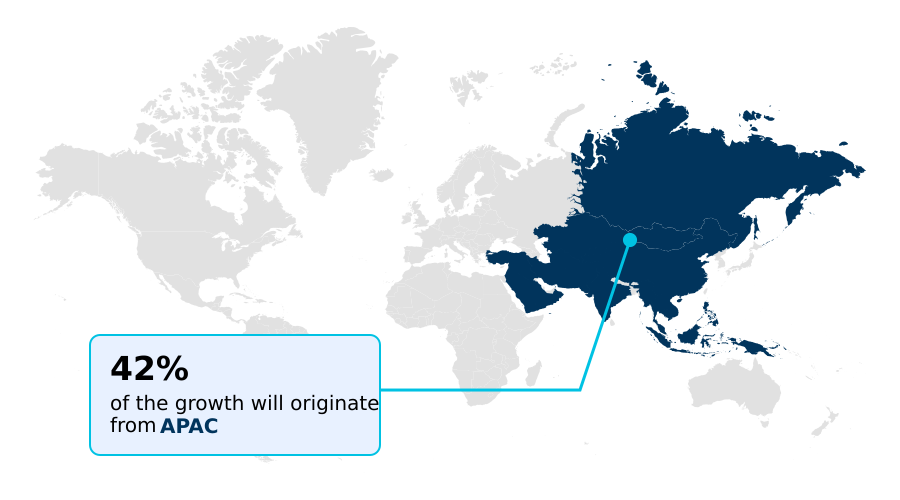
See How Interior Design Services Market Demand is Rising in APAC Request Free Sample

The market's geographic landscape is defined by regional adoption of advanced design principles. In developed areas, the focus is on creating agile workspace design and activity-based working environments that support hybrid collaboration spaces.

These projects often pursue green building certifications, integrating high-efficiency air filtration to reduce volatile organic compounds (vocs) by over 50%. Spatial planning optimization is critical, utilizing ergonomic office furniture and multi-functional furniture to maximize utility.

In hospitality, firms create curated guest experiences using smart lighting control and automated climate control, which can lower energy consumption by up to 18%.

A resurgence of artisan craftsmanship and the use of biometric sensor integration to monitor occupant comfort are also shaping regional service offerings.

Market Dynamics

Our researchers analyzed the data with 2025 as the base year, along with the key drivers, trends, and challenges. A holistic analysis of drivers will help companies refine their marketing strategies to gain a competitive advantage.

  • Strategic planning in the contemporary built environment requires a deep understanding of interconnected performance factors. For instance, a comprehensive analysis of the impact of biophilic design on productivity often reveals gains that far outweigh initial investment costs, particularly when combined with technology integration in luxury residential design.
  • A key consideration is integrating circadian lighting in office spaces, a strategy proven to enhance employee well-being. Firms are exploring the cost-benefit of green building certifications, finding that they improve asset value and operational efficiency. The challenges in sustainable material procurement are being addressed through innovative circular economy models for office furniture and a pivot towards furniture as a service.
  • Understanding how to design activity-based workspaces is crucial for corporations seeking agility. Similarly, architects are exploring best practices for adaptive reuse projects and strategies for reducing embodied carbon. This involves leveraging ai applications for spatial layout optimization and vr for client visualization in construction.
  • The focus extends to acoustic design for open-plan offices and an emphasis on the health benefits of non-toxic materials. For smaller areas, optimizing small spaces with multifunctional furniture has become standard practice. On a broader scale, universal design principles for public spaces are mandated for inclusivity, while firms must navigate supply chain risks for specialized materials.
  • The goal is to balance heritage preservation with modernization, creating timeless, functional, and sustainable interiors.

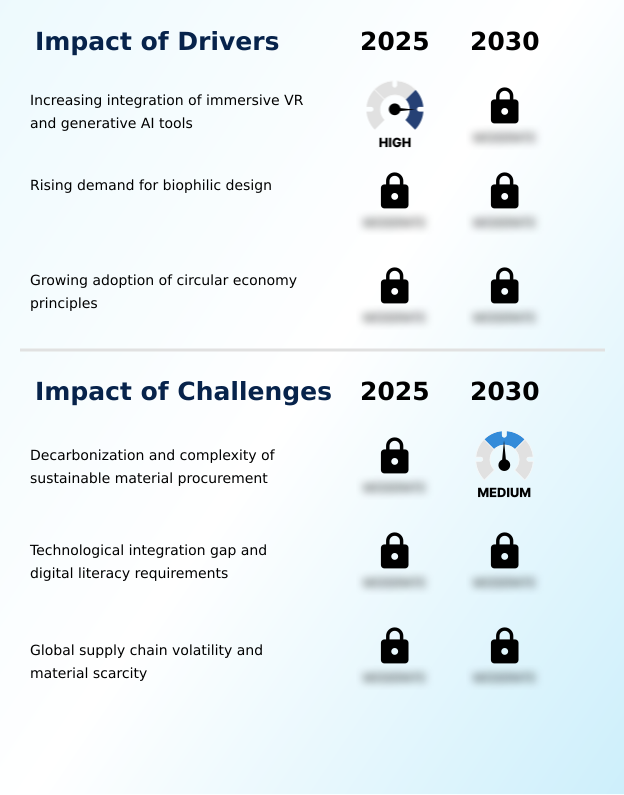
What are the key market drivers leading to the rise in the adoption of Interior Design Services Industry?

  • The increasing integration of immersive virtual reality and generative artificial intelligence tools is a key driver for market transformation and efficiency.

  • Key drivers include wellness-centric design interventions that create experiential interior spaces. The market is propelled by circular economy principles, supported by new circular design strategies like furniture as a service (faas), which can reduce lifecycle costs by 15%.
  • A focus on the decarbonization of built environment is accelerating the use of bio-fabricated materials and advanced systems integration in design. This includes the widespread adoption of circadian lighting solutions and advanced air purification systems.
  • Effective product lifecycle management, enhanced by data transparency in materials, is crucial. Moreover, biophilic design elements and acoustic optimization techniques are now integral to project specifications, improving occupant comfort and productivity measurably by over 20% in some applications.

What are the market trends shaping the Interior Design Services Industry?

  • The imperative for sustainable and wellness-oriented design is emerging as a significant market trend. This shift reflects evolving consumer values and a growing focus on occupant health within built environments.

  • A fundamental trend is the adoption of sustainable architectural practices that prioritize occupant health and well-being. This human-centered design approach, informed by environmental psychology, leverages technologies like generative design algorithms and digital twin integration for hyper-realistic visualization. Firms using immersive vr walkthroughs and augmented reality overlays report a 25% decrease in late-stage design changes.
  • The use of ai-powered material recommendation engines and cloud-based collaboration platforms is becoming standard, ensuring projects align with both health-focused building standards and environmental social governance (esg) goals. This focus extends to bespoke craftsmanship, where technology enhances, rather than replaces, unique design elements.
  • The result is a process that delivers superior outcomes, with firms achieving up to a 40% improvement in material selection efficiency.

What challenges does the Interior Design Services Industry face during its growth?

  • The dual challenge of decarbonization and the complexity associated with sustainable material procurement significantly affects industry growth and project execution.

  • Navigating sustainable material procurement is a primary challenge, compelling firms to adopt a more data-driven design approach and resilient supply chain networks. The complexity of conducting a whole-life carbon assessment for adaptive reuse projects requires advanced building information modeling (bim) and smart building systems.
  • Firms leveraging digital consultation platforms for client-centric design solutions find it easier to implement value engineering in design, optimizing budgets against sustainability goals. Challenges include achieving embodied carbon reduction with materials like low-emission adhesives and non-toxic finishes.
  • Implementing localized material sourcing strategies has helped firms reduce material transit times by 30%, though ensuring consistent quality remains a persistent issue for large-scale projects.

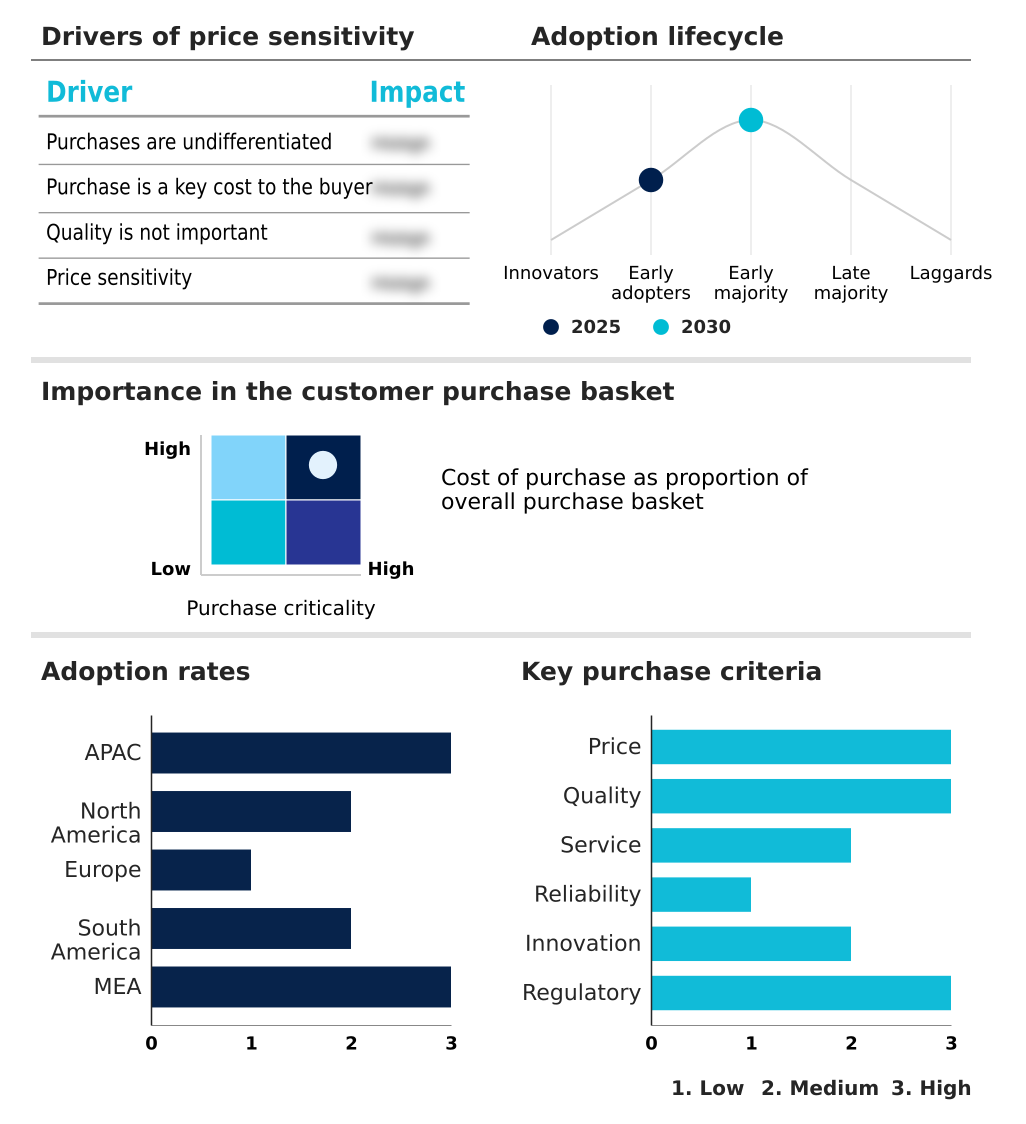
Exclusive Technavio Analysis on Customer Landscape

The interior design services market forecasting report includes the adoption lifecycle of the market, covering from the innovator’s stage to the laggard’s stage. It focuses on adoption rates in different regions based on penetration. Furthermore, the interior design services market report also includes key purchase criteria and drivers of price sensitivity to help companies evaluate and develop their market growth analysis strategies.

Customer Landscape of Interior Design Services Industry

Competitive Landscape

Companies are implementing various strategies, such as strategic alliances, interior design services market forecast, partnerships, mergers and acquisitions, geographical expansion, and product/service launches, to enhance their presence in the industry.

Aero Studios - Services integrate architecture, interiors, and product design, creating refined environments centered on human experience and comfort.

The industry research and growth report includes detailed analyses of the competitive landscape of the market and information about key companies, including:

  • Aero Studios
  • ARRCC
  • AvroKO
  • BDP
  • Champalimaud Design
  • Clive Wilkinson Architects
  • Gensler. M. Arthur Gensler Jr.
  • HOK Group Inc.
  • Interior Architects Inc.
  • Jacobs Solutions Inc.
  • Kelly Wearstler
  • Krista Home
  • NELSON Worldwide LLC
  • Nicole Davis Interiors
  • Oktra Ltd
  • Perkins and Will International
  • Rockwell Group
  • Space Matrix
  • Wilson Associates
  • Yabu Pushelberg

Qualitative and quantitative analysis of companies has been conducted to help clients understand the wider business environment as well as the strengths and weaknesses of key industry players. Data is qualitatively analyzed to categorize companies as pure play, category-focused, industry-focused, and diversified; it is quantitatively analyzed to categorize companies as dominant, leading, strong, tentative, and weak.

Recent Development and News in Interior design services market

  • In November 2024, Google unveiled its first mass timber office building, showcasing a commitment to sustainable and low-impact design.
  • In November 2024, NEOM announced the appointment of a consortium of global firms to lead the detailed urban design and planning for the first phase of THE LINE.
  • In March 2025, Pinnacle Interiors announced its expansion into the high-end residential sector in Dubai after delivering over 300,000 square feet of commercial and hospitality space.
  • In April 2025, the Carbon Leadership Forum published its Embodied Carbon Reductions Built Project Case Study Collection, providing benchmarks for low-carbon specifications.

Dive into Technavio’s robust research methodology, blending expert interviews, extensive data synthesis, and validated models for unparalleled Interior Design Services Market insights. See full methodology.

Market Scope
Page number 285
Base year 2025
Historic period 2020-2024
Forecast period 2026-2030
Growth momentum & CAGR Accelerate at a CAGR of 4.4%
Market growth 2026-2030 USD 31959.5 million
Market structure Fragmented
YoY growth 2025-2026(%) 4.2%
Key countries China, Japan, South Korea, India, Australia, Singapore, US, Canada, Mexico, Germany, UK, France, Spain, Italy, Russia, Brazil, Argentina, Chile, Saudi Arabia, Turkey, UAE, Egypt and Qatar
Competitive landscape Leading Companies, Market Positioning of Companies, Competitive Strategies, and Industry Risks

Request Free Sample

Research Analyst Overview

  • The industry is pivoting from service provision to strategic partnership, driven by complex client demands for sustainable, technologically advanced environments. The integration of generative design algorithms and digital twin integration into workflows is no longer a novelty but a core operational requirement for achieving efficiency in spatial planning optimization.
  • Firms that excel are those mastering sustainable material procurement and whole-life carbon assessment, turning these challenges into competitive advantages. Boardroom decisions are now heavily influenced by the outcomes of wellness-centric design interventions, as data shows a direct link between biophilic design elements and employee retention.
  • For example, the adoption of circadian lighting solutions in office redesigns has been shown to improve alertness by over 15%. This focus on measurable outcomes necessitates expertise in smart building systems, activity-based working environments, and building information modeling (bim).
  • Success hinges on delivering environments that are not only aesthetically superior but also operationally efficient and aligned with corporate wellness and sustainability mandates, utilizing tools from immersive vr walkthroughs to advanced air purification systems.

What are the Key Data Covered in this Interior Design Services Market Research and Growth Report?

  • What is the expected growth of the Interior Design Services Market between 2026 and 2030?

    • USD 31.96 billion, at a CAGR of 4.4%

  • What segmentation does the market report cover?

    • The report is segmented by End-user (Commercial, and Residential), Application (Newly decorated, and Repeated decorated), Price Range (Mid-range, Premium, and Economy) and Geography (APAC, North America, Europe, South America, Middle East and Africa)

  • Which regions are analyzed in the report?

    • APAC, North America, Europe, South America and Middle East and Africa

  • What are the key growth drivers and market challenges?

    • Increasing integration of immersive VR and generative AI tools, Decarbonization and complexity of sustainable material procurement

  • Who are the major players in the Interior Design Services Market?

    • Aero Studios, ARRCC, AvroKO, BDP, Champalimaud Design, Clive Wilkinson Architects, Gensler. M. Arthur Gensler Jr., HOK Group Inc., Interior Architects Inc., Jacobs Solutions Inc., Kelly Wearstler, Krista Home, NELSON Worldwide LLC, Nicole Davis Interiors, Oktra Ltd, Perkins and Will International, Rockwell Group, Space Matrix, Wilson Associates and Yabu Pushelberg

Market Research Insights

  • Market dynamics are increasingly shaped by a client-centric design solutions approach that leverages technology to deliver measurable value. The adoption of health-focused building standards has become a critical differentiator, with spaces incorporating advanced systems seeing a 20% improvement in reported occupant comfort.
  • Firms are implementing circular design strategies, which can reduce material waste by up to 35% over a project's lifecycle. This commitment to environmental social governance (esg) is supported by data transparency in materials, allowing for precise tracking of sustainability metrics. The focus on human-centered design and environmental psychology is reshaping agile workspace design, leading to more productive hybrid collaboration spaces.
  • The drive for the decarbonization of built environment has also spurred innovation in localized material sourcing and product lifecycle management, enhancing the resilience of supply chains.

We can help! Our analysts can customize this interior design services market research report to meet your requirements.

Get in touch

1. Executive Summary

1.1 Market overview

Executive Summary - Chart on Market Overview
Executive Summary - Data Table on Market Overview
Executive Summary - Chart on Global Market Characteristics
Executive Summary - Chart on Market by Geography
Executive Summary - Chart on Market Segmentation by End-user
Executive Summary - Chart on Market Segmentation by Application
Executive Summary - Chart on Market Segmentation by Price Range
Executive Summary - Chart on Incremental Growth
Executive Summary - Data Table on Incremental Growth
Executive Summary - Chart on Company Market Positioning

2. Technavio Analysis

2.1 Analysis of price sensitivity, lifecycle, customer purchase basket, adoption rates, and purchase criteria

2.2 Criticality of inputs and Factors of differentiation

Chart on Overview on criticality of inputs and factors of differentiation

2.3 Factors of disruption

Chart on Overview on factors of disruption

2.4 Impact of drivers and challenges

Chart on Impact of drivers and challenges in 2025 and 2030

3. Market Landscape

3.1 Market ecosystem

Chart on Parent Market
Data Table on - Parent Market

3.2 Market characteristics

Chart on Market characteristics analysis

3.3 Value chain analysis

Chart on Value chain analysis

4. Market Sizing

4.1 Market definition

Data Table on Offerings of companies included in the market definition

4.2 Market segment analysis

Market segments

4.3 Market size 2025

4.4 Market outlook: Forecast for 2025-2030

Chart on Global - Market size and forecast 2025-2030 ($ million)
Data Table on Global - Market size and forecast 2025-2030 ($ million)
Chart on Global Market: Year-over-year growth 2025-2030 (%)
Data Table on Global Market: Year-over-year growth 2025-2030 (%)

5. Historic Market Size

5.1 Global Interior Design Services Market 2020 - 2024

Historic Market Size - Data Table on Global Interior Design Services Market 2020 - 2024 ($ million)

5.2 End-user segment analysis 2020 - 2024

Historic Market Size - End-user Segment 2020 - 2024 ($ million)

5.3 Application segment analysis 2020 - 2024

Historic Market Size - Application Segment 2020 - 2024 ($ million)

5.4 Price Range segment analysis 2020 - 2024

Historic Market Size - Price Range Segment 2020 - 2024 ($ million)

5.5 Geography segment analysis 2020 - 2024

Historic Market Size - Geography Segment 2020 - 2024 ($ million)

5.6 Country segment analysis 2020 - 2024

Historic Market Size - Country Segment 2020 - 2024 ($ million)

6. Qualitative Analysis

6.1 Impact of AI on Global Interior Design Services Market

7. Five Forces Analysis

7.1 Five forces summary

Five forces analysis - Comparison between 2025 and 2030

7.2 Bargaining power of buyers

Bargaining power of buyers - Impact of key factors 2025 and 2030

7.3 Bargaining power of suppliers

Bargaining power of suppliers - Impact of key factors in 2025 and 2030

7.4 Threat of new entrants

Threat of new entrants - Impact of key factors in 2025 and 2030

7.5 Threat of substitutes

Threat of substitutes - Impact of key factors in 2025 and 2030

7.6 Threat of rivalry

Threat of rivalry - Impact of key factors in 2025 and 2030

7.7 Market condition

Chart on Market condition - Five forces 2025 and 2030

8. Market Segmentation by End-user

8.1 Market segments

Chart on End-user - Market share 2025-2030 (%)
Data Table on End-user - Market share 2025-2030 (%)

8.2 Comparison by End-user

Chart on Comparison by End-user
Data Table on Comparison by End-user

8.3 Commercial - Market size and forecast 2025-2030

Chart on Commercial - Market size and forecast 2025-2030 ($ million)
Data Table on Commercial - Market size and forecast 2025-2030 ($ million)
Chart on Commercial - Year-over-year growth 2025-2030 (%)
Data Table on Commercial - Year-over-year growth 2025-2030 (%)

8.4 Residential - Market size and forecast 2025-2030

Chart on Residential - Market size and forecast 2025-2030 ($ million)
Data Table on Residential - Market size and forecast 2025-2030 ($ million)
Chart on Residential - Year-over-year growth 2025-2030 (%)
Data Table on Residential - Year-over-year growth 2025-2030 (%)

8.5 Market opportunity by End-user

Market opportunity by End-user ($ million)
Data Table on Market opportunity by End-user ($ million)

9. Market Segmentation by Application

9.1 Market segments

Chart on Application - Market share 2025-2030 (%)
Data Table on Application - Market share 2025-2030 (%)

9.2 Comparison by Application

Chart on Comparison by Application
Data Table on Comparison by Application

9.3 Newly decorated - Market size and forecast 2025-2030

Chart on Newly decorated - Market size and forecast 2025-2030 ($ million)
Data Table on Newly decorated - Market size and forecast 2025-2030 ($ million)
Chart on Newly decorated - Year-over-year growth 2025-2030 (%)
Data Table on Newly decorated - Year-over-year growth 2025-2030 (%)

9.4 Repeated decorated - Market size and forecast 2025-2030

Chart on Repeated decorated - Market size and forecast 2025-2030 ($ million)
Data Table on Repeated decorated - Market size and forecast 2025-2030 ($ million)
Chart on Repeated decorated - Year-over-year growth 2025-2030 (%)
Data Table on Repeated decorated - Year-over-year growth 2025-2030 (%)

9.5 Market opportunity by Application

Market opportunity by Application ($ million)
Data Table on Market opportunity by Application ($ million)

10. Market Segmentation by Price Range

10.1 Market segments

Chart on Price Range - Market share 2025-2030 (%)
Data Table on Price Range - Market share 2025-2030 (%)

10.2 Comparison by Price Range

Chart on Comparison by Price Range
Data Table on Comparison by Price Range

10.3 Mid range - Market size and forecast 2025-2030

Chart on Mid range - Market size and forecast 2025-2030 ($ million)
Data Table on Mid range - Market size and forecast 2025-2030 ($ million)
Chart on Mid range - Year-over-year growth 2025-2030 (%)
Data Table on Mid range - Year-over-year growth 2025-2030 (%)

10.4 Premium - Market size and forecast 2025-2030

Chart on Premium - Market size and forecast 2025-2030 ($ million)
Data Table on Premium - Market size and forecast 2025-2030 ($ million)
Chart on Premium - Year-over-year growth 2025-2030 (%)
Data Table on Premium - Year-over-year growth 2025-2030 (%)

10.5 Economy - Market size and forecast 2025-2030

Chart on Economy - Market size and forecast 2025-2030 ($ million)
Data Table on Economy - Market size and forecast 2025-2030 ($ million)
Chart on Economy - Year-over-year growth 2025-2030 (%)
Data Table on Economy - Year-over-year growth 2025-2030 (%)

10.6 Market opportunity by Price Range

Market opportunity by Price Range ($ million)
Data Table on Market opportunity by Price Range ($ million)

11. Customer Landscape

11.1 Customer landscape overview

Analysis of price sensitivity, lifecycle, customer purchase basket, adoption rates, and purchase criteria

12. Geographic Landscape

12.1 Geographic segmentation

Chart on Market share by geography 2025-2030 (%)
Data Table on Market share by geography 2025-2030 (%)

12.2 Geographic comparison

Chart on Geographic comparison
Data Table on Geographic comparison

12.3 APAC - Market size and forecast 2025-2030

Chart on APAC - Market size and forecast 2025-2030 ($ million)
Data Table on APAC - Market size and forecast 2025-2030 ($ million)
Chart on APAC - Year-over-year growth 2025-2030 (%)
Data Table on APAC - Year-over-year growth 2025-2030 (%)
Chart on Regional Comparison - APAC
Data Table on Regional Comparison - APAC

12.3.1 China - Market size and forecast 2025-2030

Chart on China - Market size and forecast 2025-2030 ($ million)
Data Table on China - Market size and forecast 2025-2030 ($ million)
Chart on China - Year-over-year growth 2025-2030 (%)
Data Table on China - Year-over-year growth 2025-2030 (%)

12.3.2 Japan - Market size and forecast 2025-2030

Chart on Japan - Market size and forecast 2025-2030 ($ million)
Data Table on Japan - Market size and forecast 2025-2030 ($ million)
Chart on Japan - Year-over-year growth 2025-2030 (%)
Data Table on Japan - Year-over-year growth 2025-2030 (%)

12.3.3 South Korea - Market size and forecast 2025-2030

Chart on South Korea - Market size and forecast 2025-2030 ($ million)
Data Table on South Korea - Market size and forecast 2025-2030 ($ million)
Chart on South Korea - Year-over-year growth 2025-2030 (%)
Data Table on South Korea - Year-over-year growth 2025-2030 (%)

12.3.4 India - Market size and forecast 2025-2030

Chart on India - Market size and forecast 2025-2030 ($ million)
Data Table on India - Market size and forecast 2025-2030 ($ million)
Chart on India - Year-over-year growth 2025-2030 (%)
Data Table on India - Year-over-year growth 2025-2030 (%)

12.3.5 Australia - Market size and forecast 2025-2030

Chart on Australia - Market size and forecast 2025-2030 ($ million)
Data Table on Australia - Market size and forecast 2025-2030 ($ million)
Chart on Australia - Year-over-year growth 2025-2030 (%)
Data Table on Australia - Year-over-year growth 2025-2030 (%)

12.3.6 Singapore - Market size and forecast 2025-2030

Chart on Singapore - Market size and forecast 2025-2030 ($ million)
Data Table on Singapore - Market size and forecast 2025-2030 ($ million)
Chart on Singapore - Year-over-year growth 2025-2030 (%)
Data Table on Singapore - Year-over-year growth 2025-2030 (%)

12.4 North America - Market size and forecast 2025-2030

Chart on North America - Market size and forecast 2025-2030 ($ million)
Data Table on North America - Market size and forecast 2025-2030 ($ million)
Chart on North America - Year-over-year growth 2025-2030 (%)
Data Table on North America - Year-over-year growth 2025-2030 (%)
Chart on Regional Comparison - North America
Data Table on Regional Comparison - North America

12.4.1 US - Market size and forecast 2025-2030

Chart on US - Market size and forecast 2025-2030 ($ million)
Data Table on US - Market size and forecast 2025-2030 ($ million)
Chart on US - Year-over-year growth 2025-2030 (%)
Data Table on US - Year-over-year growth 2025-2030 (%)

12.4.2 Canada - Market size and forecast 2025-2030

Chart on Canada - Market size and forecast 2025-2030 ($ million)
Data Table on Canada - Market size and forecast 2025-2030 ($ million)
Chart on Canada - Year-over-year growth 2025-2030 (%)
Data Table on Canada - Year-over-year growth 2025-2030 (%)

12.4.3 Mexico - Market size and forecast 2025-2030

Chart on Mexico - Market size and forecast 2025-2030 ($ million)
Data Table on Mexico - Market size and forecast 2025-2030 ($ million)
Chart on Mexico - Year-over-year growth 2025-2030 (%)
Data Table on Mexico - Year-over-year growth 2025-2030 (%)

12.5 Europe - Market size and forecast 2025-2030

Chart on Europe - Market size and forecast 2025-2030 ($ million)
Data Table on Europe - Market size and forecast 2025-2030 ($ million)
Chart on Europe - Year-over-year growth 2025-2030 (%)
Data Table on Europe - Year-over-year growth 2025-2030 (%)
Chart on Regional Comparison - Europe
Data Table on Regional Comparison - Europe

12.5.1 Germany - Market size and forecast 2025-2030

Chart on Germany - Market size and forecast 2025-2030 ($ million)
Data Table on Germany - Market size and forecast 2025-2030 ($ million)
Chart on Germany - Year-over-year growth 2025-2030 (%)
Data Table on Germany - Year-over-year growth 2025-2030 (%)

12.5.2 UK - Market size and forecast 2025-2030

Chart on UK - Market size and forecast 2025-2030 ($ million)
Data Table on UK - Market size and forecast 2025-2030 ($ million)
Chart on UK - Year-over-year growth 2025-2030 (%)
Data Table on UK - Year-over-year growth 2025-2030 (%)

12.5.3 France - Market size and forecast 2025-2030

Chart on France - Market size and forecast 2025-2030 ($ million)
Data Table on France - Market size and forecast 2025-2030 ($ million)
Chart on France - Year-over-year growth 2025-2030 (%)
Data Table on France - Year-over-year growth 2025-2030 (%)

12.5.4 Spain - Market size and forecast 2025-2030

Chart on Spain - Market size and forecast 2025-2030 ($ million)
Data Table on Spain - Market size and forecast 2025-2030 ($ million)
Chart on Spain - Year-over-year growth 2025-2030 (%)
Data Table on Spain - Year-over-year growth 2025-2030 (%)

12.5.5 Italy - Market size and forecast 2025-2030

Chart on Italy - Market size and forecast 2025-2030 ($ million)
Data Table on Italy - Market size and forecast 2025-2030 ($ million)
Chart on Italy - Year-over-year growth 2025-2030 (%)
Data Table on Italy - Year-over-year growth 2025-2030 (%)

12.5.6 Russia - Market size and forecast 2025-2030

Chart on Russia - Market size and forecast 2025-2030 ($ million)
Data Table on Russia - Market size and forecast 2025-2030 ($ million)
Chart on Russia - Year-over-year growth 2025-2030 (%)
Data Table on Russia - Year-over-year growth 2025-2030 (%)

12.6 South America - Market size and forecast 2025-2030

Chart on South America - Market size and forecast 2025-2030 ($ million)
Data Table on South America - Market size and forecast 2025-2030 ($ million)
Chart on South America - Year-over-year growth 2025-2030 (%)
Data Table on South America - Year-over-year growth 2025-2030 (%)
Chart on Regional Comparison - South America
Data Table on Regional Comparison - South America

12.6.1 Brazil - Market size and forecast 2025-2030

Chart on Brazil - Market size and forecast 2025-2030 ($ million)
Data Table on Brazil - Market size and forecast 2025-2030 ($ million)
Chart on Brazil - Year-over-year growth 2025-2030 (%)
Data Table on Brazil - Year-over-year growth 2025-2030 (%)

12.6.2 Argentina - Market size and forecast 2025-2030

Chart on Argentina - Market size and forecast 2025-2030 ($ million)
Data Table on Argentina - Market size and forecast 2025-2030 ($ million)
Chart on Argentina - Year-over-year growth 2025-2030 (%)
Data Table on Argentina - Year-over-year growth 2025-2030 (%)

12.6.3 Chile - Market size and forecast 2025-2030

Chart on Chile - Market size and forecast 2025-2030 ($ million)
Data Table on Chile - Market size and forecast 2025-2030 ($ million)
Chart on Chile - Year-over-year growth 2025-2030 (%)
Data Table on Chile - Year-over-year growth 2025-2030 (%)

12.7 Middle East and Africa - Market size and forecast 2025-2030

Chart on Middle East and Africa - Market size and forecast 2025-2030 ($ million)
Data Table on Middle East and Africa - Market size and forecast 2025-2030 ($ million)
Chart on Middle East and Africa - Year-over-year growth 2025-2030 (%)
Data Table on Middle East and Africa - Year-over-year growth 2025-2030 (%)
Chart on Regional Comparison - Middle East and Africa
Data Table on Regional Comparison - Middle East and Africa

12.7.1 Saudi Arabia - Market size and forecast 2025-2030

Chart on Saudi Arabia - Market size and forecast 2025-2030 ($ million)
Data Table on Saudi Arabia - Market size and forecast 2025-2030 ($ million)
Chart on Saudi Arabia - Year-over-year growth 2025-2030 (%)
Data Table on Saudi Arabia - Year-over-year growth 2025-2030 (%)

12.7.2 Turkey - Market size and forecast 2025-2030

Chart on Turkey - Market size and forecast 2025-2030 ($ million)
Data Table on Turkey - Market size and forecast 2025-2030 ($ million)
Chart on Turkey - Year-over-year growth 2025-2030 (%)
Data Table on Turkey - Year-over-year growth 2025-2030 (%)

12.7.3 UAE - Market size and forecast 2025-2030

Chart on UAE - Market size and forecast 2025-2030 ($ million)
Data Table on UAE - Market size and forecast 2025-2030 ($ million)
Chart on UAE - Year-over-year growth 2025-2030 (%)
Data Table on UAE - Year-over-year growth 2025-2030 (%)

12.7.4 Egypt - Market size and forecast 2025-2030

Chart on Egypt - Market size and forecast 2025-2030 ($ million)
Data Table on Egypt - Market size and forecast 2025-2030 ($ million)
Chart on Egypt - Year-over-year growth 2025-2030 (%)
Data Table on Egypt - Year-over-year growth 2025-2030 (%)

12.7.5 Qatar - Market size and forecast 2025-2030

Chart on Qatar - Market size and forecast 2025-2030 ($ million)
Data Table on Qatar - Market size and forecast 2025-2030 ($ million)
Chart on Qatar - Year-over-year growth 2025-2030 (%)
Data Table on Qatar - Year-over-year growth 2025-2030 (%)

12.8 Market opportunity by geography

Market opportunity by geography ($ million)
Data Tables on Market opportunity by geography ($ million)

13. Drivers, Challenges, and Opportunity

13.1 Market drivers

Increasing integration of immersive VR and generative AI tools
Rising demand for biophilic design
Growing adoption of circular economy principles

13.2 Market challenges

Decarbonization and complexity of sustainable material procurement
Technological integration gap and digital literacy requirements
Global supply chain volatility and material scarcity

13.3 Impact of drivers and challenges

Impact of drivers and challenges in 2025 and 2030

13.4 Market opportunities

Imperative of sustainable and wellness-oriented design
Sustainable interior design evolution and material innovation
Influence of rising urbanization and disposable income

14. Competitive Landscape

14.1 Overview

14.2

Overview on criticality of inputs and factors of differentiation

14.3 Landscape disruption

Overview on factors of disruption

14.4 Industry risks

Impact of key risks on business

15. Competitive Analysis

15.1 Companies profiled

Companies covered

15.2 Company ranking index

15.3 Market positioning of companies

Matrix on companies position and classification

15.4 Aero Studios

Aero Studios - Overview
Aero Studios - Product / Service
Aero Studios - Key offerings
SWOT

15.5 ARRCC

ARRCC - Overview
ARRCC - Product / Service
ARRCC - Key offerings
SWOT

15.6 AvroKO

AvroKO - Overview
AvroKO - Product / Service
AvroKO - Key offerings
SWOT

15.7 BDP

BDP - Overview
BDP - Product / Service
BDP - Key offerings
SWOT

15.8 Champalimaud Design

Champalimaud Design - Overview
Champalimaud Design - Product / Service
Champalimaud Design - Key offerings
SWOT

15.9 Clive Wilkinson Architects

Clive Wilkinson Architects - Overview
Clive Wilkinson Architects - Product / Service
Clive Wilkinson Architects - Key offerings
SWOT

15.10 Gensler. M. Arthur Gensler Jr.

Gensler. M. Arthur Gensler Jr. - Overview
Gensler. M. Arthur Gensler Jr. - Product / Service
Gensler. M. Arthur Gensler Jr. - Key offerings
SWOT

15.11 HOK Group Inc.

HOK Group Inc. - Overview
HOK Group Inc. - Product / Service
HOK Group Inc. - Key offerings
SWOT

15.12 Interior Architects Inc.

Interior Architects Inc. - Overview
Interior Architects Inc. - Product / Service
Interior Architects Inc. - Key offerings
SWOT

15.13 Jacobs Solutions Inc.

Jacobs Solutions Inc. - Overview
Jacobs Solutions Inc. - Product / Service
Jacobs Solutions Inc. - Key offerings
SWOT

15.14 Kelly Wearstler

Kelly Wearstler - Overview
Kelly Wearstler - Product / Service
Kelly Wearstler - Key offerings
SWOT

15.15 Krista Home

Krista Home - Overview
Krista Home - Product / Service
Krista Home - Key offerings
SWOT

15.16 Nicole Davis Interiors

Nicole Davis Interiors - Overview
Nicole Davis Interiors - Product / Service
Nicole Davis Interiors - Key offerings
SWOT

15.17 Space Matrix

Space Matrix - Overview
Space Matrix - Product / Service
Space Matrix - Key offerings
SWOT

15.18 Wilson Associates

Wilson Associates - Overview
Wilson Associates - Product / Service
Wilson Associates - Key offerings
SWOT

16. Appendix

16.1 Scope of the report

Market definition
Objectives
Notes and caveats

16.2 Inclusions and exclusions checklist

Inclusions checklist
Exclusions checklist

16.3 Currency conversion rates for US$

16.4 Research methodology

16.5 Data procurement

Information sources

16.6 Data validation

16.7 Validation techniques employed for market sizing

16.8 Data synthesis

16.9 360 degree market analysis

16.10 List of abbreviations

Research Methodology

Technavio presents a detailed picture of the market by way of study, synthesis, and summation of data from multiple sources. The analysts have presented the various facets of the market with a particular focus on identifying the key industry influencers. The data thus presented is comprehensive, reliable, and the result of extensive research, both primary and secondary.

INFORMATION SOURCES

Primary sources

  • Manufacturers and suppliers
  • Channel partners
  • Industry experts
  • Strategic decision makers

Secondary sources

  • Industry journals and periodicals
  • Government data
  • Financial reports of key industry players
  • Historical data
  • Press releases

DATA ANALYSIS

Data Synthesis

  • Collation of data
  • Estimation of key figures
  • Analysis of derived insights

Data Validation

  • Triangulation with data models
  • Reference against proprietary databases
  • Corroboration with industry experts

REPORT WRITING

Qualitative

  • Market drivers
  • Market challenges
  • Market trends
  • Five forces analysis

Quantitative

  • Market size and forecast
  • Market segmentation
  • Geographical insights
  • Competitive landscape

Interested in this report?

Get your sample now to see our research methodology and insights!

Download Now

Frequently Asked Questions

Interior Design Services market growth will increase by USD 31959.5 million during 2026-2030.

The Interior Design Services market is expected to grow at a CAGR of 4.4% during 2026-2030.

Interior Design Services market is segmented by End-user (Commercial, Residential) Application (Newly decorated, Repeated decorated) Price range (Mid range, Premium, Economy)

Aero Studios, ARRCC, AvroKO, BDP, Champalimaud Design, Clive Wilkinson Architects, Gensler. M. Arthur Gensler Jr., HOK Group Inc., Interior Architects Inc., Jacobs Solutions Inc., Kelly Wearstler, Krista Home, NELSON Worldwide LLC, Nicole Davis Interiors, Oktra Ltd, Perkins and Will International, Rockwell Group, Space Matrix, Wilson Associates, Yabu Pushelberg are a few of the key vendors in the Interior Design Services market.

APAC will register the highest growth rate of 42.3% among the other regions. Therefore, the Interior Design Services market in APAC is expected to garner significant business opportunities for the vendors during the forecast period.

China, Japan, South Korea, India, Australia, Singapore, US, Canada, Mexico, Germany, UK, France, Spain, Italy, Russia, Brazil, Argentina, Chile, Saudi Arabia, Turkey, UAE, Egypt, Qatar

  • Increasing integration of immersive VR and generative AI tools is the driving factor this market.

The Interior Design Services market vendors should focus on grabbing business opportunities from the End-user segment as it accounted for the largest market share in the base year.