
Internet Of Things Fleet Management Market Size and Growth Forecast 2026-2030
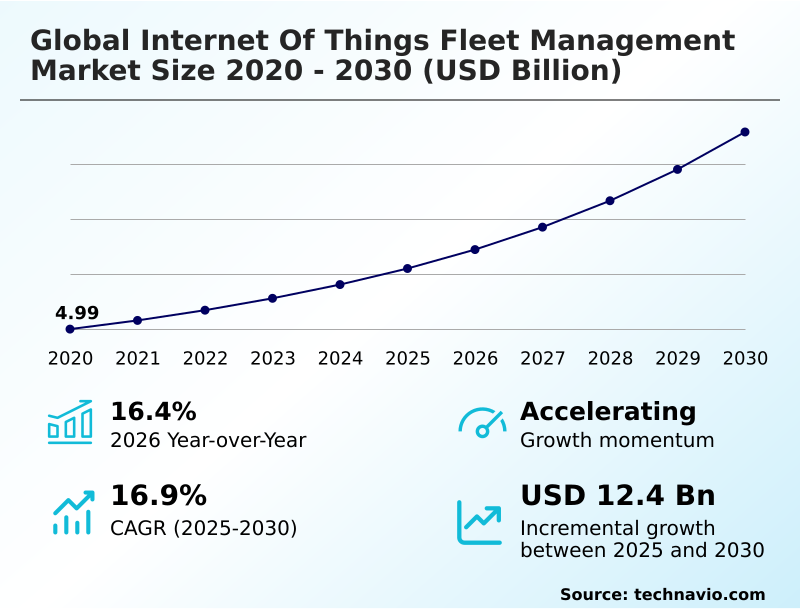
The Internet Of Things Fleet Management Market size was valued at USD 10.50 billion in 2025 growing at a CAGR of 16.9% during the forecast period 2026-2030.
North America accounts for 36.1% of incremental growth during the forecast period. The Device management segment by Platform was valued at USD 4.83 billion in 2024, while the Vehicle tracking and monitoring segment holds the largest revenue share by Solution.
The market is projected to grow by USD 17.92 billion from 2020 to 2030, with USD 12.41 billion of the growth expected during the forecast period of 2025 to 2030.
Get Key Insights on Market Forecast (PDF) Request Free Sample
Internet Of Things Fleet Management Market Overview
The Internet Of Things fleet management market is defined by the digitalization of logistics to enhance operational efficiency and ensure regulatory compliance. Driven by a year-over-year growth of 16.4%, the industry is moving beyond basic location services to embrace comprehensive fleet analytics platforms. North America contributes over 36% to the market's incremental growth, largely due to stringent mandates such as the ELD rule, which necessitates automated data logging. In practice, a regional last-mile delivery operator using video telematics and AI-powered driver coaching can reduce at-fault accidents and lower insurance premiums. By implementing geofencing for delivery zones and real-time route optimization, these firms can improve on-time performance and fuel economy. The integration of remote diagnostics and predictive maintenance alerts minimizes vehicle downtime, a critical factor in maintaining service level agreements. This transition to data-driven decision-making is essential for managing total cost of ownership and staying competitive.
Drivers, Trends, and Challenges in the Internet Of Things Fleet Management Market
The evolution of the Internet Of Things fleet management market is marked by a decisive shift from standalone tracking to integrated operational intelligence. Procurement decisions now center on platforms that unify disparate functions to drive down the total cost of ownership.
For instance, AI in fleet management for predictive maintenance is becoming standard, as it allows maintenance to be scheduled based on actual component wear data rather than fixed intervals. This is especially critical for specialized operations, where IoT solutions for cold chain logistics compliance are essential to meet standards like the FDA's Food Safety Modernization Act (FSMA).
For commercial trucking, implementing telematics systems for commercial truck safety that incorporate video telematics for driver risk assessment can reduce preventable accidents by a measure significantly greater than basic GPS tracking alone. As fleet electrification accelerates, the demand for sophisticated EV fleet charging management software is surging, with a focus on smart charging strategies to minimize energy costs.
Ultimately, the effective use of real-time fleet tracking for logistics companies, enhanced with geofencing alerts for asset security and driver behavior monitoring to lower insurance premiums, is what defines a resilient and competitive modern supply chain. This requires robust cybersecurity for connected commercial vehicles and streamlined OTA updates for telematics device management.
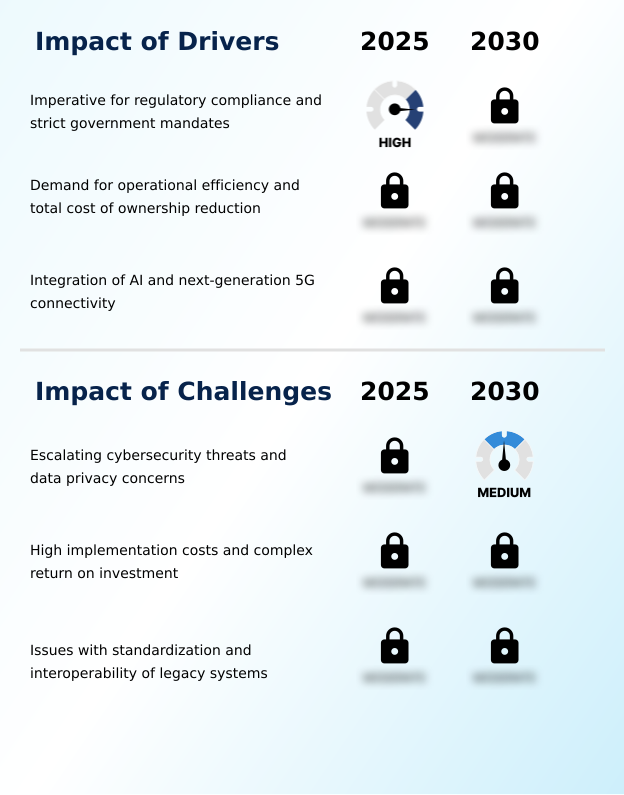
Primary Growth Driver: The imperative for regulatory compliance, driven by strict government mandates on safety and emissions, is a key driver for market adoption.
Market growth is fundamentally driven by the dual imperatives of regulatory adherence and operational cost reduction.
Strict government mandates, such as the ELD rule in North America for hours-of-service tracking, have made ELD compliance a baseline requirement, fueling initial technology adoption.
Beyond compliance, the relentless pursuit of lower total cost of ownership (TCO) is a powerful driver, compelling fleet operators to invest in fuel management systems and predictive maintenance alerts to minimize expenses.
The market's strong year-over-year growth of 16.4% underscores the financial and regulatory pressures pushing for adoption.
This is further amplified by technological advancements, where the integration of 5G and AI enables more sophisticated capabilities like real-time route optimization and advanced V2X communication, offering deeper operational insights.
Emerging Market Trend: The integration of edge computing and artificial intelligence is establishing a new paradigm in predictive telematics. This shift enables real-time, on-device data processing for immediate operational insights and safety alerts.
Key market trends are centered on the convergence of artificial intelligence with edge computing, enabling advanced predictive telematics. This shift facilitates on-device processing for applications like real-time driver fatigue detection, reducing latency and reliance on constant cloud connectivity.
Concurrently, the electrification of commercial fleets is creating a distinct ecosystem for EV fleet management, where specialized software and smart charging solutions are essential for managing range anxiety and optimizing energy costs. This is particularly prevalent in the APAC region, which is experiencing high growth in logistics modernization.
As vehicle data volumes grow, so does the emphasis on robust data security architecture and new usage-based insurance (UBI) models, which leverage granular telematics data to assess risk and reward safe driving behavior.
Key Industry Challenge: Escalating cybersecurity threats and data privacy concerns present a key challenge affecting industry growth.
Significant market challenges persist, led by escalating cybersecurity threats that frame connected vehicles as vulnerable attack surfaces, demanding robust security protocols. High upfront implementation costs and the complexity of demonstrating immediate ROI remain considerable barriers, particularly for smaller enterprises evaluating a new fleet management platform. Furthermore, the lack of industry-wide interoperability standards creates significant friction.
Integrating new telematics systems with a diverse range of OEM hardware and legacy system integration points often results in data silos, undermining the goal of achieving unified fleet analytics. Navigating complex data privacy compliance frameworks, such as GDPR, adds another layer of operational complexity and cost, tempering the pace of adoption despite the clear long-term benefits of digitalization.
Explore Full Market Dynamics Analysis Request Free Sample
Internet Of Things Fleet Management Market Segmentation
The internet of things fleet management industry research report provides comprehensive data including region-wise segment analysis, with forecasts and analysis for the period 2026-2030, as well as historical data from 2020-2024 for the following segments.
Platform Segment Analysis
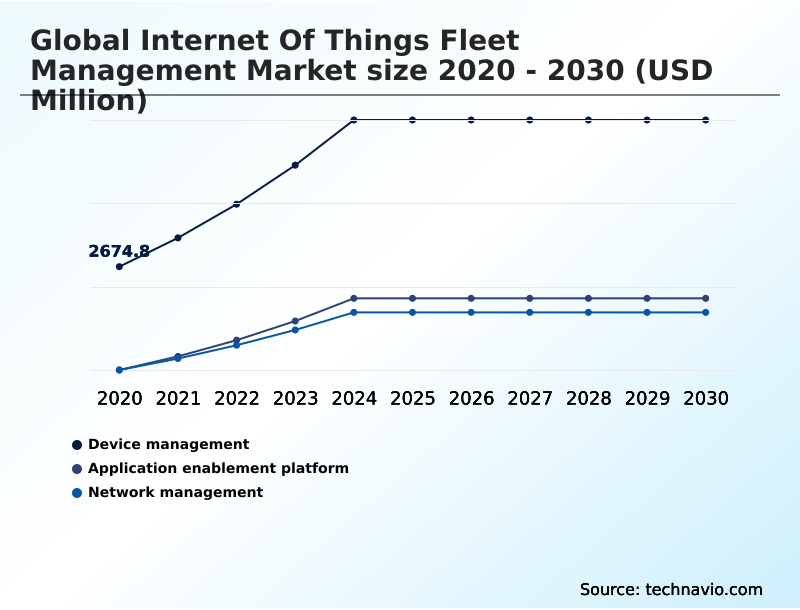
The device management segment is estimated to witness significant growth during the forecast period.
The device management segment is a foundational pillar of the Internet of Things fleet management market, responsible for provisioning, authenticating, and maintaining the physical hardware deployed across assets.
This segment, commanding a significant share of the market, addresses the full IoT device lifecycle, from initial hardware provisioning to end-of-life decommissioning.
Robust platforms are essential for facilitating Over-The-Air (OTA) updates, which allow for remote device configuration and firmware management without requiring vehicle downtime. This capability is critical for deploying cybersecurity protocols and maintaining resilience against new threats.
As fleets scale, centralized control over edge device security and configuration becomes paramount for ensuring data integrity and operational continuity, making these platforms a core component of any large-scale deployment.
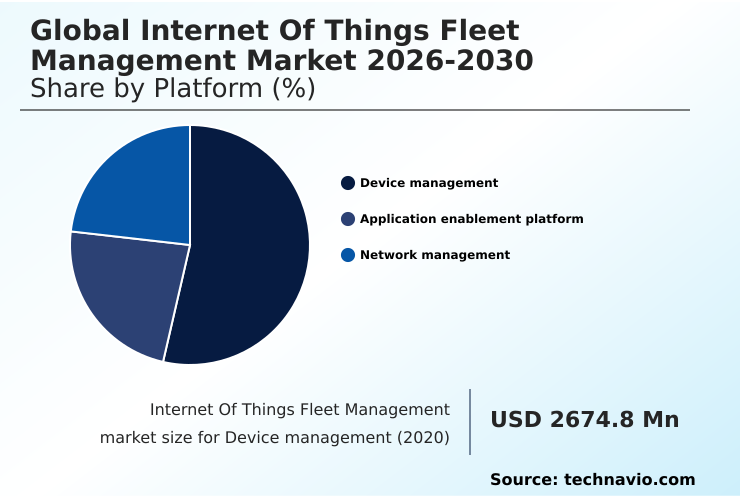
The Device management segment was valued at USD 4.83 billion in 2024 and showed a gradual increase during the forecast period.
Internet Of Things Fleet Management Market by Region: North America Leads with 36.1% Growth Share
North America is estimated to contribute 36.1% to the growth of the global market during the forecast period.
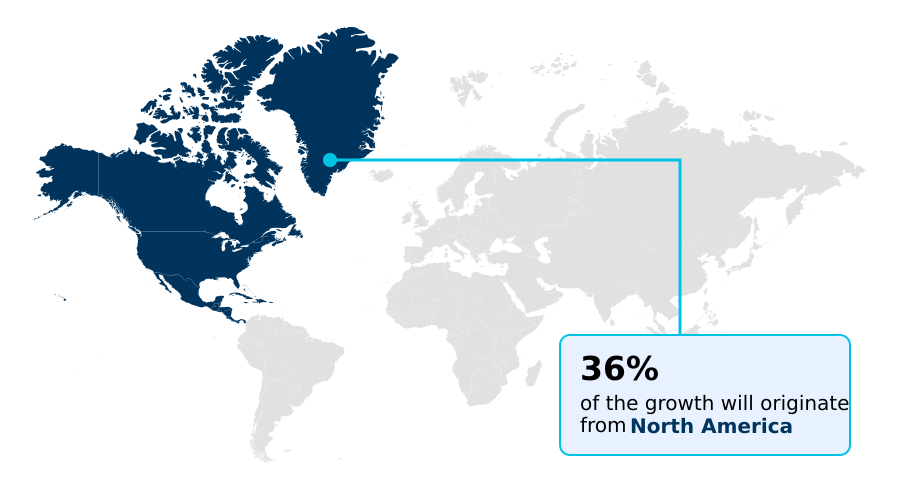
The geographic landscape of the Internet Of Things fleet management market is diverse, with North America representing the largest opportunity, accounting for over 36% of the market's growth.
This region's maturity is driven by strict regulatory compliance management, particularly the ELD mandate, and a focus on insurance telematics.
In contrast, Europe, which holds more than 27% of the market share, is heavily influenced by decarbonization targets and GDPR data privacy compliance, spurring demand for EV fleet management and eco-driving solutions.
The APAC region is the fastest-growing, fueled by e-commerce expansion that necessitates advanced last-mile delivery optimization and mobile-based asset tracking solutions.
Across all regions, the core need for fuel management systems and fleet safety solutions remains a constant, though the technological approach and regulatory pressures vary significantly, shaping vendor strategy and product development.
Customer Landscape Analysis for the Internet Of Things Fleet Management Market
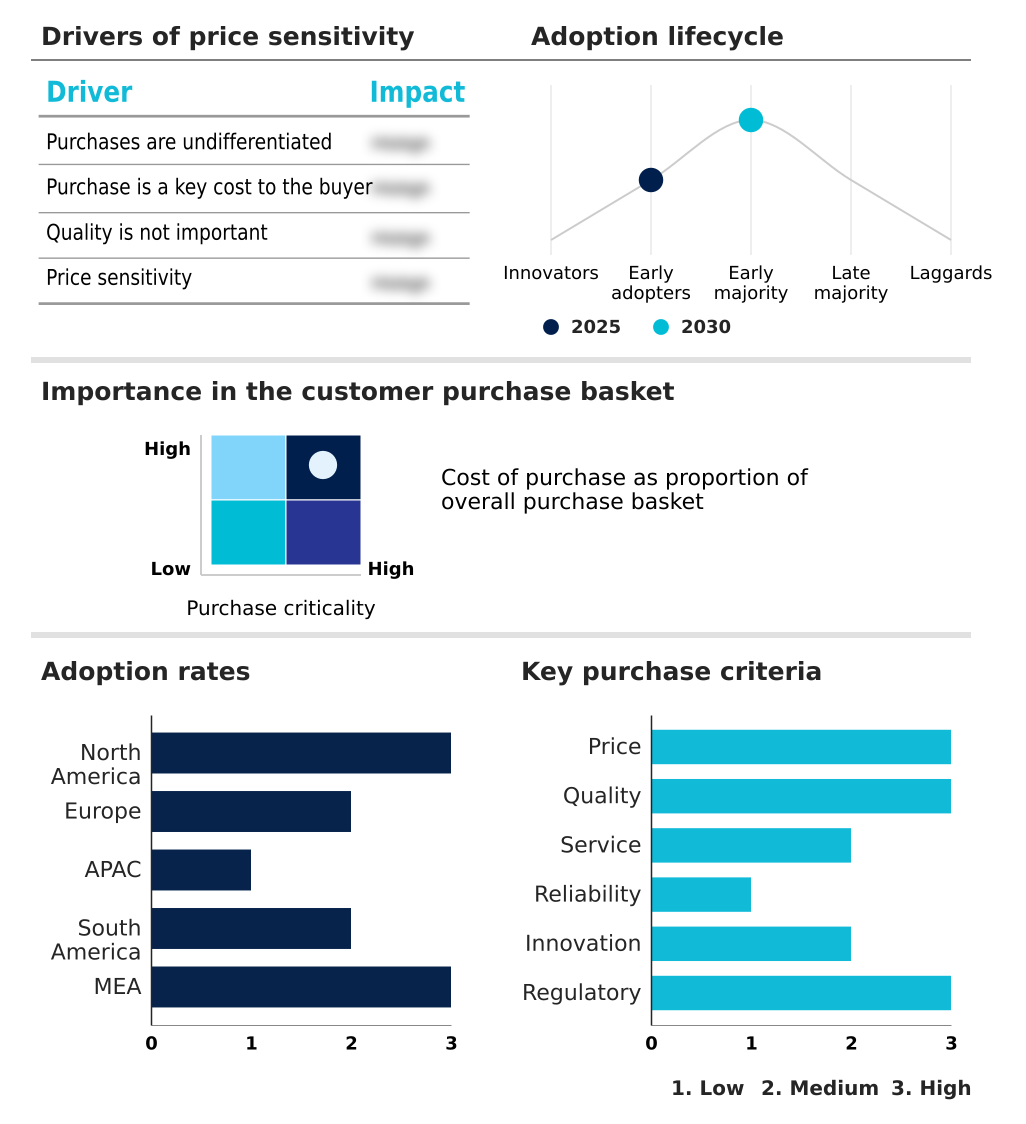
The internet of things fleet management market forecasting report includes the adoption lifecycle of the market, covering from the innovator’s stage to the laggard’s stage. It focuses on adoption rates in different regions based on penetration. Furthermore, the internet of things fleet management market report also includes key purchase criteria and drivers of price sensitivity to help companies evaluate and develop their market growth analysis strategies.
Competitive Landscape of the Internet Of Things Fleet Management Market
Companies are implementing various strategies, such as strategic alliances, partnerships, mergers and acquisitions, geographical expansion, and product/service launches, to enhance their presence in the internet of things fleet management market industry.
Amazon.com Inc. - Provides scalable cloud infrastructure for secure registration, organization, and remote management of connected vehicle fleets, enabling enterprise-level device oversight.
The industry research and growth report includes detailed analyses of the competitive landscape of the market and information about key companies, including:
- Amazon.com Inc.
- Bridgestone Corp.
- Cisco Systems Inc.
- Ctrack
- Descartes Systems Group Inc.
- Fleet Complete
- Fleetio
- Geotab Inc.
- GPS Insight
- Michelin
- ORBCOMM Inc.
- Platform Science Inc.
- Quartix Technologies plc
- Samsara Inc.
- Semtech Corp.
- Solera Holdings LLC
- Teletrac Navman US Ltd.
- TELUS Corp.
- Verizon Communications Inc.
- Vodafone Group Plc
Qualitative and quantitative analysis of companies has been conducted to help clients understand the wider business environment as well as the strengths and weaknesses of key industry players. Data is qualitatively analyzed to categorize companies as pure play, category-focused, industry-focused, and diversified; it is quantitatively analyzed to categorize companies as dominant, leading, strong, tentative, and weak.
Recent Developments in the Internet Of Things Fleet Management Market
- In March, 2025, Fleetio, a fleet optimization software provider, announced the acquisition of Auto Integrate, a maintenance authorization platform, positioning Fleetio as a preferred solution for comprehensive fleet maintenance.
- In June, 2025, Samsara Inc. and Element Fleet Management Corp. announced a joint fleet and operations management offering to streamline vehicle procurement and enhance safety through integrated product solutions.
- In August, 2025, Solera announced the launch of the Solera Fleet Platform, an AI-driven solution designed to enhance operational visibility and control by consolidating existing tools into a unified, connected ecosystem.
- In November, 2025, Samsara introduced Smart Compliance, Weather Intelligence, and the Samsara Avatar to address challenges for European operators, including tachograph regulations, driver safety, and scalable AI-based coaching.
Research Analyst Overview: Internet Of Things Fleet Management Market
The Internet Of Things fleet management market has matured beyond simple asset location, now focusing on integrated operational intelligence that directly impacts profitability. Boardroom-level decisions on capital expenditure increasingly weigh the total cost of ownership benefits from predictive maintenance alerts against the heightened cybersecurity risks of hyper-connected fleets.
Compliance with mandates like the US Electronic Logging Device (ELD) rule is now table stakes; competitive differentiation is achieved by leveraging video telematics and AI-powered driver coaching to proactively reduce liability and lower insurance premiums.
A unified fleet analytics platform is essential, integrating data from fuel consumption monitoring, remote diagnostics, and driver behavior analysis to provide a single source of truth. The deployment of geofencing, advanced route optimization, and Vehicle-to-Everything (V2X) communication technologies are no longer niche capabilities but core components of a modern logistics strategy.
Successful adoption hinges on seamless Engine Control Module (ECM) integration and robust telematics hardware capable of supporting these complex data streams securely.
Dive into Technavio’s robust research methodology, blending expert interviews, extensive data synthesis, and validated models for unparalleled Internet Of Things Fleet Management Market insights. See full methodology.
| Market Scope | |
|---|---|
| Page number | 335 |
| Base year | 2025 |
| Historic period | 2020-2024 |
| Forecast period | 2026-2030 |
| Growth momentum & CAGR | Accelerate at a CAGR of 16.9% |
| Market growth 2026-2030 | USD 12405.0 million |
| Market structure | Fragmented |
| YoY growth 2025-2026(%) | 16.4% |
| Key countries | US, Canada, Mexico, Germany, UK, France, Italy, Spain, The Netherlands, China, India, Japan, South Korea, Australia, Indonesia, Brazil, Argentina, Colombia, Saudi Arabia, UAE, South Africa, Egypt and Turkey |
| Competitive landscape | Leading Companies, Market Positioning of Companies, Competitive Strategies, and Industry Risks |
Internet Of Things Fleet Management Market: Key Questions Answered in This Report
-
What is the expected growth of the Internet Of Things Fleet Management Market between 2026 and 2030?
-
The Internet Of Things Fleet Management Market is expected to grow by USD 12.41 billion during 2026-2030, registering a CAGR of 16.9%. Year-over-year growth in 2026 is estimated at 16.4%%. This acceleration is shaped by imperative for regulatory compliance and strict government mandates, which is intensifying demand across multiple end-use verticals covered in the report.
-
-
What segmentation does the market report cover?
-
The report is segmented by Platform (Device management, Application enablement platform, and Network management), Solution (Vehicle tracking and monitoring, Fleet analytics, Fuel management, Predictive maintenance, and Others), Service (Professional, and Managed), Business Segment (Large enterprise, and Small and medium enterprise), Deployment (Public, Private, and Hybrid) and Geography (North America, Europe, APAC, South America, Middle East and Africa). Among these, the Device management segment is estimated to witness significant growth during the forecast period, driven by rising adoption across key application areas. Each segment includes detailed qualitative and quantitative analysis, along with historical data from 2020-2024 and forecasts through 2030 with year-over-year growth rates.
-
-
Which regions are analyzed in the report?
-
The report covers North America, Europe, APAC, South America and Middle East and Africa. North America is estimated to contribute 36.1% to market growth during the forecast period. Country-level analysis includes US, Canada, Mexico, Germany, UK, France, Italy, Spain, The Netherlands, China, India, Japan, South Korea, Australia, Indonesia, Brazil, Argentina, Colombia, Saudi Arabia, UAE, South Africa, Egypt and Turkey, with dedicated market size tables and year-over-year growth for each.
-
-
What are the key growth drivers and market challenges?
-
The primary driver is imperative for regulatory compliance and strict government mandates, which is accelerating investment and industry demand. The main challenge is escalating cybersecurity threats and data privacy concerns, creating operational barriers for key market participants. The report quantifies the impact of each driver and challenge across 2026 and 2030 with comparative analysis.
-
-
Who are the major players in the Internet Of Things Fleet Management Market?
-
Key vendors include Amazon.com Inc., Bridgestone Corp., Cisco Systems Inc., Ctrack, Descartes Systems Group Inc., Fleet Complete, Fleetio, Geotab Inc., GPS Insight, Michelin, ORBCOMM Inc., Platform Science Inc., Quartix Technologies plc, Samsara Inc., Semtech Corp., Solera Holdings LLC, Teletrac Navman US Ltd., TELUS Corp., Verizon Communications Inc. and Vodafone Group Plc. The report provides qualitative and quantitative analysis categorizing companies as dominant, leading, strong, tentative, and weak based on their market positioning. Company profiles include business segment analysis, SWOT assessment, key offerings, and recent strategic developments.
-
Internet Of Things Fleet Management Market Research Insights
Market dynamics are shaped by the dual pressures of achieving total cost of ownership reduction and navigating stringent regulatory frameworks. Adherence to standards like the General Data Protection Regulation (GDPR) in Europe mandates sophisticated data security architecture and influences platform design for global operators.
While North America represents the largest share of incremental growth, the APAC region is demonstrating accelerated adoption, driven by mobile-first telematics data analytics and the expansion of last-mile delivery optimization. The push for supply chain visibility is universal, compelling fleets to adopt solutions for cold chain monitoring and real-time asset tracking.
This evolution demands platforms that not only provide connected vehicle data but also offer robust driver safety monitoring and facilitate the transition toward EV fleet management, balancing efficiency gains with compliance and security imperatives.
We can help! Our analysts can customize this internet of things fleet management market research report to meet your requirements.
 RIA -
RIA - 
