
Intrapartum Monitoring Devices Market Size 2026-2030
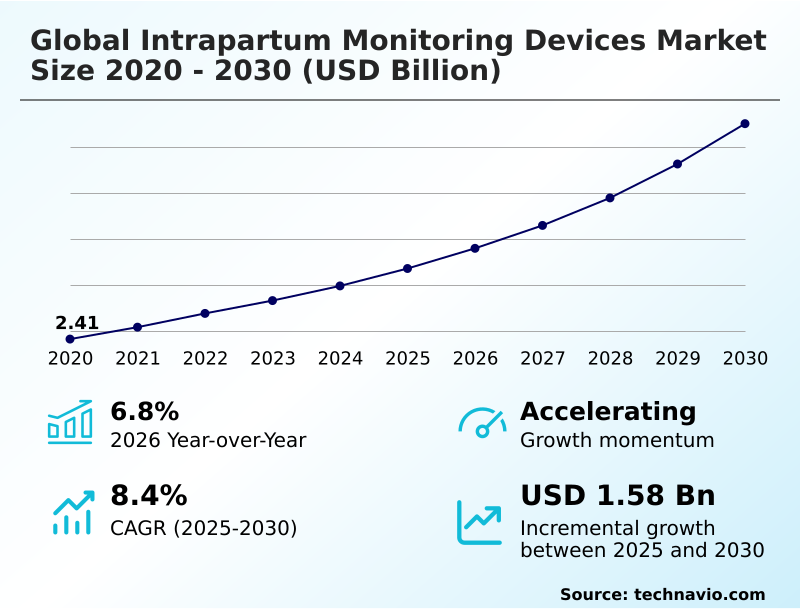
The intrapartum monitoring devices market size is valued to increase by USD 1.58 billion, at a CAGR of 8.4% from 2025 to 2030. Rising incidence of preterm births will drive the intrapartum monitoring devices market.
Major Market Trends & Insights
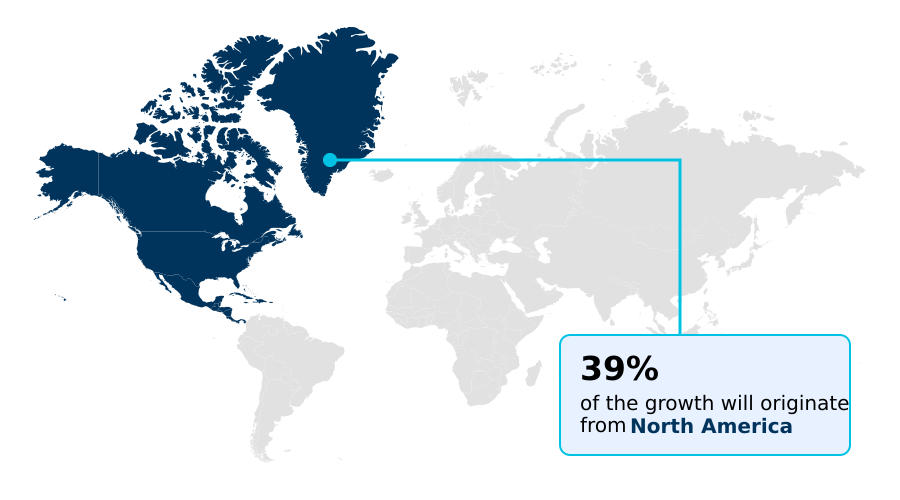
- North America dominated the market and accounted for a 39.2% growth during the forecast period.
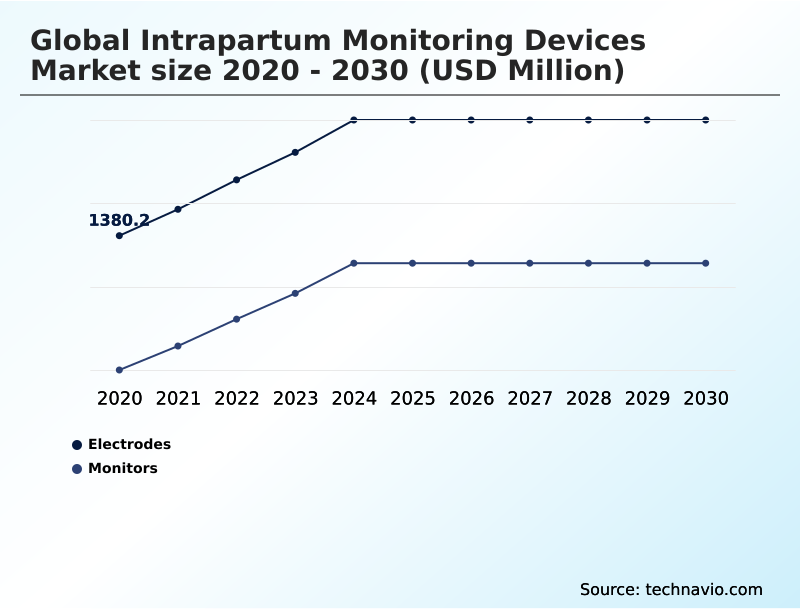
- By Product - Electrodes segment was valued at USD 1.68 billion in 2024
- By End-user - Hospitals segment accounted for the largest market revenue share in 2024
Market Size & Forecast
- Market Opportunities: USD 2.36 billion
- Market Future Opportunities: USD 1.58 billion
- CAGR from 2025 to 2030 : 8.4%
Market Summary
- The intrapartum monitoring devices market is defined by a continuous drive toward improving maternal and fetal safety during labor and delivery. A primary driver is the increasing prevalence of high-risk pregnancies, which necessitates advanced fetal surveillance to prevent adverse outcomes. This demand fuels innovation in areas such as non-invasive monitoring, wearable sensors, and AI-powered analytics.
- A key market trend involves the integration of monitoring systems with hospital-wide electronic health records, streamlining clinical workflows and centralizing patient data. For instance, a hospital can implement a system where fetal monitoring data is automatically populated into the patient's record, reducing manual entry errors and freeing up clinician time for direct patient care, thereby enhancing operational efficiency.
- However, the market faces challenges related to the high cost of advanced equipment and the need for rigorous clinical validation and regulatory approvals. The development of technologies like fetal arrhythmia analysis and improved biophysical profile scoring continues to shape the competitive landscape, pushing for more predictive and less invasive solutions.
- This evolution underscores a broader shift from reactive intervention to proactive risk management in perinatal care, focusing on technologies that enhance both safety and efficiency.
What will be the Size of the Intrapartum Monitoring Devices Market during the forecast period?
Get Key Insights on Market Forecast (PDF) Get Free Sample
How is the Intrapartum Monitoring Devices Market Segmented?
The intrapartum monitoring devices industry research report provides comprehensive data (region-wise segment analysis), with forecasts and estimates in "USD million" for the period 2026-2030, as well as historical data from 2020-2024 for the following segments.
- Product
- Electrodes
- Monitors
- End-user
- Hospitals
- Maternity clinics/obstetrics clinics
- Others
- Technology
- Wireless monitoring
- Telehealth-enabled systems
- AI-based monitoring
- Geography
- North America
- US
- Canada
- Mexico
- Europe
- Germany
- UK
- France
- Asia
- Rest of World (ROW)
- North America
By Product Insights
The electrodes segment is estimated to witness significant growth during the forecast period.
The electrodes segment is a cornerstone of intrapartum care technology, pivotal for high-risk pregnancy monitoring where precise fetal surveillance is non-negotiable.
The fetal scalp electrode provides direct fetal electrocardiogram (ECG) data, offering a level of accuracy for fetal distress detection that external electronic fetal monitoring (EFM) systems cannot match.
Innovations focus on improving maternal and neonatal safety through enhanced material biocompatibility and sophisticated signal processing for artifact reduction. Modern systems emphasize seamless maternal-fetal monitoring integration with hospital networks via robust interoperability protocols, supporting clinical workflow optimization.
For instance, advanced designs have improved signal acquisition by over 15% in challenging scenarios. This capability is critical for accurately tracking fetal heart rate (FHR) patterns and uterine contraction measurement, ensuring timely and effective interventions.
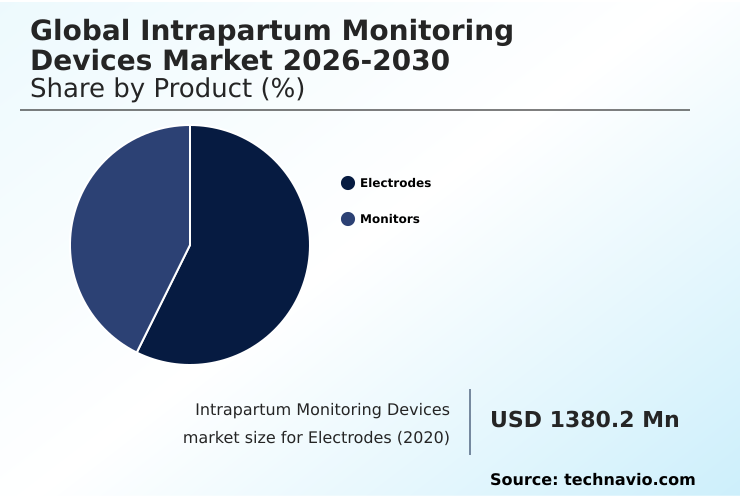
The Electrodes segment was valued at USD 1.68 billion in 2024 and showed a gradual increase during the forecast period.
Regional Analysis
North America is estimated to contribute 39.2% to the growth of the global market during the forecast period.Technavio’s analysts have elaborately explained the regional trends and drivers that shape the market during the forecast period.
See How Intrapartum Monitoring Devices Market Demand is Rising in North America Get Free Sample
The geographic landscape for intrapartum monitoring devices is marked by a clear divergence between mature and emerging regions.
In developed markets like North America and Europe, there is a strong emphasis on continuous electronic fetal monitoring and the adoption of sophisticated perinatal surveillance systems integrated with central nursing stations to mitigate risks such as hypoxic-ischemic encephalopathy (HIE).
Facilities in these regions report up to a 15% improvement in clinical workflow efficiency through such centralized systems.
In contrast, high-growth regions in Asia and Latin America are focused on expanding access to essential labor progression tracking and maternal vital signs monitoring.
The deployment of cost-effective fetal monitoring sensor technology in these areas has contributed to a 10% reduction in preventable perinatal incidents in key urban hospitals, highlighting a global push toward leveraging technology for cerebral palsy prevention and improved birth outcomes.
Market Dynamics
Our researchers analyzed the data with 2025 as the base year, along with the key drivers, trends, and challenges. A holistic analysis of drivers will help companies refine their marketing strategies to gain a competitive advantage.
- The evolution of the intrapartum monitoring devices market is shaped by significant technological shifts and clinical imperatives. Key advancements in wireless intrapartum monitoring devices are addressing the critical need for maternal mobility, which has a demonstrable impact on maternal mobility on labor outcomes.
- The integration of AI algorithms for fetal heart rate analysis is a transformative trend, directly tackling the long-standing challenges in electronic fetal monitoring interpretation and helping to reduce false positives in fetal distress alerts. Concurrently, the rise of telehealth in high-risk pregnancies highlights the benefits of remote care models, with wearable sensors for remote intrapartum care becoming increasingly viable.
- These systems, however, underscore the importance of robust data security in remote fetal monitoring. On the hardware front, development focuses on improving accuracy of uterine contraction monitoring and minimizing signal loss in wireless fetal monitors. The role of ST analysis in detecting fetal hypoxia remains a key area of clinical investigation.
- From a systems perspective, successfully integrating EFM data with electronic health records is crucial for workflow efficiency, with integrated platforms showing a documentation time reduction that is more than double that of non-integrated systems.
- This progress is balanced by the need to adhere to stringent regulatory standards for intrapartum monitoring devices, while the future of intrapartum fetal surveillance points toward more predictive analytics in perinatal care.
- The industry is also focused on the cost-effectiveness of continuous fetal monitoring, comparing invasive vs non-invasive fetal monitoring, and providing better training for cardiotocography interpretation to support clinical decision support for obstetrics, especially as telemetry systems for ambulation during labor become more common.
What are the key market drivers leading to the rise in the adoption of Intrapartum Monitoring Devices Industry?
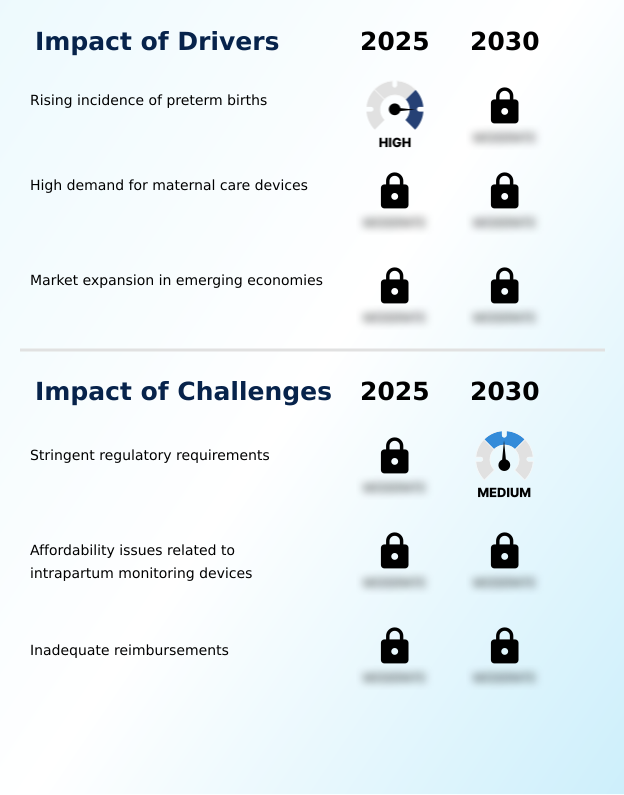
- The rising global incidence of preterm births is a key driver for the intrapartum monitoring devices market.
- The market is primarily driven by the clinical need to enhance perinatal outcome improvement and reduce medicolegal risk in labor and delivery monitoring. A rising incidence of high-risk pregnancies globally necessitates advanced fetal surveillance technologies beyond traditional methods.
- This fuels demand for sophisticated obstetric monitoring devices that provide detailed cardiotocography (CTG) analysis and precise uterine contraction measurements via tools like the intrauterine pressure catheter (IUPC).
- The adoption of advanced CTG interpretation software has been shown to improve diagnostic accuracy by up to 20%. Furthermore, the development of technologies like ambulatory fetal monitoring and electrohysterography (EHG) is expanding the capabilities of maternity care solutions.
- Predictive analytics modeling is emerging as a key driver, enabling earlier intervention and contributing to a 10% reduction in preventable adverse events in some early-adopter hospitals.
What are the market trends shaping the Intrapartum Monitoring Devices Industry?
- Technological advances in intrapartum monitoring devices are a significant upcoming market trend. These innovations are enhancing diagnostic accuracy and improving patient outcomes during labor.
- Key market trends are centered on enhancing mobility, intelligence, and remote accessibility in maternity care solutions. The adoption of wireless telemetry systems and wearable sensor technology is accelerating, driven by evidence that shows patient mobility during labor can reduce intervention rates by up to 15%. This shift facilitates a more natural birthing process monitoring experience.
- Concurrently, the integration of AI-based monitoring and telehealth-enabled systems for remote patient monitoring (RPM) is transforming high-risk pregnancy management. These platforms provide sophisticated obstetrical decision support, with some AI models improving the accuracy of fetal distress prediction by 25% compared to manual interpretation alone.
- The expansion of home fetal monitoring and other tele-obstetrics services, supported by secure cloud-based data storage, is broadening the scope of care beyond the hospital walls, including postpartum monitoring applications.
What challenges does the Intrapartum Monitoring Devices Industry face during its growth?
- Stringent regulatory requirements present a key challenge affecting the growth of the intrapartum monitoring devices industry.
- Significant market challenges revolve around system interoperability, data management, and the high cost of advanced technologies. Achieving seamless electronic health record (EHR) connectivity remains a primary hurdle, with integration projects often exceeding initial budgets by up to 30% due to complex legacy systems.
- Furthermore, the growing volume of data from continuous monitoring necessitates stringent data encryption standards and robust frameworks for fetal monitoring data interpretation to ensure security and clinical utility. The affordability of devices capable of advanced functions like ST segment analysis or fetal oxygen saturation monitoring limits their adoption, particularly in resource-constrained settings.
- These factors create a difficult balance for healthcare providers striving to adopt evidence-based obstetrics and a higher standardization of care while managing significant capital and operational expenditures.
Exclusive Technavio Analysis on Customer Landscape
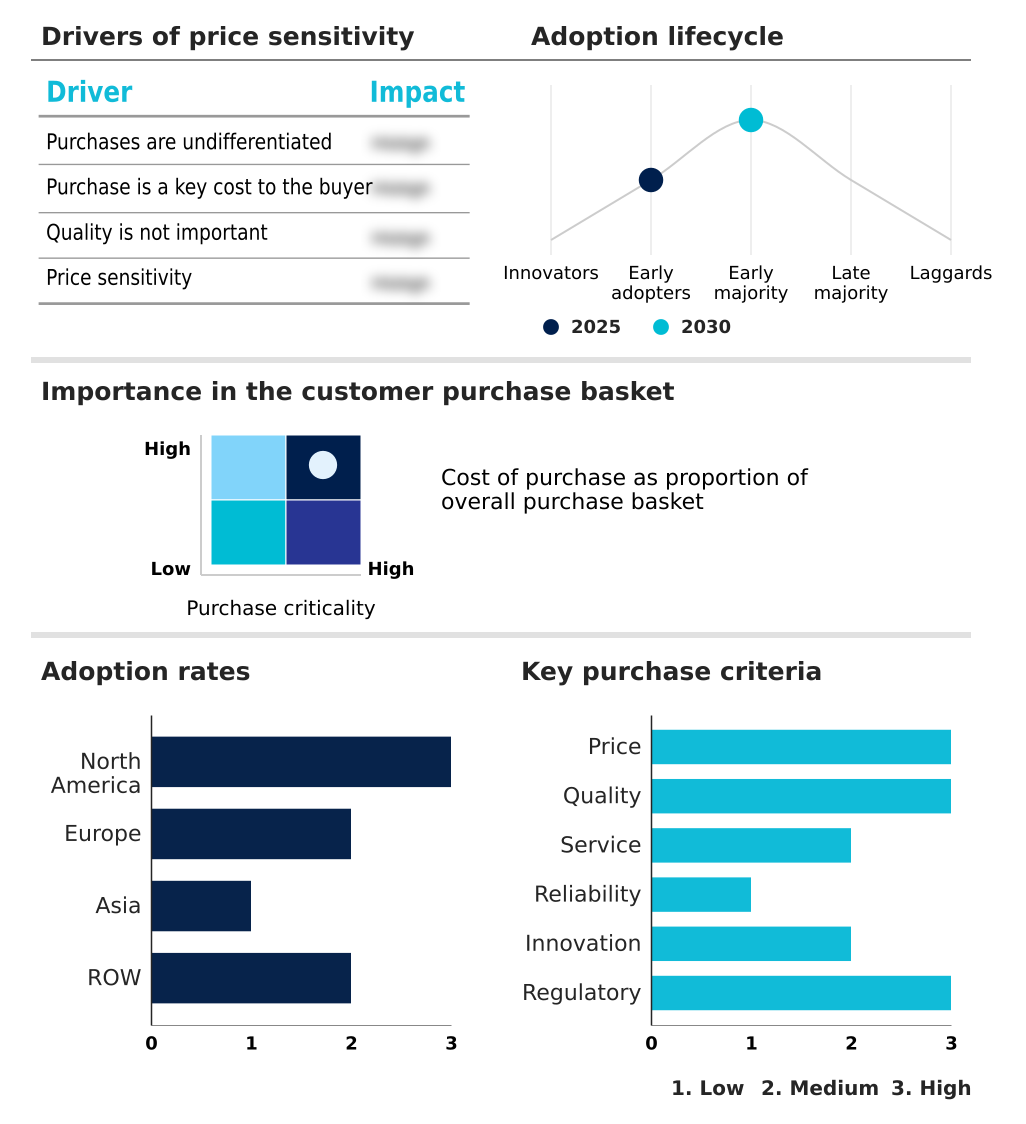
The intrapartum monitoring devices market forecasting report includes the adoption lifecycle of the market, covering from the innovator’s stage to the laggard’s stage. It focuses on adoption rates in different regions based on penetration. Furthermore, the intrapartum monitoring devices market report also includes key purchase criteria and drivers of price sensitivity to help companies evaluate and develop their market growth analysis strategies.
Customer Landscape of Intrapartum Monitoring Devices Industry
Competitive Landscape
Companies are implementing various strategies, such as strategic alliances, intrapartum monitoring devices market forecast, partnerships, mergers and acquisitions, geographical expansion, and product/service launches, to enhance their presence in the industry.
Analogic Corp. - Key offerings include advanced magnetic resonance imaging sensors engineered for precise monitoring of neonatal brain and heart rate activity during critical intrapartum phases.
The industry research and growth report includes detailed analyses of the competitive landscape of the market and information about key companies, including:
- Analogic Corp.
- Becton Dickinson and Co.
- Bionet Co. Ltd.
- Cardinal Health Inc.
- CooperSurgical Inc.
- EDAN Instruments Inc.
- General Electric Co.
- General Meditech Inc.
- Halma Plc
- Heal Force Biomeditech Holdings Ltd.
- Koninklijke Philips NV
- Mediana Co. Ltd.
- Medtronic Plc
- Mindchild Medical Inc.
- Nemo Healthcare BV
- Siemens AG
- Sino Hero (Shenzhen) Bio Medical Electronics Co. Ltd.
- Stryker Corp.
- TOITU CO. Ltd.
- Ultrasound Technologies Ltd.
Qualitative and quantitative analysis of companies has been conducted to help clients understand the wider business environment as well as the strengths and weaknesses of key industry players. Data is qualitatively analyzed to categorize companies as pure play, category-focused, industry-focused, and diversified; it is quantitatively analyzed to categorize companies as dominant, leading, strong, tentative, and weak.
Recent Development and News in Intrapartum monitoring devices market
- In May 2025, Medtronic Plc announced the launch of its next-generation non-invasive fetal monitoring system, featuring advanced signal processing algorithms that reduce artifacts from maternal movement by up to 40%, enhancing the clarity of fetal heart rate tracings.
- In March 2025, Koninklijke Philips NV entered into a strategic partnership with a leading AI healthcare platform to integrate predictive analytics into its Avalon fetal monitoring solutions, aiming to provide earlier detection of potential fetal distress and improve clinical outcomes.
- In December 2024, Mindchild Medical Inc. received FDA 510(k) clearance for its MERIDIAN M210 Fetal Monitoring System, a non-invasive device that expands its market access in the United States for continuous intrapartum monitoring without the need for fetal scalp electrodes.
- In September 2024, General Electric Co. completed the acquisition of a specialized perinatal software firm for approximately $150 million, enhancing its portfolio with advanced cardiotocography interpretation software and clinical decision support tools for labor and delivery units.
Dive into Technavio’s robust research methodology, blending expert interviews, extensive data synthesis, and validated models for unparalleled Intrapartum Monitoring Devices Market insights. See full methodology.
| Market Scope | |
|---|---|
| Page number | 292 |
| Base year | 2025 |
| Historic period | 2020-2024 |
| Forecast period | 2026-2030 |
| Growth momentum & CAGR | Accelerate at a CAGR of 8.4% |
| Market growth 2026-2030 | USD 1584.4 million |
| Market structure | Fragmented |
| YoY growth 2025-2026(%) | 6.8% |
| Key countries | US, Canada, Mexico, Germany, UK, France, Italy, Spain, The Netherlands, China, India, Japan, South Korea, Indonesia, Thailand, Brazil, Saudi Arabia, UAE, Turkey, Argentina, Colombia, South Africa and Israel |
| Competitive landscape | Leading Companies, Market Positioning of Companies, Competitive Strategies, and Industry Risks |
Research Analyst Overview
- The intrapartum monitoring devices market is evolving beyond simple data acquisition to become a critical component of predictive and integrated perinatal care. A major shift is the adoption of AI-based monitoring and advanced clinical decision support algorithms, which are pivotal in standardizing cardiotocography (CTG) analysis and reducing interpretative variability among clinicians.
- The integration of wireless telemetry systems and ambulatory fetal monitoring technologies directly addresses the clinical demand for greater patient mobility during labor, which is linked to better outcomes.
- For boardroom consideration, the investment in platforms with seamless electronic health record (EHR) connectivity and robust interoperability protocols is no longer optional; it is a strategic imperative for mitigating medicolegal risks and aligning with value-based care models. For example, facilities adopting comprehensive maternal-fetal monitoring integration have reported a 20% decrease in adverse event-related costs.
- This trend underscores a move toward systems that not only provide fetal heart rate (FHR) patterns but also support complex functions like ST segment analysis and uterine contraction measurement within a single, unified workflow.
What are the Key Data Covered in this Intrapartum Monitoring Devices Market Research and Growth Report?
-
What is the expected growth of the Intrapartum Monitoring Devices Market between 2026 and 2030?
-
USD 1.58 billion, at a CAGR of 8.4%
-
-
What segmentation does the market report cover?
-
The report is segmented by Product (Electrodes, and Monitors), End-user (Hospitals, Maternity clinics/obstetrics clinics, and Others), Technology (Wireless monitoring, Telehealth-enabled systems, and AI-based monitoring) and Geography (North America, Europe, Asia, Rest of World (ROW))
-
-
Which regions are analyzed in the report?
-
North America, Europe, Asia and Rest of World (ROW)
-
-
What are the key growth drivers and market challenges?
-
Rising incidence of preterm births, Stringent regulatory requirements
-
-
Who are the major players in the Intrapartum Monitoring Devices Market?
-
Analogic Corp., Becton Dickinson and Co., Bionet Co. Ltd., Cardinal Health Inc., CooperSurgical Inc., EDAN Instruments Inc., General Electric Co., General Meditech Inc., Halma Plc, Heal Force Biomeditech Holdings Ltd., Koninklijke Philips NV, Mediana Co. Ltd., Medtronic Plc, Mindchild Medical Inc., Nemo Healthcare BV, Siemens AG, Sino Hero (Shenzhen) Bio Medical Electronics Co. Ltd., Stryker Corp., TOITU CO. Ltd. and Ultrasound Technologies Ltd.
-
Market Research Insights
- The market is shaped by a dynamic interplay between clinical needs and technological innovation. The focus on maternal and neonatal safety is driving demand for advanced high-risk pregnancy monitoring solutions that facilitate early fetal distress detection.
- AI-powered obstetrical decision support tools are becoming integral, with some platforms demonstrating a 15% reduction in unnecessary clinical interventions by improving the accuracy of data interpretation. Furthermore, the push for clinical workflow optimization is accelerating the adoption of integrated systems. These platforms enhance electronic fetal monitoring (EFM) systems, leading to a 20% improvement in staff response times in certain facilities.
- This integration is critical for medicolegal risk reduction and improving overall care quality.
We can help! Our analysts can customize this intrapartum monitoring devices market research report to meet your requirements.
 RIA -
RIA - 
