Intrinsically Safe Equipment Market Analysis North America, Europe, APAC, South America, Middle East and Africa - US, China, Germany, UK, Japan - Size and Forecast 2024-2028

Intrinsically Safe Equipment Market Analysis North America, Europe, APAC, South America, Middle East and Africa - US, China, Germany, UK, Japan - Size and Forecast 2024-2028

Published: Jul 2024 141 Pages SKU: IRTNTR73396

Market Overview at a Glance

$1.23 B
Market Opportunity
7.08%
CAGR
6.49
YoY growth 2023-2024(%)

Intrinsically Safe Equipment Market Size 2024-2028 

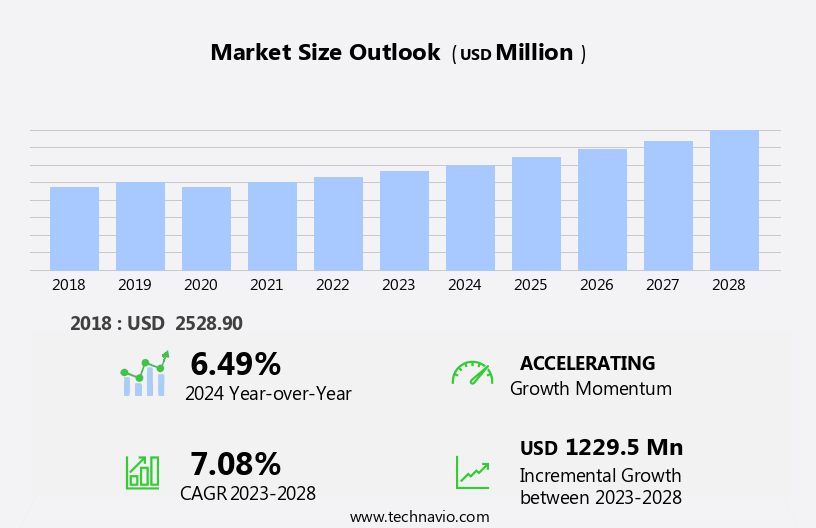
The intrinsically safe equipment market size is forecast to increase by USD 1.23 billion at a CAGR of 7.08% between 2023 and 2028. The market is experiencing significant growth due to the increasing importance of safety standards in various industries, particularly those involving the handling of flammable gases. The reliability of intrinsically safe equipment is a crucial factor, as it ensures the protection of workers and assets in hazardous environments. However, the increased cost of intrinsically safe equipment can be a challenge for some organizations, especially multinational companies operating in multiple regions with varying safety regulations. Safety standards, such as Occupational Health and Safety (OHS), set by organizations like the Electrotechnical Commission (IEC), play a vital role in driving the demand for intrinsically safe equipment. The market is influenced by global trends, including the growing focus on safety and the increasing number of multinational companies operating in hazardous environments. The market is expected to continue its growth trajectory, providing opportunities for companies that manufacture and supply intrinsically safe equipment.

What will be the Size of the Market During the Forecast Period?

Intrinsically Safe Equipment Market Size

 Request Free Sample

The market is a significant sector that caters to the demand for electrical equipment designed to operate safely in hazardous atmospheres. These atmospheres may contain flammable gases, fuels, or oxygen, which can pose a risk of ignition due to an external ignition source. This market plays a crucial role in the industrialization of various sectors, including process manufacturing and upstream oil and gas industries. The need for intrinsically safe equipment arises from the inherent risks associated with handling and processing fuels and chemicals in industries where explosive atmospheres are common. International energy investments in the oil and gas sector and the chemical industry continue to drive the demand for intrinsically safe equipment. Safety standards, such as OHS (Occupational Health and Safety), are stringently enforced in industries where hazardous atmospheres are present. These standards mandate the use of equipment that can operate safely in such environments without posing a risk of ignition. Intrinsically safe equipment is designed to meet these safety requirements by eliminating any potential ignition sources. The market is witnessing significant advancements with the integration of IoT (Internet of Things) and wireless technology.

Further, the real-time monitoring of explosive atmospheres and smart technologies are being employed to enhance safety and efficiency in industries. IOT-enabled devices and smart sensors are being used to monitor and analyze data in real-time, enabling preventive measures and reducing the risk of accidents. Safety organizations play a vital role in setting safety standards and certifying intrinsically safe equipment. These organizations ensure that equipment meets the necessary safety requirements and is suitable for use in hazardous areas. The use of intrinsically safe equipment is essential in industries where the risk of explosive atmospheres is high, such as oil and gas refineries, chemical plants, and other process manufacturing facilities. In conclusion, the market is a critical enabler for industries that operate in hazardous atmospheres. The integration of advanced technologies, such as IoT and wireless technology, is enhancing safety and efficiency in these industries. The demand for intrinsically safe equipment is expected to grow as international energy investments continue to drive the industrialization of various sectors.

Market Segmentation

The market research report provides comprehensive data (region-wise segment analysis), with forecasts and estimates in "USD million" for the period 2024-2028, as well as historical data from 2018-2022 for the following segments.

  • End-user
    • Oil and gas
    • Mining
    • Power
    • Chemical and petrochemical
    • Others
  • Geography
    • North America
      • US
    • Europe
      • Germany
      • UK
    • APAC
      • China
      • Japan
    • South America
    • Middle East and Africa

By End-user Insights

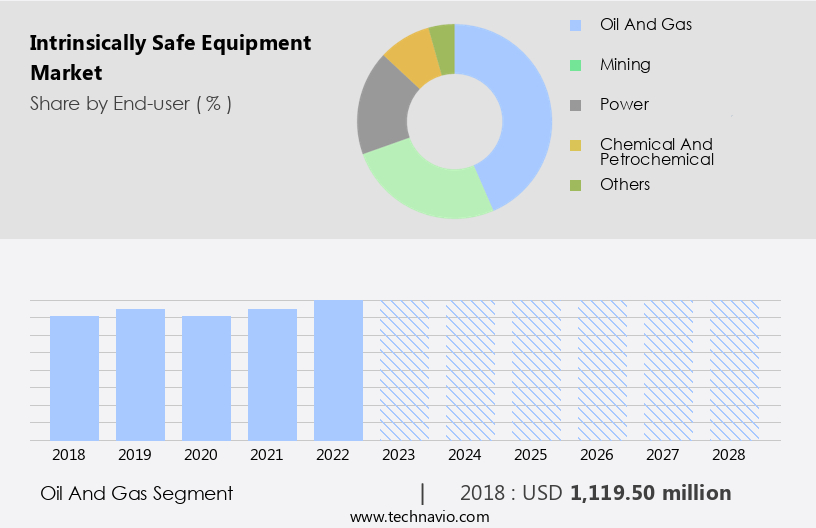
The oil and gas segment is estimated to witness significant growth during the forecast period. In the oil and gas sector, intrinsically safe equipment held a significant market share in 2023, a trend expected to persist through the forecast period. Strict adherence to safety standards, particularly in the Occupational Health and Safety (OHS) realm, is driving this growth. With increasing energy demand, both offshore and onshore oil fields are witnessing a wave in exploration activities. This expansion creates a substantial opportunity for the market.

Furthermore, the oil and gas industry's automation process is escalating, leading to a heightened requirement for intrinsically safe equipment to ensure safety and adhere to the Electrotechnical Commission's safety guidelines. The global economy's dependence on energy imports, primarily crude oil, further highlights the importance of intrinsically safe equipment in maintaining safety and efficiency in oil and gas operations.

Intrinsically Safe Equipment Market Size

Get a glance at the market share of various segments Request Free Sample

The oil and gas segment accounted for USD 1.12 billion in 2018 and showed a gradual increase during the forecast period.

Regional Insights

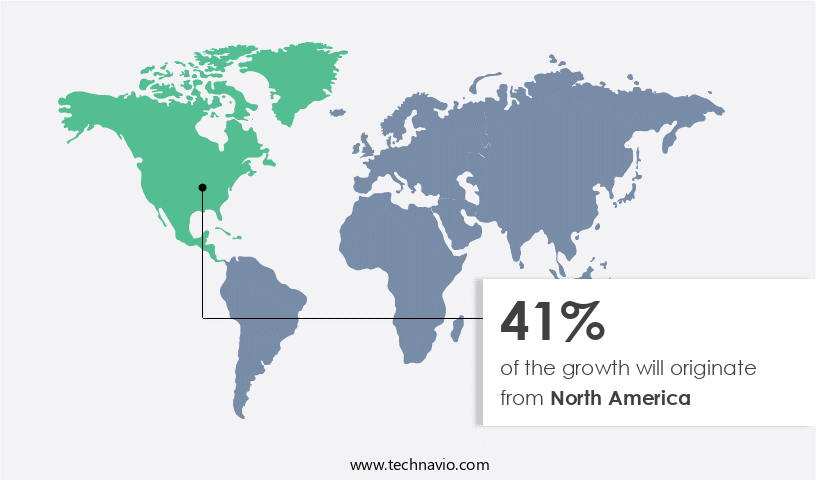
North America is estimated to contribute 41% to the growth of the global market during the forecast period. Technavio's analysts have elaborately explained the regional trends and drivers that shape the market during the forecast period.

Intrinsically Safe Equipment Market Share by Geography

For more insights on the market share of various regions Request Free Sample

Intrinsically safe equipment is essential for operation in hazardous areas where explosive atmospheres may exist. This market in North America is experiencing significant growth due to increasing safety regulations and the priority placed on worker safety and security. Equipment such as detectors, transmitters, switches, LED lights, and sensors are integral to this category. The market is poised for substantial expansion, as the emphasis on safety and cost savings becomes more pronounced. The oil and gas industry, particularly exploration and refining activities, is a major driver of intrinsically safe equipment adoption in North America. IoT-enabled devices, such as sensors and transmitters, enable real-time monitoring and data collection, enhancing operational efficiency and safety. Safety organizations continue to promote the use of intrinsically safe equipment in hazardous environments to minimize risks and ensure compliance with regulations. In summary, the market in North America is thriving due to increased safety regulations, the oil and gas industry's growth, and the integration of advanced technologies like IoT and wireless connectivity.

Our researchers analyzed the data with 2023 as the base year, along with the key drivers, trends, and challenges. A holistic analysis of drivers will help companies refine their marketing strategies to gain a competitive advantage.

Market Driver

Growing safety standards is the key driver of the market. In industries that handle flammable materials, it is essential to implement stringent safety measures to prevent potential explosions and their ensuing penalties and legal consequences. Adherence to regulations and protocols is crucial for maintaining a safe work environment and preserving a company's reputation. One effective tool for reducing risks and ensuring safety is Intrinsically Safe Equipment (ISE) certification. The oil and gas sector has seen a significant increase in the adoption of ISE due to heightened regulatory scrutiny, professional training, and technological advancements. While accidents may be unavoidable, their occurrence serves as a reminder of the importance of prioritizing safety.

Sophisticated safety features, such as connectivity and diagnostic capabilities, have become essential for operational efficiency and productivity. ISE with these features allows for real-time monitoring and quick response to potential hazards, reducing the risk of accidents and minimizing the depletion of resources. Awareness of workplace hazards and the importance of safety is a shared responsibility among all stakeholders. By investing in ISE, organizations demonstrate their commitment to workplace safety and can help mitigate the risks associated with the use of flammable materials.

Market Trends

Reliability of intrinsically safe equipment is the upcoming trend in the market. In the realm of industrialization, particularly in process manufacturing and upstream oil sectors, electrical equipment must operate in hazardous atmospheres where the presence of flammable gases, fuels, and oxygen can create a highly explosive environment. Intrinsically safe equipment is a critical solution to ensure safety in such conditions, as opposed to explosion-proof equipment that merely contains potential explosions. Intrinsically safe equipment operates by preventing explosions from occurring in the first place. The circuits are not housed in explosion-proof hardware, allowing for easy access and maintenance without the need for safety permits. Additionally, intrinsically safe equipment eliminates shock hazards, making it a more dependable choice for hazardous atmospheres.

These advantages contribute significantly to the growth of the market. By preventing explosions instead of containing them, intrinsically safe equipment offers a more effective and reliable solution for industries operating in hazardous conditions. This is especially important in the context of the international energy sector, where safety is paramount and efficiency is key.

Market Challenge

The increased cost of intrinsically safe equipment is a key challenge affecting the market growth. The market experiences significant demand due to economic growth and increasing energy consumption in various industries, particularly in sectors with hazardous environments such as oil and gas. Intrinsically safe equipment is essential for ensuring safety in these environments, as it is designed to prevent electrical sparks that could ignite explosive atmospheres. The product breakdown of the market includes sensors, detectors, switches, transmitters, isolators, and LED indicators. The high cost of intrinsically safe equipment is a significant challenge for market growth. The expense is primarily attributed to the extensive certification process, which requires comprehensive documentation of all components. Once certified with the Intrinsic Safety (IS) classification, the equipment is guaranteed to operate safely in explosive atmospheres due to its low electrical and thermal energy levels.

Intrinsically safe equipment plays a crucial role in maintaining safety in industries with hazardous conditions. By investing in this equipment, industries can mitigate potential risks and ensure the safety of their workforce and assets. The ongoing demand for energy and economic growth in various sectors is expected to fuel the growth of the market.

Exclusive Customer Landscape

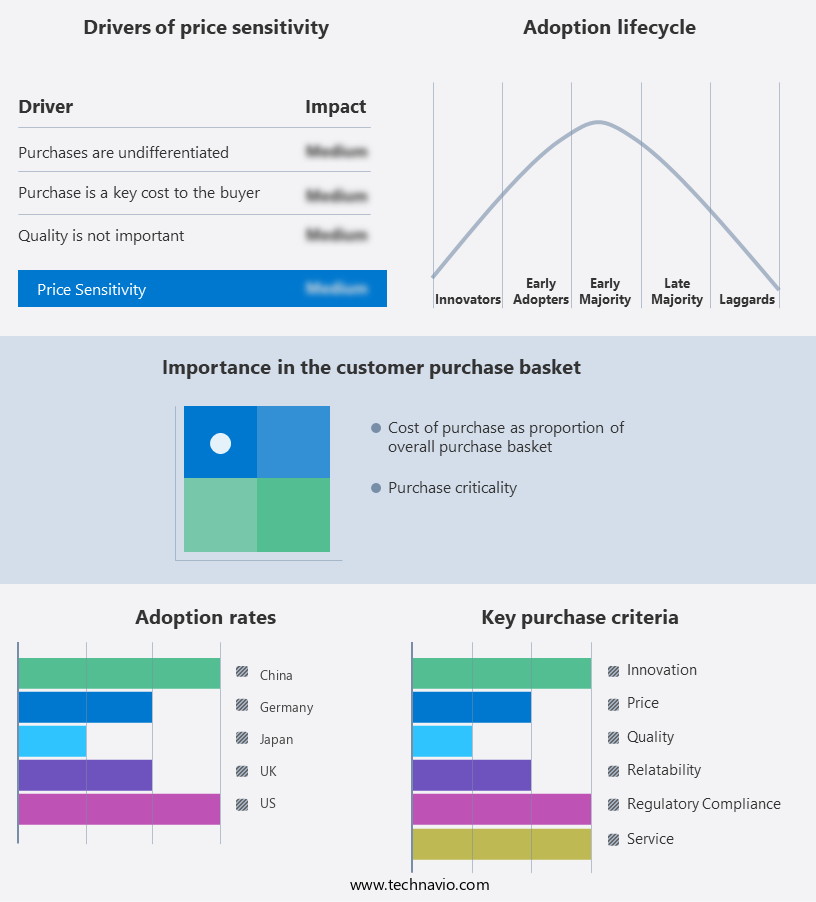
The market forecasting report includes the adoption lifecycle of the market, covering from the innovator's stage to the laggard's stage. It focuses on adoption rates in different regions based on penetration. Furthermore, the report also includes key purchase criteria and drivers of price sensitivity to help companies evaluate and develop their market growth analysis strategies.

Intrinsically Safe Equipment Market Share by Geography

 Customer Landscape

Key Companies & Market Insights

Companies are implementing various strategies, such as strategic alliances, partnerships, mergers and acquisitions, geographical expansion, and product/service launches, to enhance their presence in the market.

Banner Engineering Corp. -The company offers sensor-related products such as machine safety, lighting and indication, industrial wireless, barcode readers, machine vision, optical rotary encoders, and accessories. 

The market research and growth report includes detailed analyses of the competitive landscape of the market and information about key companies, including:

  • ABB Ltd.
  • Bayco Products Inc.
  • BEKA associates Ltd.
  • CorDEX Instruments Ltd.
  • Datalink Electronics Ltd.
  • Eaton Corp. Plc
  • Fluke Corp.
  • G.M.International srl
  • Kyland Technology Co.Ltd.
  • PCB Piezotronics Inc.
  • Pepperl and Fuchs SE
  • R Stahl AG
  • Regulateurs GEORGIN
  • Rockwell Automation Inc.
  • Schneider Electric SE
  • Shanghai Chenzhu Instrument Co.Ltd.
  • Siemens AG
  • Spectris Plc
  • SRS Engineering Corp.

Qualitative and quantitative analysis of companies has been conducted to help clients understand the wider business environment as well as the strengths and weaknesses of key market players. Data is qualitatively analyzed to categorize companies as pure play, category-focused, industry-focused, and diversified; it is quantitatively analyzed to categorize companies as dominant, leading, strong, tentative, and weak.

Research Analyst Overview

The market for intrinsically safe electrical equipment is witnessing significant growth due to the increasing industrialization and process manufacturing industries in various sectors such as upstream oil and gas, mining, and chemicals. In highly explosive atmospheres, where the presence of flammable gases, fuel, oxygen, and ignition sources can lead to catastrophic explosions, intrinsically safe equipment is essential for workplace safety. International energy investments and the global economy's reliance on energy imports, particularly crude oil, have driven the demand for intrinsically safe equipment in offshore and onshore oil fields. The intrinsic safety of this equipment ensures compliance with safety standards such as OHS and those set by the Electrotechnical Commission. Oil and gas exploration in highly explosive atmospheres presents significant risks, requiring careful management of hazardous atmospheric conditions and strategic gas investments.

Multinational companies in the oil and gas, chemical, pharmaceutical, and mining industries are investing in intrinsically safe sensors, detectors, switches, transmitters, isolators, and LED indicators to ensure safety regulations are met. The integration of IoT and wireless technology enables real-time monitoring and smart technologies in explosive atmospheres, increasing operational efficiency, productivity, and awareness of workplace safety. Safety organizations play a crucial role in enforcing safety regulations, imposing penalties, and ensuring legal consequences for non-compliance. The depletion of resources and the need for sophisticated safety measures have made intrinsically safe equipment a necessity for economic growth and energy demand.

Market Scope

Report Coverage

Details

Page number

141

Base year

2023

Historic period

2018-2022

Forecast period

2024-2028

Growth momentum & CAGR

Accelerate at a CAGR of 7.08%

Market growth 2024-2028

USD 1.23 billion

Market structure

Fragmented

YoY growth 2023-2024(%)

6.49

Regional analysis

North America, Europe, APAC, South America, and Middle East and Africa

Performing market contribution

North America at 41%

Key countries

US, China, Germany, UK, and Japan

Competitive landscape

Leading Companies, Market Positioning of Companies, Competitive Strategies, and Industry Risks

Key companies profiled

ABB Ltd., Banner Engineering Corp., Bayco Products Inc., BEKA associates Ltd., CorDEX Instruments Ltd., Datalink Electronics Ltd., Eaton Corp. Plc, Fluke Corp., G.M.International srl, Kyland Technology Co.Ltd., PCB Piezotronics Inc., Pepperl and Fuchs SE, R Stahl AG, Regulateurs GEORGIN, Rockwell Automation Inc., Schneider Electric SE, Shanghai Chenzhu Instrument Co.Ltd., Siemens AG, Spectris Plc, and SRS Engineering Corp.

Market dynamics

Parent market analysis, market growth inducers and obstacles, market forecast, fast-growing and slow-growing segment analysis, COVID-19 impact and recovery analysis and future consumer dynamics, market condition analysis for the forecast period

Customization purview

If our market report has not included the data that you are looking for, you can reach out to our analysts and get segments customized.

Request Free Sample

What are the Key Data Covered in this Market Research and Growth Report?

  • CAGR of the market during the forecast period
  • Detailed information on factors that will drive the market growth and forecasting between 2024 and 2028
  • Precise estimation of the size of the market  and its contribution of the market in focus to the parent market
  • Accurate predictions about upcoming market growth and trends and changes in consumer behaviour
  • Growth of the market across North America, Europe, APAC, South America, and Middle East and Africa
  • Thorough analysis of the market's competitive landscape and detailed information about companies
  • Comprehensive analysis of factors that will challenge the growth of market companies

We can help! Our analysts can customize this market research report to meet your requirements. Get in touch

1 Executive Summary

  • 1.1 Market overview
    • Executive Summary - Chart on Market Overview
    • Executive Summary - Data Table on Market Overview
    • Executive Summary - Chart on Global Market Characteristics
    • Executive Summary - Chart on Market by Geography
    • Executive Summary - Chart on Market Segmentation by End-user
    • Executive Summary - Chart on Incremental Growth
    • Executive Summary - Data Table on Incremental Growth
    • Executive Summary - Chart on Company Market Positioning

2 Market Landscape

  • 2.1 Market ecosystem
    • Parent Market
    • Data Table on - Parent Market
  • 2.2 Market characteristics
    • Market characteristics analysis
  • 2.3 Value chain analysis
    • Value Chain Analysis

3 Market Sizing

  • 3.1 Market definition
    • Offerings of companies included in the market definition
  • 3.2 Market segment analysis
    • Market segments
  • 3.3 Market size 2023
    • 3.4 Market outlook: Forecast for 2023-2028
      • Chart on Global - Market size and forecast 2023-2028 ($ million)
      • Data Table on Global - Market size and forecast 2023-2028 ($ million)
      • Chart on Global Market: Year-over-year growth 2023-2028 (%)
      • Data Table on Global Market: Year-over-year growth 2023-2028 (%)

    4 Historic Market Size

    • 4.1 Global Intrinsically Safe Equipment Market 2018 - 2022
      • Historic Market Size - Data Table on Global Intrinsically Safe Equipment Market 2018 - 2022 ($ million)
    • 4.2 End-user segment analysis 2018 - 2022
      • Historic Market Size - End-user Segment 2018 - 2022 ($ million)
    • 4.3 Geography segment analysis 2018 - 2022
      • Historic Market Size - Geography Segment 2018 - 2022 ($ million)
    • 4.4 Country segment analysis 2018 - 2022
      • Historic Market Size - Country Segment 2018 - 2022 ($ million)

    5 Five Forces Analysis

    • 5.1 Five forces summary
      • Five forces analysis - Comparison between 2023 and 2028
    • 5.2 Bargaining power of buyers
      • Bargaining power of buyers - Impact of key factors 2023 and 2028
    • 5.3 Bargaining power of suppliers
      • Bargaining power of suppliers - Impact of key factors in 2023 and 2028
    • 5.4 Threat of new entrants
      • Threat of new entrants - Impact of key factors in 2023 and 2028
    • 5.5 Threat of substitutes
      • Threat of substitutes - Impact of key factors in 2023 and 2028
    • 5.6 Threat of rivalry
      • Threat of rivalry - Impact of key factors in 2023 and 2028
    • 5.7 Market condition
      • Chart on Market condition - Five forces 2023 and 2028

    6 Market Segmentation by End-user

    • 6.1 Market segments
      • Chart on End-user - Market share 2023-2028 (%)
      • Data Table on End-user - Market share 2023-2028 (%)
    • 6.2 Comparison by End-user
      • Chart on Comparison by End-user
      • Data Table on Comparison by End-user
    • 6.3 Oil and gas - Market size and forecast 2023-2028
      • Chart on Oil and gas - Market size and forecast 2023-2028 ($ million)
      • Data Table on Oil and gas - Market size and forecast 2023-2028 ($ million)
      • Chart on Oil and gas - Year-over-year growth 2023-2028 (%)
      • Data Table on Oil and gas - Year-over-year growth 2023-2028 (%)
    • 6.4 Mining - Market size and forecast 2023-2028
      • Chart on Mining - Market size and forecast 2023-2028 ($ million)
      • Data Table on Mining - Market size and forecast 2023-2028 ($ million)
      • Chart on Mining - Year-over-year growth 2023-2028 (%)
      • Data Table on Mining - Year-over-year growth 2023-2028 (%)
    • 6.5 Power - Market size and forecast 2023-2028
      • Chart on Power - Market size and forecast 2023-2028 ($ million)
      • Data Table on Power - Market size and forecast 2023-2028 ($ million)
      • Chart on Power - Year-over-year growth 2023-2028 (%)
      • Data Table on Power - Year-over-year growth 2023-2028 (%)
    • 6.6 Chemical and petrochemical - Market size and forecast 2023-2028
      • Chart on Chemical and petrochemical - Market size and forecast 2023-2028 ($ million)
      • Data Table on Chemical and petrochemical - Market size and forecast 2023-2028 ($ million)
      • Chart on Chemical and petrochemical - Year-over-year growth 2023-2028 (%)
      • Data Table on Chemical and petrochemical - Year-over-year growth 2023-2028 (%)
    • 6.7 Others - Market size and forecast 2023-2028
      • Chart on Others - Market size and forecast 2023-2028 ($ million)
      • Data Table on Others - Market size and forecast 2023-2028 ($ million)
      • Chart on Others - Year-over-year growth 2023-2028 (%)
      • Data Table on Others - Year-over-year growth 2023-2028 (%)
    • 6.8 Market opportunity by End-user
      • Market opportunity by End-user ($ million)
      • Data Table on Market opportunity by End-user ($ million)

    7 Customer Landscape

    • 7.1 Customer landscape overview
      • Analysis of price sensitivity, lifecycle, customer purchase basket, adoption rates, and purchase criteria

    8 Geographic Landscape

    • 8.1 Geographic segmentation
      • Chart on Market share by geography 2023-2028 (%)
      • Data Table on Market share by geography 2023-2028 (%)
    • 8.2 Geographic comparison
      • Chart on Geographic comparison
      • Data Table on Geographic comparison
    • 8.3 North America - Market size and forecast 2023-2028
      • Chart on North America - Market size and forecast 2023-2028 ($ million)
      • Data Table on North America - Market size and forecast 2023-2028 ($ million)
      • Chart on North America - Year-over-year growth 2023-2028 (%)
      • Data Table on North America - Year-over-year growth 2023-2028 (%)
    • 8.4 Europe - Market size and forecast 2023-2028
      • Chart on Europe - Market size and forecast 2023-2028 ($ million)
      • Data Table on Europe - Market size and forecast 2023-2028 ($ million)
      • Chart on Europe - Year-over-year growth 2023-2028 (%)
      • Data Table on Europe - Year-over-year growth 2023-2028 (%)
    • 8.5 APAC - Market size and forecast 2023-2028
      • Chart on APAC - Market size and forecast 2023-2028 ($ million)
      • Data Table on APAC - Market size and forecast 2023-2028 ($ million)
      • Chart on APAC - Year-over-year growth 2023-2028 (%)
      • Data Table on APAC - Year-over-year growth 2023-2028 (%)
    • 8.6 South America - Market size and forecast 2023-2028
      • Chart on South America - Market size and forecast 2023-2028 ($ million)
      • Data Table on South America - Market size and forecast 2023-2028 ($ million)
      • Chart on South America - Year-over-year growth 2023-2028 (%)
      • Data Table on South America - Year-over-year growth 2023-2028 (%)
    • 8.7 Middle East and Africa - Market size and forecast 2023-2028
      • Chart on Middle East and Africa - Market size and forecast 2023-2028 ($ million)
      • Data Table on Middle East and Africa - Market size and forecast 2023-2028 ($ million)
      • Chart on Middle East and Africa - Year-over-year growth 2023-2028 (%)
      • Data Table on Middle East and Africa - Year-over-year growth 2023-2028 (%)
    • 8.8 US - Market size and forecast 2023-2028
      • Chart on US - Market size and forecast 2023-2028 ($ million)
      • Data Table on US - Market size and forecast 2023-2028 ($ million)
      • Chart on US - Year-over-year growth 2023-2028 (%)
      • Data Table on US - Year-over-year growth 2023-2028 (%)
    • 8.9 China - Market size and forecast 2023-2028
      • Chart on China - Market size and forecast 2023-2028 ($ million)
      • Data Table on China - Market size and forecast 2023-2028 ($ million)
      • Chart on China - Year-over-year growth 2023-2028 (%)
      • Data Table on China - Year-over-year growth 2023-2028 (%)
    • 8.10 Germany - Market size and forecast 2023-2028
      • Chart on Germany - Market size and forecast 2023-2028 ($ million)
      • Data Table on Germany - Market size and forecast 2023-2028 ($ million)
      • Chart on Germany - Year-over-year growth 2023-2028 (%)
      • Data Table on Germany - Year-over-year growth 2023-2028 (%)
    • 8.11 UK - Market size and forecast 2023-2028
      • Chart on UK - Market size and forecast 2023-2028 ($ million)
      • Data Table on UK - Market size and forecast 2023-2028 ($ million)
      • Chart on UK - Year-over-year growth 2023-2028 (%)
      • Data Table on UK - Year-over-year growth 2023-2028 (%)
    • 8.12 Japan - Market size and forecast 2023-2028
      • Chart on Japan - Market size and forecast 2023-2028 ($ million)
      • Data Table on Japan - Market size and forecast 2023-2028 ($ million)
      • Chart on Japan - Year-over-year growth 2023-2028 (%)
      • Data Table on Japan - Year-over-year growth 2023-2028 (%)
    • 8.13 Market opportunity by geography
      • Market opportunity by geography ($ million)
      • Data Tables on Market opportunity by geography ($ million)

    9 Drivers, Challenges, and Opportunity/Restraints

    • 9.1 Market drivers
      • 9.2 Market challenges
        • 9.3 Impact of drivers and challenges
          • Impact of drivers and challenges in 2023 and 2028
        • 9.4 Market opportunities/restraints

          10 Competitive Landscape

          • 10.1 Overview
            • 10.2 Competitive Landscape
              • Overview on criticality of inputs and factors of differentiation
            • 10.3 Landscape disruption
              • Overview on factors of disruption
            • 10.4 Industry risks
              • Impact of key risks on business

            11 Competitive Analysis

            • 11.1 Companies profiled
              • Companies covered
            • 11.2 Market positioning of companies
              • Matrix on companies position and classification
            • 11.3 Banner Engineering Corp.
              • Banner Engineering Corp. - Overview
              • Banner Engineering Corp. - Product / Service
              • Banner Engineering Corp. - Key offerings
            • 11.4 Bayco Products Inc.
              • Bayco Products Inc. - Overview
              • Bayco Products Inc. - Product / Service
              • Bayco Products Inc. - Key offerings
            • 11.5 CorDEX Instruments Ltd.
              • CorDEX Instruments Ltd. - Overview
              • CorDEX Instruments Ltd. - Product / Service
              • CorDEX Instruments Ltd. - Key offerings
            • 11.6 Eaton Corp. Plc
              • Eaton Corp. Plc - Overview
              • Eaton Corp. Plc - Business segments
              • Eaton Corp. Plc - Key news
              • Eaton Corp. Plc - Key offerings
              • Eaton Corp. Plc - Segment focus
            • 11.7 Fluke Corp.
              • Fluke Corp. - Overview
              • Fluke Corp. - Product / Service
              • Fluke Corp. - Key offerings
            • 11.8 Kyland Technology Co. Ltd.
              • Kyland Technology Co. Ltd. - Overview
              • Kyland Technology Co. Ltd. - Product / Service
              • Kyland Technology Co. Ltd. - Key offerings
            • 11.9 Pepperl and Fuchs SE
              • Pepperl and Fuchs SE - Overview
              • Pepperl and Fuchs SE - Product / Service
              • Pepperl and Fuchs SE - Key news
              • Pepperl and Fuchs SE - Key offerings
            • 11.10 R. Stahl AG
              • R. Stahl AG - Overview
              • R. Stahl AG - Product / Service
              • R. Stahl AG - Key offerings
            • 11.11 Regulateurs GEORGIN
              • Regulateurs GEORGIN - Overview
              • Regulateurs GEORGIN - Product / Service
              • Regulateurs GEORGIN - Key offerings
            • 11.12 Spectris Plc
              • Spectris Plc - Overview
              • Spectris Plc - Business segments
              • Spectris Plc - Key news
              • Spectris Plc - Key offerings
              • Spectris Plc - Segment focus

            12 Appendix

            • 12.1 Scope of the report
              • 12.2 Inclusions and exclusions checklist
                • Inclusions checklist
                • Exclusions checklist
              • 12.3 Currency conversion rates for US$
                • Currency conversion rates for US$
              • 12.4 Research methodology
                • Research methodology
              • 12.5 Data procurement
                • Information sources
              • 12.6 Data validation
                • Data validation
              • 12.7 Validation techniques employed for market sizing
                • Validation techniques employed for market sizing
              • 12.8 Data synthesis
                • Data synthesis
              • 12.* 360 degree market analysis
                • 360 degree market analysis
              • 12.10 List of abbreviations
                • List of abbreviations

              Research Methodology

              Technavio presents a detailed picture of the market by way of study, synthesis, and summation of data from multiple sources. The analysts have presented the various facets of the market with a particular focus on identifying the key industry influencers. The data thus presented is comprehensive, reliable, and the result of extensive research, both primary and secondary.

              INFORMATION SOURCES

              Primary sources

              • Manufacturers and suppliers
              • Channel partners
              • Industry experts
              • Strategic decision makers

              Secondary sources

              • Industry journals and periodicals
              • Government data
              • Financial reports of key industry players
              • Historical data
              • Press releases

              DATA ANALYSIS

              Data Synthesis

              • Collation of data
              • Estimation of key figures
              • Analysis of derived insights

              Data Validation

              • Triangulation with data models
              • Reference against proprietary databases
              • Corroboration with industry experts

              REPORT WRITING

              Qualitative

              • Market drivers
              • Market challenges
              • Market trends
              • Five forces analysis

              Quantitative

              • Market size and forecast
              • Market segmentation
              • Geographical insights
              • Competitive landscape

              Interested in this report?

              Get your sample now to see our research methodology and insights!

              Download Now

              Frequently Asked Questions

              Intrinsically Safe Equipment market growth will increase by $ 1229.5 mn during 2024-2028 .

              The Intrinsically Safe Equipment market is expected to grow at a CAGR of 7.08% during 2024-2028 .

              Intrinsically Safe Equipment market is segmented by End-user( Oil and gas, Mining, Power, Chemical and petrochemical, Others)

              ABB Ltd., Banner Engineering Corp., Bayco Products Inc., BEKA associates Ltd., CorDEX Instruments Ltd., Datalink Electronics Ltd., Eaton Corp. Plc, Fluke Corp., G.M.International srl, Kyland Technology Co.Ltd., PCB Piezotronics Inc., Pepperl and Fuchs SE, R Stahl AG, Regulateurs GEORGIN, Rockwell Automation Inc., Schneider Electric SE, Shanghai Chenzhu Instrument Co.Ltd., Siemens AG, Spectris Plc, SRS Engineering Corp. are a few of the key vendors in the Intrinsically Safe Equipment market.

              North America will register the highest growth rate of 41% among the other regions. Therefore, the Intrinsically Safe Equipment market in North America is expected to garner significant business opportunities for the vendors during the forecast period.

              US, China, Germany, UK, Japan

              • Growing safety standardsIndustries that employ flammable materials must take appropriate procedures to mitigate the risks associated with their use. When it comes to hazard control is the driving factor this market.
              • various organizations advise that particular regulations and protocols should be followed to ensure that industries are safe. IS certification is a critical tool for reducing risks and ensuring the safety of industrial equipment is the driving factor this market.
              • resources is the driving factor this market.
              • and people.The growth of the safety protocol in the oil and gas industry has been driven by revitalized regulatory authorities is the driving factor this market.
              • professional industry training is the driving factor this market.
              • and technological advancements. In any industrial situation is the driving factor this market.
              • accidents are inevitable is the driving factor this market.
              • yet they are almost always preventable. When they occur is the driving factor this market.
              • they serve as a reminder that any organization top focus should always be safety. Accident prevention is achieved by employee compliance and thorough safety training is the driving factor this market.
              • but it all starts with management choice to prioritize employee safety as a top priority. During the forecast period is the driving factor this market.
              • such factors are expected to fuel the need for intrinsically safe equipment. is the driving factor this market.

              The Intrinsically Safe Equipment market vendors should focus on grabbing business opportunities from the Oil and gas segment as it accounted for the largest market share in the base year.