Inventory Robots Market Analysis, Size, and Forecast 2025-2029: APAC (China, Japan, and South Korea), Europe (Germany, France, and Italy), North America (US, Canada, and Mexico), South America (Brazil and Argentina), Middle East and Africa (Saudi Arabia, UAE, and South Africa), and Rest of World (ROW)

Inventory Robots Market Analysis, Size, and Forecast 2025-2029:
APAC (China, Japan, and South Korea), Europe (Germany, France, and Italy), North America (US, Canada, and Mexico), South America (Brazil and Argentina), Middle East and Africa (Saudi Arabia, UAE, and South Africa), and Rest of World (ROW)

Published: Dec 2025 290 Pages SKU: IRTNTR73253

Market Overview at a Glance

$3.71 B
Market Opportunity
13.1%
CAGR 2024 - 2029
43%
APAC Growth
$2.25 B
Hardware segment 2023

Inventory Robots Market Size 2025-2029

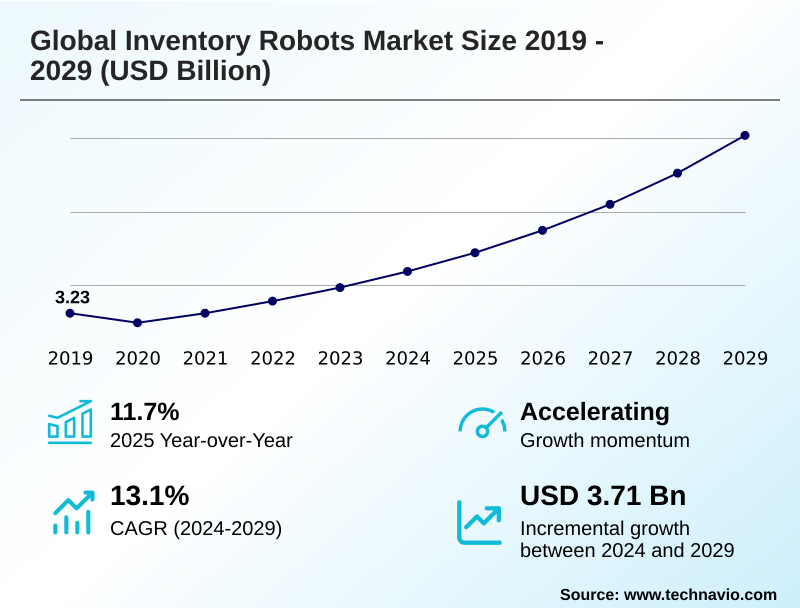
The inventory robots market size is valued to increase by USD 3.71 billion, at a CAGR of 13.1% from 2024 to 2029. Escalating labor shortages and rising labor costs will drive the inventory robots market.

Major Market Trends & Insights

  • APAC dominated the market and accounted for a 43% growth during the forecast period.
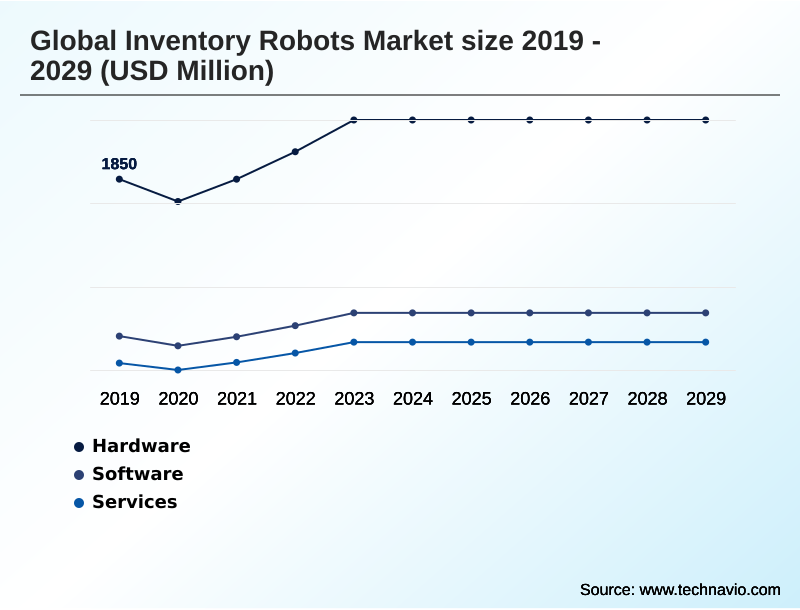
  • By Product - Hardware segment was valued at USD 2.25 billion in 2023
  • By Application - Warehousing segment accounted for the largest market revenue share in 2023

Market Size & Forecast

  • Market Opportunities: USD 4.85 billion
  • Market Future Opportunities: USD 3.71 billion
  • CAGR from 2024 to 2029 : 13.1%

Market Summary

  • The inventory robots market is undergoing a profound transformation, driven by the convergence of economic pressures and technological maturation. Persistent labor shortages and the escalating complexity of e-commerce fulfillment are compelling businesses to adopt automation for operational continuity and efficiency.
  • A key trend is the integration of advanced artificial intelligence, evolving robots from simple automated guided vehicles to intelligent autonomous mobile robots capable of dynamic navigation and decision-making. For instance, an e-commerce fulfillment center can deploy a fleet of robots for goods-to-person picking, which not only increases throughput but also enhances order fulfillment accuracy by minimizing human error.
  • These systems leverage computer vision and machine learning algorithms for precise item handling. However, significant challenges remain, including the high upfront capital investment and the technical complexities of integrating robotic fleets with legacy warehouse management systems.
  • The growing availability of robotics-as-a-service (RaaS) models is helping to mitigate financial barriers, making advanced automation more accessible and allowing companies to scale their operations flexibly in response to market demands. The market is thus characterized by a strategic shift towards intelligent, data-driven automation as a cornerstone of resilient and competitive supply chain operations.

What will be the Size of the Inventory Robots Market during the forecast period?

Get Key Insights on Market Forecast (PDF) Request Free Sample

How is the Inventory Robots Market Segmented?

The inventory robots industry research report provides comprehensive data (region-wise segment analysis), with forecasts and estimates in "USD million" for the period 2025-2029, as well as historical data from 2019-2023 for the following segments.

  • Product
    • Hardware
    • Software
    • Services
  • Application
    • Warehousing
    • Retail
    • Manufacturing
  • Type
    • Autonomous mobile robots
    • Automated guided vehicles
    • Fixed robotics
  • Geography
    • APAC
      • China
      • Japan
      • South Korea
    • Europe
      • Germany
      • France
      • Italy
    • North America
      • US
      • Canada
      • Mexico
    • South America
      • Brazil
      • Argentina
    • Middle East and Africa
      • Saudi Arabia
      • UAE
      • South Africa
    • Rest of World (ROW)

By Product Insights

The hardware segment is estimated to witness significant growth during the forecast period.

The hardware segment, encompassing physical systems like autonomous mobile robots and automated guided vehicles, is foundational to improving warehouse operational efficiency.

Innovations in LiDAR sensor technology and 3D vision systems are enhancing navigational precision, while advancements in end-of-arm tooling expand task capabilities, directly addressing e-commerce fulfillment complexity.

These physical assets are critical for high-density storage retrieval and require careful robotic systems integration, especially in brownfield integration scenarios. Deployments are demonstrating significant operational throughput enhancement, with some achieving a 2-3x boost in productivity.

Strategic investment in this segment is driven by the need for greater supply chain resilience and is carefully weighed against the total cost of ownership.

Request Free Sample

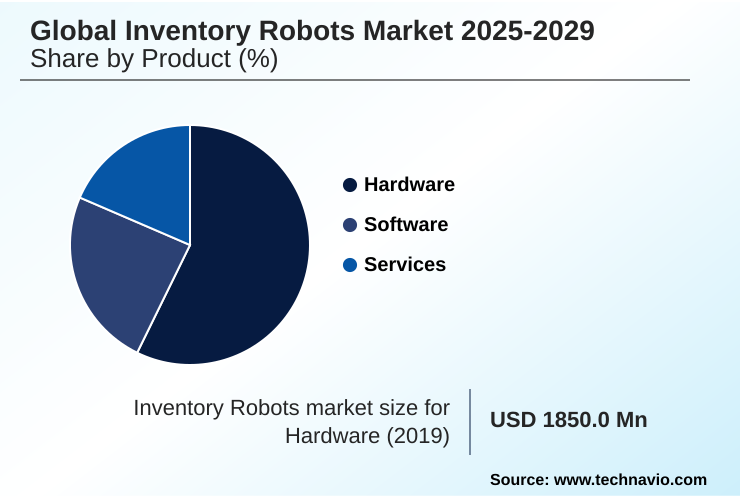
The Hardware segment was valued at USD 2.25 billion in 2023 and showed a gradual increase during the forecast period.

Request Free Sample

Regional Analysis

APAC is estimated to contribute 43% to the growth of the global market during the forecast period.Technavio’s analysts have elaborately explained the regional trends and drivers that shape the market during the forecast period.

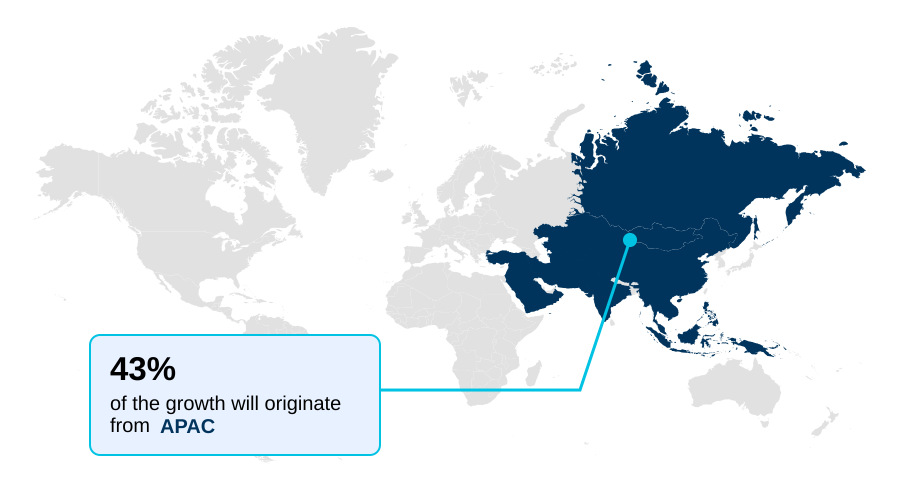
See How Inventory Robots Market Demand is Rising in APAC Request Free Sample

The geographic landscape is led by APAC, which accounts for 43% of the incremental growth, driven by massive e-commerce and manufacturing sectors demanding supply chain optimization.

North America follows, with a strong focus on data-driven logistics and omnichannel inventory management to serve its mature retail market.

In these advanced regions, technologies such as RFID-enabled autonomous systems and autonomous drone system are deployed for perpetual inventory scanning and inventory shrinkage control.

Innovations in simultaneous localization and mapping support complex navigation, while a focus on human-robot collaboration addresses labor dynamics. Europe emphasizes just-in-time production integration, using robotics for tasks like robotic piece-picking and ensuring planogram compliance monitoring.

Niche applications like cold storage logistics are also gaining traction globally.

Market Dynamics

Our researchers analyzed the data with 2024 as the base year, along with the key drivers, trends, and challenges. A holistic analysis of drivers will help companies refine their marketing strategies to gain a competitive advantage.

  • The evolution of logistics is heavily influenced by the adoption of autonomous mobile robots for e-commerce fulfillment, which directly addresses the need for speed and accuracy. The success of these systems hinges on core technologies like SLAM technology for dynamic warehouse navigation, allowing robots to operate effectively in constantly changing environments.
  • Further intelligence is added through AI-powered computer vision for item recognition, which is critical for handling diverse product catalogs. A major focus for operators is integrating AMRs with existing WMS platforms to create a unified data ecosystem for real-time decision-making. The business case is often proven by the strong ROI of goods-to-person robotic systems.
  • However, enterprises must also navigate the challenges of robotic bin picking implementation for handling smaller, unstructured items. For large-scale inventory audits, many are now using drones for automated cycle counting, which can achieve accuracy levels over 99%, a significant improvement over manual methods that often hover below 95%.
  • The financial accessibility is improving, with robotics-as-a-service pricing models explained as a viable OpEx alternative. In retail, improving planogram compliance with shelf-scanning robots is a key use case. All these connected systems demand robust cybersecurity protocols for autonomous robot fleets. As deployments grow, so does the importance of human-robot collaboration safety standards and optimizing fleet management for swarm robotics.
  • Specialized applications, such as robotic automation in cold chain logistics, are also expanding, driven by tailored brownfield automation integration strategies. Looking ahead, using digital twins to simulate robot workflows will be standard practice for reducing order fulfillment errors with robotics.
  • The debate over AMR vs AGV for manufacturing logistics continues, while innovation in robotic piece-picking for heterogeneous items and real-time inventory tracking with RFID robots advances. Finally, the full potential will be unlocked by the impact of 5G on warehouse robot connectivity.

What are the key market drivers leading to the rise in the adoption of Inventory Robots Industry?

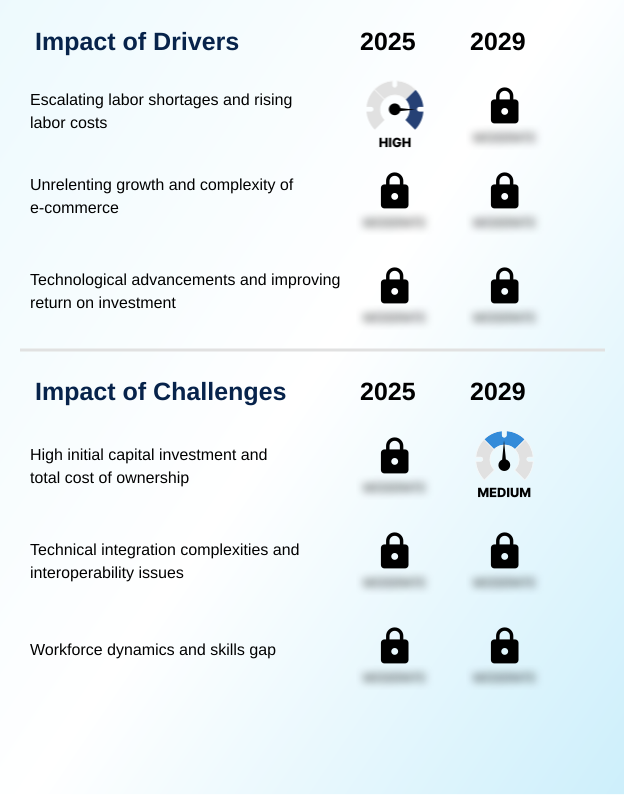
  • Escalating labor shortages and rising labor costs are a primary driver propelling the adoption of inventory robots across global supply chains.

  • Persistent labor shortages and the increasing complexity of omnichannel retail fulfillment are primary market drivers. For labor shortage mitigation, businesses are deploying systems for automated case handling and line-side feeding automation.
  • E-commerce demands for speed and order fulfillment accuracy are met by goods-to-person methodology and robotic sorting systems, which can increase pick rates by over 200% and reduce order cycle time reduction significantly.
  • Technologies such as automated cycle counting and robotic palletizing depalletizing provide real-time inventory visibility, which is crucial for modern supply chains.
  • The favorable return on investment calculation, driven by declining hardware costs and proven efficiency gains from goods-to-person picking, makes adoption a strategic imperative for competitive logistics operations.

What are the market trends shaping the Inventory Robots Industry?

  • The market is witnessing a dominant trend where advanced artificial intelligence is being integrated into inventory robots, moving systems beyond simple automation toward cognitive capabilities for real-time adaptation.

  • A dominant trend is the shift towards cognitive automation, powered by AI-powered data analytics and advanced computer vision systems. Intelligent orchestration software, often delivered via a cloud-based software platform, enables swarm intelligence algorithms for superior coordination, while digital twin simulation optimizes workflows before deployment. This facilitates real-time data analytics, improving forecast accuracy by over 15% and enabling predictive maintenance alerts.
  • The proliferation of subscription-based robotics models and flexible deployment models is lowering entry barriers, making niche application specialization for tasks like cold storage feasible for more businesses. These fleet management software advancements are accelerating the path toward lights-out warehouse automation, where facilities achieve continuous operation with minimal human oversight.

What challenges does the Inventory Robots Industry face during its growth?

  • The high initial capital investment and total cost of ownership present a primary challenge affecting widespread market adoption and industry growth.

  • Significant challenges hinder widespread adoption, led by technical integration complexities. Achieving seamless warehouse management system integration with warehouse execution systems is a major hurdle, with nearly 40% of projects facing delays due to interoperability issues.
  • The lack of universal system interoperability standards complicates the deployment of mixed fleets, including AI-enabled autonomous systems like autonomous shelf-scanning units and a mobile RFID robot. The technical sophistication required for tasks like robotic bin picking demands advanced machine learning algorithms and robust cybersecurity for robotic systems.
  • Furthermore, the human element presents a dual challenge, requiring effective change management strategies to ease workforce anxieties and comprehensive workforce upskilling programs to fill critical technical roles, which is essential for stock-out prevention and inventory distortion reduction.

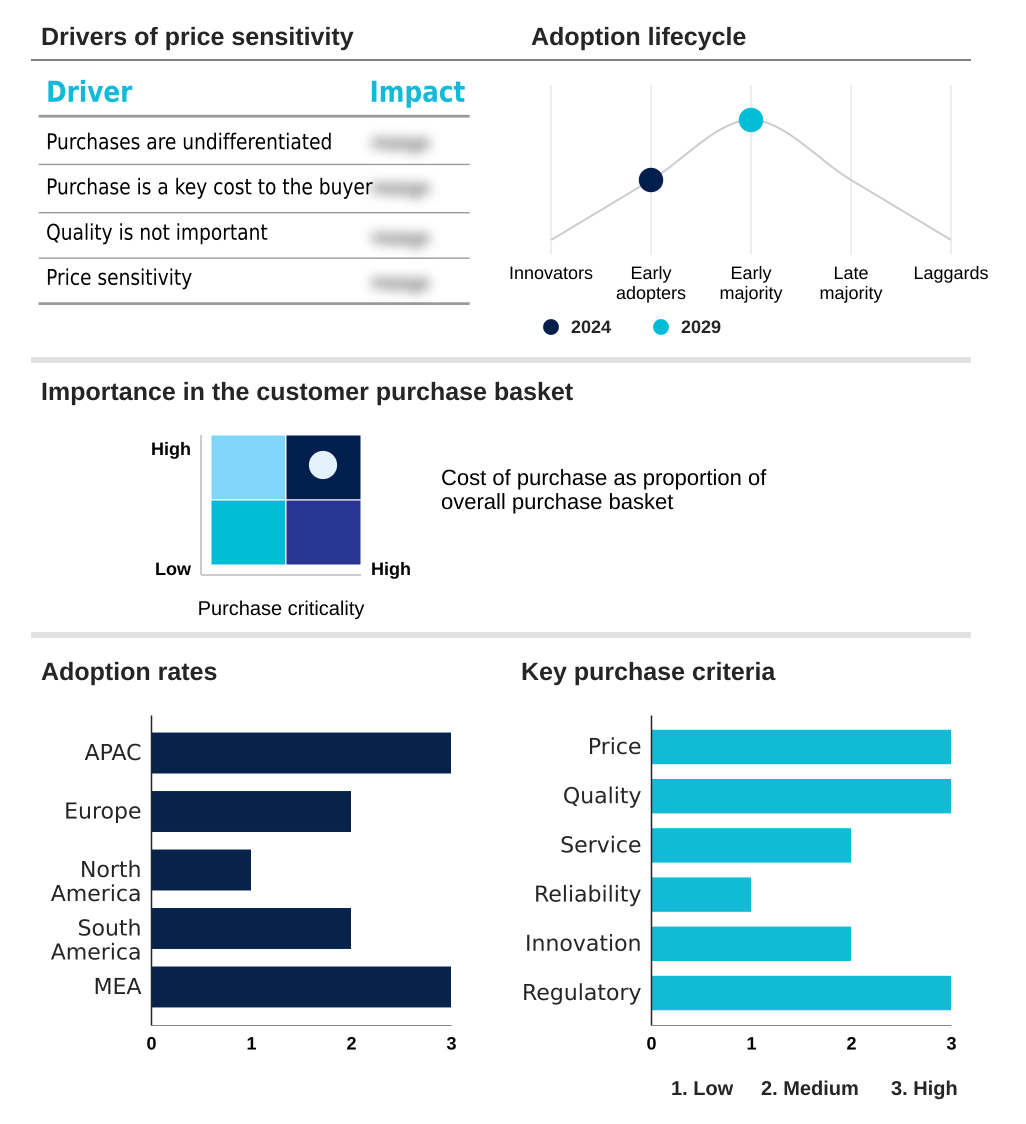
Exclusive Technavio Analysis on Customer Landscape

The inventory robots market forecasting report includes the adoption lifecycle of the market, covering from the innovator’s stage to the laggard’s stage. It focuses on adoption rates in different regions based on penetration. Furthermore, the inventory robots market report also includes key purchase criteria and drivers of price sensitivity to help companies evaluate and develop their market growth analysis strategies.

Customer Landscape of Inventory Robots Industry

Competitive Landscape

Companies are implementing various strategies, such as strategic alliances, inventory robots market forecast, partnerships, mergers and acquisitions, geographical expansion, and product/service launches, to enhance their presence in the industry.

Badger Technologies LLC - Delivering highly mobile robotic systems for automated data capture and complex case handling in dynamic logistics environments, enhancing operational visibility and material flow.

The industry research and growth report includes detailed analyses of the competitive landscape of the market and information about key companies, including:

  • Badger Technologies LLC
  • Bastian Solutions LLC
  • Bossa Nova Robotics
  • Boston Dynamics Inc.
  • Brain Corp.
  • Clearpath Robotics Inc.
  • Corvus Robotics Inc.
  • Dexory Ltd.
  • Grey Orange Pte. Ltd.
  • inVia Robotics Inc.
  • Jabil Inc.
  • Keonn Technologies
  • KION GROUP AG
  • Locus Robotics Corp.
  • MetraLabs GmbH
  • PAL Robotics
  • RightHand Robotics Inc.
  • Simbe Robotics Inc.
  • Vecna Robotics Inc.
  • Zebra Technologies Corp.

Qualitative and quantitative analysis of companies has been conducted to help clients understand the wider business environment as well as the strengths and weaknesses of key industry players. Data is qualitatively analyzed to categorize companies as pure play, category-focused, industry-focused, and diversified; it is quantitatively analyzed to categorize companies as dominant, leading, strong, tentative, and weak.

Recent Development and News in Inventory robots market

  • In April 2025, Locus Robotics Corp. announced it surpassed 5 billion units picked using its AMR fleet, achieving the latest billion picks just 24 weeks after the previous milestone in October 2024.
  • In March 2025, Boston Dynamics Inc. announced a strategic partnership with a leading logistics provider to deploy its Stretch robot for autonomous trailer unloading across a network of 50 distribution centers.
  • In December 2024, Grey Orange Pte. Ltd. secured a significant Series D funding round of $150 million to accelerate the global expansion of its AI-driven fulfillment platform and enhance R&D in robotic piece-picking.
  • In September 2024, Zebra Technologies Corp. launched its new suite of RFID-enabled autonomous inventory scanning robots, designed to provide retailers with 99.9% inventory accuracy through daily autonomous cycle counts.

Dive into Technavio’s robust research methodology, blending expert interviews, extensive data synthesis, and validated models for unparalleled Inventory Robots Market insights. See full methodology.

Market Scope
Page number 290
Base year 2024
Historic period 2019-2023
Forecast period 2025-2029
Growth momentum & CAGR Accelerate at a CAGR of 13.1%
Market growth 2025-2029 USD 3708.4 million
Market structure Fragmented
YoY growth 2024-2025(%) 11.7%
Key countries China, Japan, South Korea, India, Taiwan, Indonesia, Germany, France, Italy, UK, Spain, The Netherlands, US, Canada, Mexico, Brazil, Argentina, Chile, Saudi Arabia, UAE, South Africa, Egypt and Nigeria
Competitive landscape Leading Companies, Market Positioning of Companies, Competitive Strategies, and Industry Risks

Request Free Sample

Research Analyst Overview

  • The inventory robots market is evolving from basic material transport to intelligent, data-driven operations. Core platforms include autonomous mobile robots and automated guided vehicles, orchestrated by fleet management software and intelligent orchestration software. Navigation relies on simultaneous localization and mapping with LiDAR sensor technology.
  • Onboard computer vision systems and 3D vision systems, powered by machine learning algorithms and AI-powered data analytics, enable complex tasks. A key trend impacting boardroom strategy is the shift to specialized applications, with deployments showing productivity boosts of over 200%. This includes robotic piece-picking using advanced end-of-arm tooling, goods-to-person methodology, robotic bin picking, and automated case handling.
  • For large-scale movement, robotic palletizing depalletizing and robotic sorting systems are critical. Achieving real-time inventory visibility is a primary goal, accomplished through perpetual inventory scanning, automated cycle counting via an autonomous drone system, autonomous shelf-scanning units, or a mobile RFID robot as part of RFID-enabled autonomous systems.
  • Seamless warehouse management system integration with warehouse execution systems is paramount for success, facilitated by a cloud-based software platform. This ecosystem also supports line-side feeding automation, high-density storage retrieval, and planogram compliance monitoring, all while emphasizing human-robot collaboration and leveraging swarm intelligence algorithms in these AI-enabled autonomous systems.

What are the Key Data Covered in this Inventory Robots Market Research and Growth Report?

  • What is the expected growth of the Inventory Robots Market between 2025 and 2029?

    • USD 3.71 billion, at a CAGR of 13.1%

  • What segmentation does the market report cover?

    • The report is segmented by Product (Hardware, Software, and Services), Application (Warehousing, Retail, and Manufacturing), Type (Autonomous mobile robots, Automated guided vehicles, and Fixed robotics) and Geography (APAC, Europe, North America, South America, Middle East and Africa)

  • Which regions are analyzed in the report?

    • APAC, Europe, North America, South America and Middle East and Africa

  • What are the key growth drivers and market challenges?

    • Escalating labor shortages and rising labor costs, High initial capital investment and total cost of ownership

  • Who are the major players in the Inventory Robots Market?

    • Badger Technologies LLC, Bastian Solutions LLC, Bossa Nova Robotics, Boston Dynamics Inc., Brain Corp., Clearpath Robotics Inc., Corvus Robotics Inc., Dexory Ltd., Grey Orange Pte. Ltd., inVia Robotics Inc., Jabil Inc., Keonn Technologies, KION GROUP AG, Locus Robotics Corp., MetraLabs GmbH, PAL Robotics, RightHand Robotics Inc., Simbe Robotics Inc., Vecna Robotics Inc. and Zebra Technologies Corp.

Market Research Insights

  • The market's dynamics are shaped by a strategic push for warehouse operational efficiency and greater supply chain resilience. The adoption of robotics addresses critical challenges like labor shortage mitigation and e-commerce fulfillment complexity. Flexible and scalable automation delivers measurable business outcomes, with deployments demonstrating a 2-3x increase in productivity and reducing order picking errors by up to 60%.
  • This significantly improves order fulfillment accuracy and strengthens the return on investment calculation. As companies increasingly focus on data-driven logistics and supply chain optimization, they are turning to advanced systems that support omnichannel inventory management. The availability of flexible deployment models further accelerates adoption, enabling businesses to enhance their competitive posture in a rapidly evolving landscape.

We can help! Our analysts can customize this inventory robots market research report to meet your requirements.

Get in touch

1. Executive Summary

1.1 Market overview

Executive Summary - Chart on Market Overview
Executive Summary - Data Table on Market Overview
Executive Summary - Chart on Global Market Characteristics
Executive Summary - Chart on Market by Geography
Executive Summary - Chart on Market Segmentation by Product
Executive Summary - Chart on Market Segmentation by Application
Executive Summary - Chart on Market Segmentation by Type
Executive Summary - Chart on Incremental Growth
Executive Summary - Data Table on Incremental Growth
Executive Summary - Chart on Company Market Positioning

2. Technavio Analysis

2.1 Analysis of price sensitivity, lifecycle, customer purchase basket, adoption rates, and purchase criteria

2.2 Criticality of inputs and Factors of differentiation

Chart on Overview on criticality of inputs and factors of differentiation

2.3 Factors of disruption

Chart on Overview on factors of disruption

2.4 Impact of drivers and challenges

Chart on Impact of drivers and challenges in 2024 and 2029

3. Market Landscape

3.1 Market ecosystem

Chart on Parent Market
Data Table on - Parent Market

3.2 Market characteristics

Chart on Market characteristics analysis

3.3 Value chain analysis

Chart on Value chain analysis

4. Market Sizing

4.1 Market definition

Data Table on Offerings of companies included in the market definition

4.2 Market segment analysis

Market segments

4.3 Market size 2024

4.4 Market outlook: Forecast for 2024-2029

Chart on Global - Market size and forecast 2024-2029 ($ million)
Data Table on Global - Market size and forecast 2024-2029 ($ million)
Chart on Global Market: Year-over-year growth 2024-2029 (%)
Data Table on Global Market: Year-over-year growth 2024-2029 (%)

5. Historic Market Size

5.1 Global Inventory Robots Market 2019 - 2023

Historic Market Size - Data Table on Global Inventory Robots Market 2019 - 2023 ($ million)

5.2 Product segment analysis 2019 - 2023

Historic Market Size - Product Segment 2019 - 2023 ($ million)

5.3 Application segment analysis 2019 - 2023

Historic Market Size - Application Segment 2019 - 2023 ($ million)

5.4 Type segment analysis 2019 - 2023

Historic Market Size - Type Segment 2019 - 2023 ($ million)

5.5 Geography segment analysis 2019 - 2023

Historic Market Size - Geography Segment 2019 - 2023 ($ million)

5.6 Country segment analysis 2019 - 2023

Historic Market Size - Country Segment 2019 - 2023 ($ million)

6. Qualitative Analysis

6.1 The AI on the Global Inventory Robots Market

7. Five Forces Analysis

7.1 Five forces summary

Five forces analysis - Comparison between 2024 and 2029

7.2 Bargaining power of buyers

Bargaining power of buyers - Impact of key factors 2024 and 2029

7.3 Bargaining power of suppliers

Bargaining power of suppliers - Impact of key factors in 2024 and 2029

7.4 Threat of new entrants

Threat of new entrants - Impact of key factors in 2024 and 2029

7.5 Threat of substitutes

Threat of substitutes - Impact of key factors in 2024 and 2029

7.6 Threat of rivalry

Threat of rivalry - Impact of key factors in 2024 and 2029

7.7 Market condition

Chart on Market condition - Five forces 2024 and 2029

8. Market Segmentation by Product

8.1 Market segments

Chart on Product - Market share 2024-2029 (%)
Data Table on Product - Market share 2024-2029 (%)

8.2 Comparison by Product

Chart on Comparison by Product
Data Table on Comparison by Product

8.3 Hardware - Market size and forecast 2024-2029

Chart on Hardware - Market size and forecast 2024-2029 ($ million)
Data Table on Hardware - Market size and forecast 2024-2029 ($ million)
Chart on Hardware - Year-over-year growth 2024-2029 (%)
Data Table on Hardware - Year-over-year growth 2024-2029 (%)

8.4 Software - Market size and forecast 2024-2029

Chart on Software - Market size and forecast 2024-2029 ($ million)
Data Table on Software - Market size and forecast 2024-2029 ($ million)
Chart on Software - Year-over-year growth 2024-2029 (%)
Data Table on Software - Year-over-year growth 2024-2029 (%)

8.5 Services - Market size and forecast 2024-2029

Chart on Services - Market size and forecast 2024-2029 ($ million)
Data Table on Services - Market size and forecast 2024-2029 ($ million)
Chart on Services - Year-over-year growth 2024-2029 (%)
Data Table on Services - Year-over-year growth 2024-2029 (%)

8.6 Market opportunity by Product

Market opportunity by Product ($ million)
Data Table on Market opportunity by Product ($ million)

9. Market Segmentation by Application

9.1 Market segments

Chart on Application - Market share 2024-2029 (%)
Data Table on Application - Market share 2024-2029 (%)

9.2 Comparison by Application

Chart on Comparison by Application
Data Table on Comparison by Application

9.3 Warehousing - Market size and forecast 2024-2029

Chart on Warehousing - Market size and forecast 2024-2029 ($ million)
Data Table on Warehousing - Market size and forecast 2024-2029 ($ million)
Chart on Warehousing - Year-over-year growth 2024-2029 (%)
Data Table on Warehousing - Year-over-year growth 2024-2029 (%)

9.4 Retail - Market size and forecast 2024-2029

Chart on Retail - Market size and forecast 2024-2029 ($ million)
Data Table on Retail - Market size and forecast 2024-2029 ($ million)
Chart on Retail - Year-over-year growth 2024-2029 (%)
Data Table on Retail - Year-over-year growth 2024-2029 (%)

9.5 Manufacturing - Market size and forecast 2024-2029

Chart on Manufacturing - Market size and forecast 2024-2029 ($ million)
Data Table on Manufacturing - Market size and forecast 2024-2029 ($ million)
Chart on Manufacturing - Year-over-year growth 2024-2029 (%)
Data Table on Manufacturing - Year-over-year growth 2024-2029 (%)

9.6 Market opportunity by Application

Market opportunity by Application ($ million)
Data Table on Market opportunity by Application ($ million)

10. Market Segmentation by Type

10.1 Market segments

Chart on Type - Market share 2024-2029 (%)
Data Table on Type - Market share 2024-2029 (%)

10.2 Comparison by Type

Chart on Comparison by Type
Data Table on Comparison by Type

10.3 Autonomous mobile robots - Market size and forecast 2024-2029

Chart on Autonomous mobile robots - Market size and forecast 2024-2029 ($ million)
Data Table on Autonomous mobile robots - Market size and forecast 2024-2029 ($ million)
Chart on Autonomous mobile robots - Year-over-year growth 2024-2029 (%)
Data Table on Autonomous mobile robots - Year-over-year growth 2024-2029 (%)

10.4 Automated guided vehicles - Market size and forecast 2024-2029

Chart on Automated guided vehicles - Market size and forecast 2024-2029 ($ million)
Data Table on Automated guided vehicles - Market size and forecast 2024-2029 ($ million)
Chart on Automated guided vehicles - Year-over-year growth 2024-2029 (%)
Data Table on Automated guided vehicles - Year-over-year growth 2024-2029 (%)

10.5 Fixed robotics - Market size and forecast 2024-2029

Chart on Fixed robotics - Market size and forecast 2024-2029 ($ million)
Data Table on Fixed robotics - Market size and forecast 2024-2029 ($ million)
Chart on Fixed robotics - Year-over-year growth 2024-2029 (%)
Data Table on Fixed robotics - Year-over-year growth 2024-2029 (%)

10.6 Market opportunity by Type

Market opportunity by Type ($ million)
Data Table on Market opportunity by Type ($ million)

11. Customer Landscape

11.1 Customer landscape overview

Analysis of price sensitivity, lifecycle, customer purchase basket, adoption rates, and purchase criteria

12. Geographic Landscape

12.1 Geographic segmentation

Chart on Market share by geography 2024-2029 (%)
Data Table on Market share by geography 2024-2029 (%)

12.2 Geographic comparison

Chart on Geographic comparison
Data Table on Geographic comparison

12.3 APAC - Market size and forecast 2024-2029

Chart on APAC - Market size and forecast 2024-2029 ($ million)
Data Table on APAC - Market size and forecast 2024-2029 ($ million)
Chart on APAC - Year-over-year growth 2024-2029 (%)
Data Table on APAC - Year-over-year growth 2024-2029 (%)
Chart on Regional Comparison - APAC
Data Table on Regional Comparison - APAC

12.3.1 China - Market size and forecast 2024-2029

Chart on China - Market size and forecast 2024-2029 ($ million)
Data Table on China - Market size and forecast 2024-2029 ($ million)
Chart on China - Year-over-year growth 2024-2029 (%)
Data Table on China - Year-over-year growth 2024-2029 (%)

12.3.2 Japan - Market size and forecast 2024-2029

Chart on Japan - Market size and forecast 2024-2029 ($ million)
Data Table on Japan - Market size and forecast 2024-2029 ($ million)
Chart on Japan - Year-over-year growth 2024-2029 (%)
Data Table on Japan - Year-over-year growth 2024-2029 (%)

12.3.3 South Korea - Market size and forecast 2024-2029

Chart on South Korea - Market size and forecast 2024-2029 ($ million)
Data Table on South Korea - Market size and forecast 2024-2029 ($ million)
Chart on South Korea - Year-over-year growth 2024-2029 (%)
Data Table on South Korea - Year-over-year growth 2024-2029 (%)

12.3.4 India - Market size and forecast 2024-2029

Chart on India - Market size and forecast 2024-2029 ($ million)
Data Table on India - Market size and forecast 2024-2029 ($ million)
Chart on India - Year-over-year growth 2024-2029 (%)
Data Table on India - Year-over-year growth 2024-2029 (%)

12.3.5 Taiwan - Market size and forecast 2024-2029

Chart on Taiwan - Market size and forecast 2024-2029 ($ million)
Data Table on Taiwan - Market size and forecast 2024-2029 ($ million)
Chart on Taiwan - Year-over-year growth 2024-2029 (%)
Data Table on Taiwan - Year-over-year growth 2024-2029 (%)

12.3.6 Indonesia - Market size and forecast 2024-2029

Chart on Indonesia - Market size and forecast 2024-2029 ($ million)
Data Table on Indonesia - Market size and forecast 2024-2029 ($ million)
Chart on Indonesia - Year-over-year growth 2024-2029 (%)
Data Table on Indonesia - Year-over-year growth 2024-2029 (%)

12.4 Europe - Market size and forecast 2024-2029

Chart on Europe - Market size and forecast 2024-2029 ($ million)
Data Table on Europe - Market size and forecast 2024-2029 ($ million)
Chart on Europe - Year-over-year growth 2024-2029 (%)
Data Table on Europe - Year-over-year growth 2024-2029 (%)
Chart on Regional Comparison - Europe
Data Table on Regional Comparison - Europe

12.4.1 Germany - Market size and forecast 2024-2029

Chart on Germany - Market size and forecast 2024-2029 ($ million)
Data Table on Germany - Market size and forecast 2024-2029 ($ million)
Chart on Germany - Year-over-year growth 2024-2029 (%)
Data Table on Germany - Year-over-year growth 2024-2029 (%)

12.4.2 France - Market size and forecast 2024-2029

Chart on France - Market size and forecast 2024-2029 ($ million)
Data Table on France - Market size and forecast 2024-2029 ($ million)
Chart on France - Year-over-year growth 2024-2029 (%)
Data Table on France - Year-over-year growth 2024-2029 (%)

12.4.3 Italy - Market size and forecast 2024-2029

Chart on Italy - Market size and forecast 2024-2029 ($ million)
Data Table on Italy - Market size and forecast 2024-2029 ($ million)
Chart on Italy - Year-over-year growth 2024-2029 (%)
Data Table on Italy - Year-over-year growth 2024-2029 (%)

12.4.4 UK - Market size and forecast 2024-2029

Chart on UK - Market size and forecast 2024-2029 ($ million)
Data Table on UK - Market size and forecast 2024-2029 ($ million)
Chart on UK - Year-over-year growth 2024-2029 (%)
Data Table on UK - Year-over-year growth 2024-2029 (%)

12.4.5 Spain - Market size and forecast 2024-2029

Chart on Spain - Market size and forecast 2024-2029 ($ million)
Data Table on Spain - Market size and forecast 2024-2029 ($ million)
Chart on Spain - Year-over-year growth 2024-2029 (%)
Data Table on Spain - Year-over-year growth 2024-2029 (%)

12.4.6 The Netherlands - Market size and forecast 2024-2029

Chart on The Netherlands - Market size and forecast 2024-2029 ($ million)
Data Table on The Netherlands - Market size and forecast 2024-2029 ($ million)
Chart on The Netherlands - Year-over-year growth 2024-2029 (%)
Data Table on The Netherlands - Year-over-year growth 2024-2029 (%)

12.5 North America - Market size and forecast 2024-2029

Chart on North America - Market size and forecast 2024-2029 ($ million)
Data Table on North America - Market size and forecast 2024-2029 ($ million)
Chart on North America - Year-over-year growth 2024-2029 (%)
Data Table on North America - Year-over-year growth 2024-2029 (%)
Chart on Regional Comparison - North America
Data Table on Regional Comparison - North America

12.5.1 US - Market size and forecast 2024-2029

Chart on US - Market size and forecast 2024-2029 ($ million)
Data Table on US - Market size and forecast 2024-2029 ($ million)
Chart on US - Year-over-year growth 2024-2029 (%)
Data Table on US - Year-over-year growth 2024-2029 (%)

12.5.2 Canada - Market size and forecast 2024-2029

Chart on Canada - Market size and forecast 2024-2029 ($ million)
Data Table on Canada - Market size and forecast 2024-2029 ($ million)
Chart on Canada - Year-over-year growth 2024-2029 (%)
Data Table on Canada - Year-over-year growth 2024-2029 (%)

12.5.3 Mexico - Market size and forecast 2024-2029

Chart on Mexico - Market size and forecast 2024-2029 ($ million)
Data Table on Mexico - Market size and forecast 2024-2029 ($ million)
Chart on Mexico - Year-over-year growth 2024-2029 (%)
Data Table on Mexico - Year-over-year growth 2024-2029 (%)

12.6 South America - Market size and forecast 2024-2029

Chart on South America - Market size and forecast 2024-2029 ($ million)
Data Table on South America - Market size and forecast 2024-2029 ($ million)
Chart on South America - Year-over-year growth 2024-2029 (%)
Data Table on South America - Year-over-year growth 2024-2029 (%)
Chart on Regional Comparison - South America
Data Table on Regional Comparison - South America

12.6.1 Brazil - Market size and forecast 2024-2029

Chart on Brazil - Market size and forecast 2024-2029 ($ million)
Data Table on Brazil - Market size and forecast 2024-2029 ($ million)
Chart on Brazil - Year-over-year growth 2024-2029 (%)
Data Table on Brazil - Year-over-year growth 2024-2029 (%)

12.6.2 Argentina - Market size and forecast 2024-2029

Chart on Argentina - Market size and forecast 2024-2029 ($ million)
Data Table on Argentina - Market size and forecast 2024-2029 ($ million)
Chart on Argentina - Year-over-year growth 2024-2029 (%)
Data Table on Argentina - Year-over-year growth 2024-2029 (%)

12.6.3 Chile - Market size and forecast 2024-2029

Chart on Chile - Market size and forecast 2024-2029 ($ million)
Data Table on Chile - Market size and forecast 2024-2029 ($ million)
Chart on Chile - Year-over-year growth 2024-2029 (%)
Data Table on Chile - Year-over-year growth 2024-2029 (%)

12.7 Middle East and Africa - Market size and forecast 2024-2029

Chart on Middle East and Africa - Market size and forecast 2024-2029 ($ million)
Data Table on Middle East and Africa - Market size and forecast 2024-2029 ($ million)
Chart on Middle East and Africa - Year-over-year growth 2024-2029 (%)
Data Table on Middle East and Africa - Year-over-year growth 2024-2029 (%)
Chart on Regional Comparison - Middle East and Africa
Data Table on Regional Comparison - Middle East and Africa

12.7.1 Saudi Arabia - Market size and forecast 2024-2029

Chart on Saudi Arabia - Market size and forecast 2024-2029 ($ million)
Data Table on Saudi Arabia - Market size and forecast 2024-2029 ($ million)
Chart on Saudi Arabia - Year-over-year growth 2024-2029 (%)
Data Table on Saudi Arabia - Year-over-year growth 2024-2029 (%)

12.7.2 UAE - Market size and forecast 2024-2029

Chart on UAE - Market size and forecast 2024-2029 ($ million)
Data Table on UAE - Market size and forecast 2024-2029 ($ million)
Chart on UAE - Year-over-year growth 2024-2029 (%)
Data Table on UAE - Year-over-year growth 2024-2029 (%)

12.7.3 South Africa - Market size and forecast 2024-2029

Chart on South Africa - Market size and forecast 2024-2029 ($ million)
Data Table on South Africa - Market size and forecast 2024-2029 ($ million)
Chart on South Africa - Year-over-year growth 2024-2029 (%)
Data Table on South Africa - Year-over-year growth 2024-2029 (%)

12.7.4 Egypt - Market size and forecast 2024-2029

Chart on Egypt - Market size and forecast 2024-2029 ($ million)
Data Table on Egypt - Market size and forecast 2024-2029 ($ million)
Chart on Egypt - Year-over-year growth 2024-2029 (%)
Data Table on Egypt - Year-over-year growth 2024-2029 (%)

12.7.5 Nigeria - Market size and forecast 2024-2029

Chart on Nigeria - Market size and forecast 2024-2029 ($ million)
Data Table on Nigeria - Market size and forecast 2024-2029 ($ million)
Chart on Nigeria - Year-over-year growth 2024-2029 (%)
Data Table on Nigeria - Year-over-year growth 2024-2029 (%)

12.8 Market opportunity by geography

Market opportunity by geography ($ million)
Data Tables on Market opportunity by geography ($ million)

13. Drivers, Challenges, and Opportunity

13.1 Market drivers

Escalating labor shortages and rising labor costs
Unrelenting growth and complexity of e-commerce
Technological advancements and improving return on investment

13.2 Market challenges

High initial capital investment and total cost of ownership
Technical integration complexities and interoperability issues
Workforce dynamics and skills gap

13.3 Impact of drivers and challenges

Impact of drivers and challenges in 2024 and 2029

13.4 Market opportunities

Rise of AI and cognitive automation
Proliferation of robotics-as-a-service and flexible deployment models
Hyper-specialization of robots for niche applications

14. Competitive Landscape

14.1 Overview

14.2

Overview on criticality of inputs and factors of differentiation

14.3 Landscape disruption

Overview on factors of disruption

14.4 Industry risks

Impact of key risks on business

15. Competitive Analysis

15.1 Companies profiled

Companies covered

15.2 Company ranking index

15.3 Market positioning of companies

Matrix on companies position and classification

15.4 Badger Technologies LLC

Badger Technologies LLC - Overview
Badger Technologies LLC - Product / Service
Badger Technologies LLC - Key offerings
SWOT

15.5 Bastian Solutions LLC

Bastian Solutions LLC - Overview
Bastian Solutions LLC - Product / Service
Bastian Solutions LLC - Key offerings
SWOT

15.6 Bossa Nova Robotics

Bossa Nova Robotics - Overview
Bossa Nova Robotics - Product / Service
Bossa Nova Robotics - Key offerings
SWOT

15.7 Boston Dynamics Inc.

Boston Dynamics Inc. - Overview
Boston Dynamics Inc. - Product / Service
Boston Dynamics Inc. - Key offerings
SWOT

15.8 Brain Corp.

Brain Corp. - Overview
Brain Corp. - Product / Service
Brain Corp. - Key offerings
SWOT

15.9 Clearpath Robotics Inc.

Clearpath Robotics Inc. - Overview
Clearpath Robotics Inc. - Product / Service
Clearpath Robotics Inc. - Key news
Clearpath Robotics Inc. - Key offerings
SWOT

15.10 Corvus Robotics Inc.

Corvus Robotics Inc. - Overview
Corvus Robotics Inc. - Product / Service
Corvus Robotics Inc. - Key offerings
SWOT

15.11 Dexory Ltd.

Dexory Ltd. - Overview
Dexory Ltd. - Product / Service
Dexory Ltd. - Key offerings
SWOT

15.12 Grey Orange Pte. Ltd.

Grey Orange Pte. Ltd. - Overview
Grey Orange Pte. Ltd. - Product / Service
Grey Orange Pte. Ltd. - Key offerings
SWOT

15.13 inVia Robotics Inc.

inVia Robotics Inc. - Overview
inVia Robotics Inc. - Product / Service
inVia Robotics Inc. - Key offerings
SWOT

15.14 Jabil Inc.

Jabil Inc. - Overview
Jabil Inc. - Business segments
Jabil Inc. - Key offerings
Jabil Inc. - Segment focus
SWOT

15.15 Keonn Technologies

Keonn Technologies - Overview
Keonn Technologies - Product / Service
Keonn Technologies - Key offerings
SWOT

15.16 KION GROUP AG

KION GROUP AG - Overview
KION GROUP AG - Business segments
KION GROUP AG - Key offerings
KION GROUP AG - Segment focus
SWOT

15.17 Locus Robotics Corp.

Locus Robotics Corp. - Overview
Locus Robotics Corp. - Product / Service
Locus Robotics Corp. - Key offerings
SWOT

15.18 MetraLabs GmbH

MetraLabs GmbH - Overview
MetraLabs GmbH - Product / Service
MetraLabs GmbH - Key offerings
SWOT

16. Appendix

16.1 Scope of the report

Market definition
Objectives
Notes and caveats

16.2 Inclusions and exclusions checklist

Inclusions checklist
Exclusions checklist

16.3 Currency conversion rates for US$

16.4 Research methodology

16.5 Data procurement

Information sources

16.6 Data validation

16.7 Validation techniques employed for market sizing

16.8 Data synthesis

16.9 360 degree market analysis

16.10 List of abbreviations

Research Methodology

Technavio presents a detailed picture of the market by way of study, synthesis, and summation of data from multiple sources. The analysts have presented the various facets of the market with a particular focus on identifying the key industry influencers. The data thus presented is comprehensive, reliable, and the result of extensive research, both primary and secondary.

INFORMATION SOURCES

Primary sources

  • Manufacturers and suppliers
  • Channel partners
  • Industry experts
  • Strategic decision makers

Secondary sources

  • Industry journals and periodicals
  • Government data
  • Financial reports of key industry players
  • Historical data
  • Press releases

DATA ANALYSIS

Data Synthesis

  • Collation of data
  • Estimation of key figures
  • Analysis of derived insights

Data Validation

  • Triangulation with data models
  • Reference against proprietary databases
  • Corroboration with industry experts

REPORT WRITING

Qualitative

  • Market drivers
  • Market challenges
  • Market trends
  • Five forces analysis

Quantitative

  • Market size and forecast
  • Market segmentation
  • Geographical insights
  • Competitive landscape

Interested in this report?

Get your sample now to see our research methodology and insights!

Download Now

Frequently Asked Questions

Inventory Robots market growth will increase by USD 3708.4 million during 2025-2029.

The Inventory Robots market is expected to grow at a CAGR of 13.1% during 2025-2029.

Inventory Robots market is segmented by Product (Hardware, Software, Services) Application (Warehousing, Retail, Manufacturing) Type (Autonomous mobile robots, Automated guided vehicles, Fixed robotics)

Badger Technologies LLC, Bastian Solutions LLC, Bossa Nova Robotics, Boston Dynamics Inc., Brain Corp., Clearpath Robotics Inc., Corvus Robotics Inc., Dexory Ltd., Grey Orange Pte. Ltd., inVia Robotics Inc., Jabil Inc., Keonn Technologies, KION GROUP AG, Locus Robotics Corp., MetraLabs GmbH, PAL Robotics, RightHand Robotics Inc., Simbe Robotics Inc., Vecna Robotics Inc., Zebra Technologies Corp. are a few of the key vendors in the Inventory Robots market.

APAC will register the highest growth rate of 43% among the other regions. Therefore, the Inventory Robots market in APAC is expected to garner significant business opportunities for the vendors during the forecast period.

China, Japan, South Korea, India, Taiwan, Indonesia, Germany, France, Italy, UK, Spain, The Netherlands, US, Canada, Mexico, Brazil, Argentina, Chile, Saudi Arabia, UAE, South Africa, Egypt, Nigeria

  • Escalating labor shortages and rising labor costs is the driving factor this market.

The Inventory Robots market vendors should focus on grabbing business opportunities from the Product segment as it accounted for the largest market share in the base year.