Ion Implanter Market Size 2025-2029
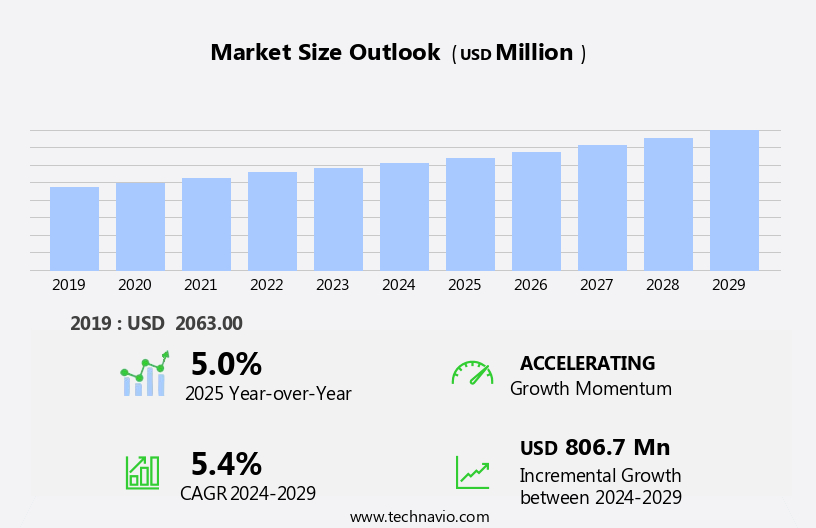
The ion implanter market size is forecast to increase by USD 806.7 million, at a CAGR of 5.4% between 2024 and 2029.
- The market is experiencing significant growth, driven by increasing investments in semiconductor fabrication facilities and the expanding market for carbon nanotubes. Ion implantation technology is a crucial process in semiconductor manufacturing, enabling the precise introduction of impurity atoms into the crystal lattice of semiconductor materials. This results in improved material properties, leading to advancements in electronics and optoelectronics. Moreover, the growing demand for refurbished and used ion implanters presents a lucrative opportunity for market participants. This trend is particularly evident in emerging economies where the cost of new equipment may be prohibitive. Key factors include the rising demand for advanced chips in consumer electronics and automotive applications, spurred by trends like 5G and electric vehicles, alongside innovations in high-current implanters that improve efficiency and precision in doping processes. As a result, the market is expected to witness robust growth in the coming years, offering ample opportunities for companies to capitalize on this expanding landscape.
- However, the market also faces challenges such as the high cost of new ion implantation systems and the need for skilled personnel to operate and maintain these complex machines. Additionally, the development of alternative technologies, such as extreme ultraviolet lithography, could potentially disrupt the market dynamics. Companies seeking to capitalize on the opportunities presented by the market must focus on cost reduction strategies, innovation, and the development of user-friendly systems to remain competitive.
What will be the Size of the Ion Implanter Market during the forecast period?
- The market is a critical segment of the semiconductor industry, enabling the production of advanced electronic devices. Ion implantation is a vital process in semiconductor manufacturing, used to modify the electrical properties of silicon wafers through the introduction of doping materials via ion beams. This process is essential for creating integrated circuits, microprocessors, memory chips, and other semiconductor components found in various consumer electronics, such as smartphones, laptops, gaming consoles, wireless access points, and 5G phones. The market is expected to expand in response to this rising semiconductor demand.
- Ion implanters come in various configurations, including high-current, medium-current, and high-energy implanters. These systems utilize an ion source, mass analyzer, ion beam accelerator, end station, and thin films to deliver ions to the target material. The ion implantation process plays a vital role in modifying the conductivity of semiconductor materials, enhancing their performance and functionality. In summary, the market is a significant contributor to the semiconductor industry, enabling the production of advanced electronic components for a wide range of applications. The market's growth is driven by the increasing demand for semiconductors in consumer electronics and telecommunications, with various ion implanter configurations available to meet the specific requirements of semiconductor manufacturing.
How is this Ion Implanter Industry segmented?
The ion implanter industry research report provides comprehensive data (region-wise segment analysis), with forecasts and estimates in "USD million" for the period 2025-2029, as well as historical data from 2019-2023 for the following segments.
- Technology
- High-current implanter
- Medium-current implanter
- High-energy implanter
- Application
- Semiconductors
- Metal finishing
- Others
- Type
- 10-28nm
- Sub-10nm
- Above 28nm
- Geography
- North America
- US
- Canada
- Europe
- France
- Germany
- UK
- APAC
- China
- India
- Japan
- South Korea
- Taiwan
- Rest of World (ROW)
- North America
By Technology Insights
The high-current implanter segment is estimated to witness significant growth during the forecast period. Ion implanters play a crucial role in the semiconductor industry by enabling the doping of silicon wafers for the fabrication of advanced electronic devices, including semiconductors, smartphones, laptops, and various consumer electronics. High-current implanters are increasingly preferred for halo implantation due to their ability to provide better angular control and higher precision. This shift is driven by the need for improved dosimetry control and the relatively low throughput of medium-current implanters at the lower energies required for halo implants. High-energy and medium-energy implanters are also used for various applications, such as deep junction formation, metal finishing, and surface modification.
The semiconductor market demand continues to grow, driven by the proliferation of 5G phones, gaming consoles, wireless access points, wearables, and other advanced electronic devices. The electronics sector, including automotive systems, renewable energy, communication infrastructure, medical applications, and digital connectivity, also relies heavily on semiconductor manufacturing. The high initial investment and operational costs associated with ion implantation equipment necessitate the use of energy-efficient technologies and high-throughput implanters. Ion implantation is a critical process in the production of integrated circuits, microprocessors, memory chips, and other advanced semiconductor devices used in various industries, including automotive, healthcare, telecommunications, artificial intelligence, electric vehicles, and automation.
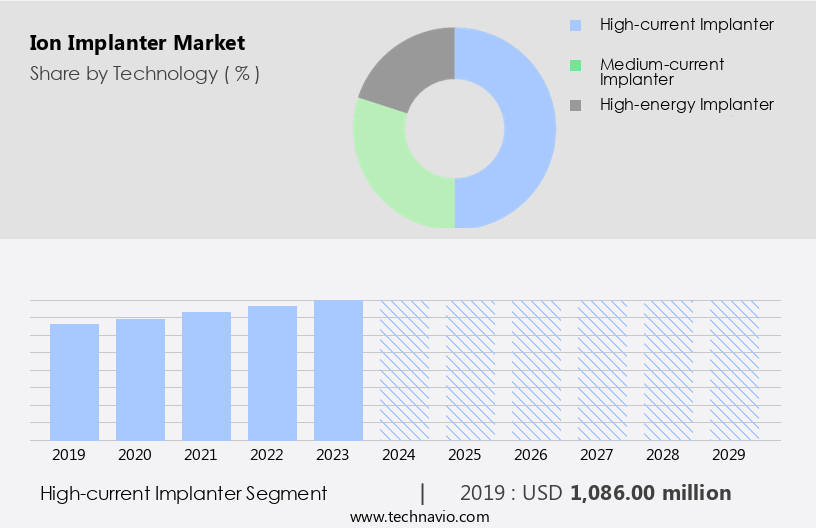
The High-current implanter segment was valued at USD 1.08 billion in 2019 and showed a gradual increase during the forecast period.
Regional Analysis
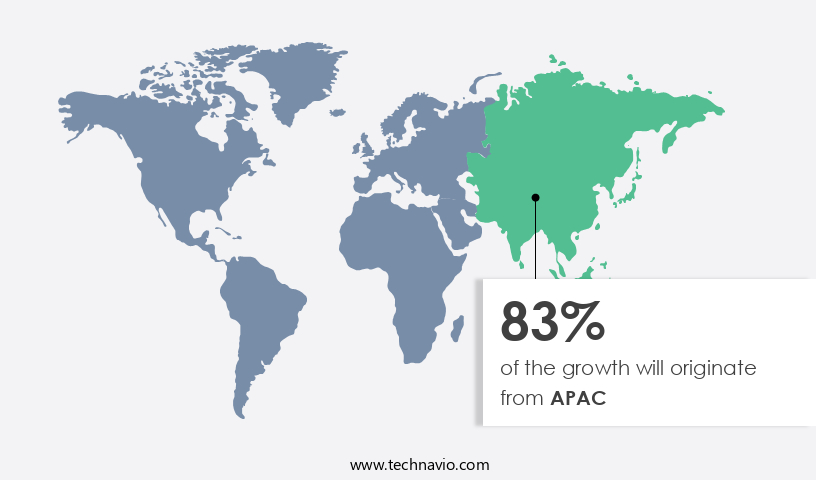
APAC is estimated to contribute 83% to the growth of the global market during the forecast period. Technavio's analysts have elaborately explained the regional trends and drivers that shape the market during the forecast period.
The market in North America is driven by the presence of leading semiconductor manufacturers, integrated device manufacturers (IDMs), and foundries. Major players, such as Intel, have multiple fabrication plants (fabs) in the US, including Fab 12, Fab 32, Fab 42, Fab 11x, and Fab 17. The increasing demand for semiconductor wafers in this region is due to the expanding use of electronics in automobiles, the adoption of smart devices, investments in renewable energy and communication infrastructure, and the establishment of numerous data centers. The semiconductor industry's growth is fueled by the rising demand for advanced semiconductor devices in consumer electronics, telecommunications, healthcare, 5G technology, artificial intelligence, electric vehicles, automation, and smart technologies.
Ion implanters are essential tools in semiconductor manufacturing, used for doping, electrical property modification, and transistor architecture characterization. They are utilized in various applications, such as high-energy ion implanters for silicon wafers, medium-current implanters for thin films, and low-energy implanters for surface modification. The high initial investment required for ion implanter systems and the ongoing semiconductor shortage pose challenges to market growth. However, the increasing demand for energy-efficient technologies and the development of high-throughput implanters offer opportunities for market expansion. The market encompasses various types of ion implanters, including high-current implanters, medium-current implanters, and high-energy implanters, as well as associated equipment such as ion sources, mass analyzers, and ion beam accelerators. Applications span across various sectors, including electronics, aerospace, medical devices, foundries, and integrated device manufacturers.
Market Dynamics
Our researchers analyzed the data with 2024 as the base year, along with the key drivers, trends, and challenges. A holistic analysis of drivers will help companies refine their marketing strategies to gain a competitive advantage.
What are the Ion Implanter market drivers leading to the rise in the adoption of Industry?
The market is experiencing significant growth due to the escalating demand for integrated circuits (ICs). This trend is driven by the increasing adoption of artificial intelligence (AI) in various industries, substantial investments in Industry 4.0 and autonomous vehicles, and the high demand for Internet of Things (IoT) devices. The integration of AI and machine learning technologies has significantly boosted the requirement for semiconductor ICs in numerous applications, such as automotive, consumer electronics, and robotics. To cater to this growing demand, key players in the market, including foundries and memory device manufacturers, are expanding their production capabilities. For instance, Samsung Electronics Co. Ltd. (Samsung) recently announced the commencement of construction for a 5-nanometer fabrication facility in South Korea, dedicated to its contract foundry business.
Ion implantation is a crucial process in semiconductor manufacturing, used for doping silicon wafers with ions to modify their electrical properties and form integrated circuits, microprocessors, memory chips, and other advanced semiconductor devices. The process involves the use of ion sources, mass analyzers, and ion beam accelerators to implant ions into the surface of silicon wafers for deep junction formation, conductivity modification, and surface modification. The high initial investment required for ion implanter equipment and the ongoing semiconductor shortage have not deterred market participants, as the potential applications and benefits of ion implantation in various industries continue to expand.
What are the Ion Implanter market trends shaping the Industry?
The market experiences growth due to the increasing demand for carbon nanotubes. Carbon nanotubes are cylindrical structures of carbon atoms with diameters in the nanometer range and structural lengths of micrometers to centimeters. Their exceptional properties, including superior mechanical strength and outstanding electrical and thermal conductivity, make them a valuable resource in various industries.
Ion implanters play a crucial role in the manufacturing process of carbon nanotubes by depositing a metal catalyst layer, typically made of nickel or cobalt, onto the substrate. This layer facilitates the growth of carbon nanotubes. The strong chemical bonds within carbon nanotubes contribute to their superior strength, which is several times greater than that of steel or other industrial fibers.
How does Ion Implanter market face challenges during its growth?
The market faces a challenge due to the rising preference for refurbished ion implanters among semiconductor manufacturers and laboratories. The high cost of new equipment has led end-users to consider refurbished options as a cost-effective alternative. Previously owned ion implanters can be refurbished to meet the latest performance standards, thereby satisfying the needs of customers who seek improved efficiency without incurring significant capital investments. Consequently, the sales of new ion implanters may be affected, impacting the overall market growth.
Ion implanters are integral to the production of chips for electric vehicles, autonomous vehicles, and advanced driver-assistance systems (ADAS). However, the market growth is challenged by the availability and sales of refurbished ion implanters. Previously owned ion implanters, such as high-current, medium-current, and high-energy implanters, can be refurbished and offer a cost-effective alternative to purchasing new equipment. This trend is particularly relevant for laboratories and semiconductor manufacturers seeking to improve the performance of their existing equipment without incurring high capital investments. The demand for refurbished ion implanters may impact the sales of new equipment in the market.
Exclusive Customer Landscape
The ion implanter market forecasting report includes the adoption lifecycle of the market, covering from the innovator's stage to the laggard's stage. It focuses on adoption rates in different regions based on penetration. Furthermore, the ion implanter market report also includes key purchase criteria and drivers of price sensitivity to help companies evaluate and develop their market growth analysis strategies.

Customer Landscape
Key Companies & Market Insights
Companies are implementing various strategies, such as strategic alliances, ion implanter market forecast, partnerships, mergers and acquisitions, geographical expansion, and product/service launches, to enhance their presence in the industry.
Amtech Systems Inc. - Ion Implant Technology Co., a subsidiary of the organization, specializes in providing advanced ion implant solutions for the solar and semiconductor industries.
The industry research and growth report includes detailed analyses of the competitive landscape of the market and information about key companies, including:
- Amtech Systems Inc.
- Applied Materials Inc.
- Axcelis Technologies Inc
- Coherent Corp.
- CoorsTek Inc.
- DANFYSIK AS
- Entegris Inc.
- High Voltage Engineering Europa BV
- Idonus Sarl
- Intevac Inc.
- ion beam services SA
- Ionoptika Ltd.
- Kingstone Semiconductor Joint Stock Co. Ltd.
- NISSIN ELECTRIC Co. Ltd.
- Plansee SE
- SHELLBACK Semiconductor Technology
- Solvay SA
- Sumitomo Heavy Industries Ltd.
- ULVAC Inc.
Qualitative and quantitative analysis of companies has been conducted to help clients understand the wider business environment as well as the strengths and weaknesses of key industry players. Data is qualitatively analyzed to categorize companies as pure play, category-focused, industry-focused, and diversified; it is quantitatively analyzed to categorize companies as dominant, leading, strong, tentative, and weak.
Recent Development and News in Ion Implanter Market
In March 2025, Axcelis Technologies, Inc., a leading supplier of enabling ion implantation solutions for the semiconductor industry, announced that it will be the Diamond Sponsor for the Compound Semiconductor Asia Conference (CS Asia) 2025. The event is being held in conjunction with SEMICON China 2025 on March 25-27, 2025, at the Kerry Hotel in Pudong, Shanghai. Axcelis' President and CEO, Russell Low, will present an opening Keynote Speech at the event.
In December 2024, Axcelis Technologies, Inc., a leading supplier of enabling ion implantation solutions for the semiconductor industry, announced that it will showcase its Purion⢠and GSD Ovation⢠Series of ion implanters at the SEMICON Japan 2024 exhibition. The conference and exhibition are being held at the Tokyo Big Sight in Tokyo, Japan.
Research Analyst Overview
Ion implanters play a crucial role in the semiconductor industry, enabling the production of advanced electronic devices. These machines utilize ion beams to implant doping materials into silicon wafers, modifying their electrical properties and facilitating the fabrication of complex semiconductor structures. The global demand for semiconductors continues to grow, driven by the increasing adoption of electronic devices in various sectors. Consumer electronics, telecommunications, healthcare, and automotive systems are some of the major industries fueling this demand. The proliferation of 5G technology, artificial intelligence, electric vehicles, and smart technologies further boosts the need for semiconductors. Semiconductor fabrication relies on ion implanters to create the intricate structures required for integrated circuits, microprocessors, memory chips, and other advanced semiconductor devices.
The ion implantation process involves several types of implanters, including high-current, high-energy, and medium-current implanters, each optimized for specific applications. High initial investments are a common challenge in the semiconductor manufacturing sector. Ion implanters, as essential equipment in the semiconductor fabrication process, contribute significantly to these investments. However, the benefits derived from their use, such as improved conductivity modification, deep junction formation, and equipment characterization, make them indispensable. The semiconductor industry faces a shortage of chips, which can hinder the production of various electronic devices. Ion implanters play a role in addressing this issue by optimizing the ion implantation process to increase throughput and improve process control.
Ion implanters find applications in various sectors, including electronics, aerospace, medical devices, and renewable energy. In the electronics sector, they are used for surface modification, wear resistance, and solar cell efficiency enhancement. In the automotive industry, they contribute to the production of advanced driver-assistance systems (ADAS) and electric vehicle (EV) components. The semiconductor industry's operational costs can be substantial, with ion implanters being a significant contributor. However, the benefits derived from their use, such as increased efficiency, improved product quality, and enhanced functionality, make them a worthwhile investment.
Their role in semiconductor fabrication, from conductivity modification to deep junction formation, makes them indispensable. Despite the high initial investment, their benefits in terms of increased efficiency, improved product quality, and enhanced functionality make them a valuable asset for manufacturers.
Dive into Technavio's strong research methodology, blending expert interviews, extensive data synthesis, and validated models for unparalleled Ion Implanter Market insights. See full methodology.
|
Market Scope |
|
|
Report Coverage |
Details |
|
Page number |
219 |
|
Base year |
2024 |
|
Historic period |
2019-2023 |
|
Forecast period |
2025-2029 |
|
Growth momentum & CAGR |
Accelerate at a CAGR of 5.4% |
|
Market growth 2025-2029 |
USD 806.7 million |
|
Market structure |
Fragmented |
|
YoY growth 2024-2025(%) |
5.0 |
|
Key countries |
China, Japan, South Korea, Taiwan, US, India, Germany, France, UK, and Canada |
|
Competitive landscape |
Leading Companies, Market Positioning of Companies, Competitive Strategies, and Industry Risks |
What are the Key Data Covered in this Ion Implanter Market Research and Growth Report?
- CAGR of the Ion Implanter industry during the forecast period
- Detailed information on factors that will drive the growth and forecasting between 2025 and 2029
- Precise estimation of the size of the market and its contribution of the industry in focus to the parent market
- Accurate predictions about upcoming growth and trends and changes in consumer behaviour
- Growth of the market across APAC, North America, Europe, South America, and Middle East and Africa
- Thorough analysis of the market's competitive landscape and detailed information about companies
- Comprehensive analysis of factors that will challenge the ion implanter market growth of industry companies
We can help! Our analysts can customize this ion implanter market research report to meet your requirements.
 RIA -
RIA - 
