Isobutanol Market Analysis, Size, and Forecast 2026-2030: APAC (China, Japan, and India), Europe (Germany, UK, and France), North America (US, Canada, and Mexico), Middle East and Africa (Saudi Arabia, UAE, and South Africa), South America (Brazil and Argentina), and Rest of World (ROW)

Isobutanol Market Analysis, Size, and Forecast 2026-2030:
APAC (China, Japan, and India), Europe (Germany, UK, and France), North America (US, Canada, and Mexico), Middle East and Africa (Saudi Arabia, UAE, and South Africa), South America (Brazil and Argentina), and Rest of World (ROW)

Published: Dec 2025 299 Pages SKU: IRTNTR71597

Market Overview at a Glance

$438.5 Mn
Market Opportunity
5.4%
CAGR 2025 - 2030
31.6%
North America Growth
$567.1 Mn
Solvent segment 2024

Isobutanol Market Size 2026-2030

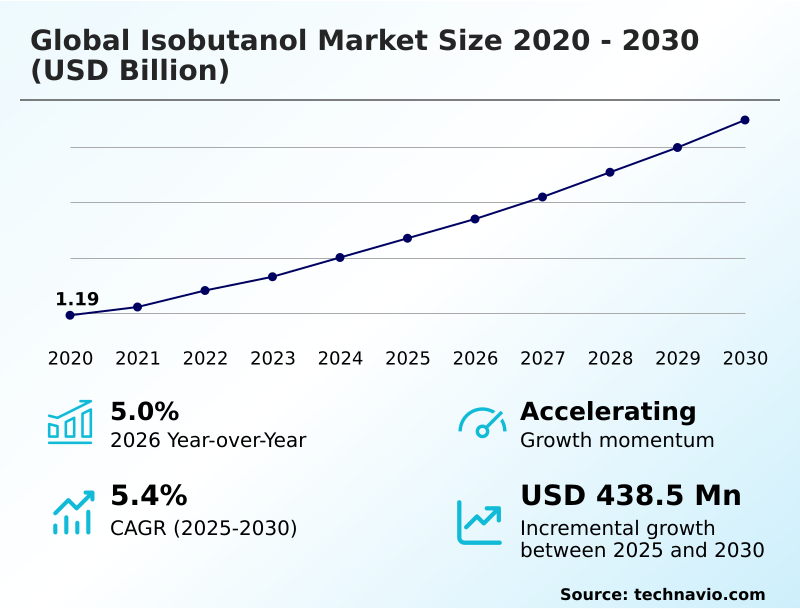
The isobutanol market size is valued to increase by USD 438.5 million, at a CAGR of 5.4% from 2025 to 2030. Increasing demand for coatings in automotive sector will drive the isobutanol market.

Major Market Trends & Insights

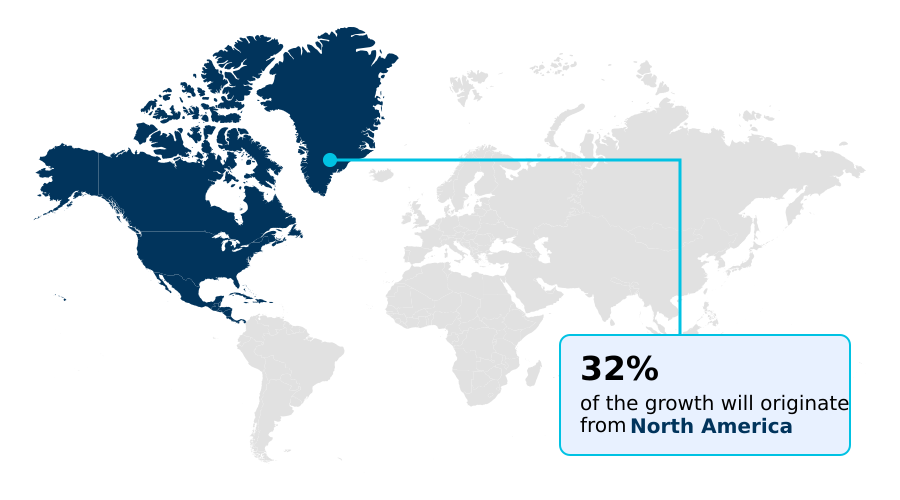
  • North America dominated the market and accounted for a 31.6% growth during the forecast period.
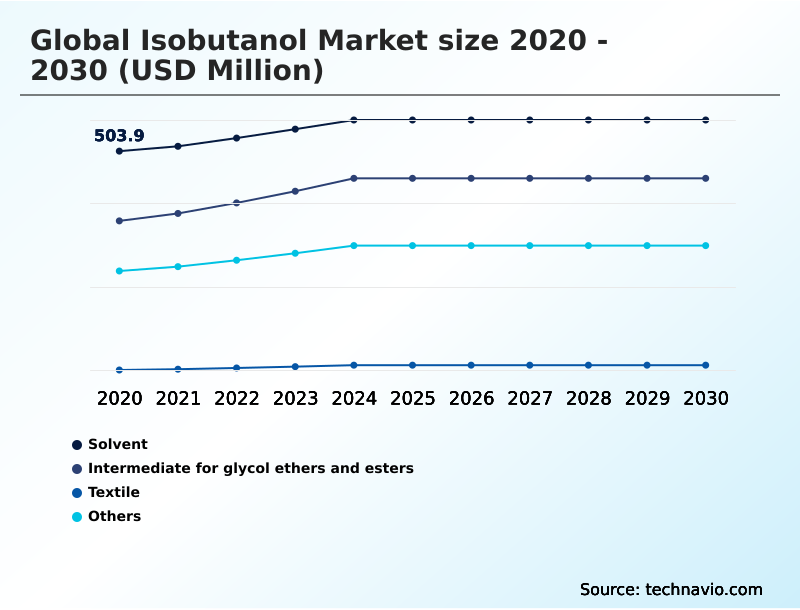
  • By Application - Solvent segment was valued at USD 567.1 million in 2024
  • By Product - Bio-based segment accounted for the largest market revenue share in 2024

Market Size & Forecast

  • Market Opportunities: USD 717.9 million
  • Market Future Opportunities: USD 438.5 million
  • CAGR from 2025 to 2030 : 5.4%

Market Summary

  • The isobutanol market is characterized by its broad utility across multiple industries, functioning as both a critical solvent and a chemical intermediate. Its growth is closely linked to the expansion of the automotive and construction sectors, which rely on high-performance coatings and paints where isobutanol is a key ingredient.
  • A significant trend is the increasing demand for bio-based chemicals, driving innovation in producing isobutanol from renewable resources like biomass, which offers a lower carbon footprint. This shift presents both opportunities and challenges. For instance, a paint manufacturer must navigate the volatile prices of petrochemical derivative feedstocks while also exploring bio-based alternatives to meet stricter volatile organic compound regulations.
  • This requires strategic decisions on supply chain resilience, investment in fermentation process technology, and product reformulation. The development of sustainable aviation fuel from isobutanol further diversifies its application profile, positioning it as a key component in the transition toward a circular economy principle.

What will be the Size of the Isobutanol Market during the forecast period?

Get Key Insights on Market Forecast (PDF) Request Free Sample

How is the Isobutanol Market Segmented?

The isobutanol industry research report provides comprehensive data (region-wise segment analysis), with forecasts and estimates in "USD million" for the period 2026-2030, as well as historical data from 2020-2024 for the following segments.

  • Application
    • Solvent
    • Intermediate for glycol ethers and esters
    • Textile
    • Others
  • Product
    • Bio-based
    • Synthetic
  • Grade type
    • Industrial grade
    • Pharmaceutical grade
    • Food grade
  • Geography
    • APAC
      • China
      • Japan
      • India
    • Europe
      • Germany
      • UK
      • France
    • North America
      • US
      • Canada
      • Mexico
    • Middle East and Africa
      • Saudi Arabia
      • UAE
      • South Africa
    • South America
      • Brazil
      • Argentina
    • Rest of World (ROW)

By Application Insights

The solvent segment is estimated to witness significant growth during the forecast period.

The industrial application of isobutanol as a solvent is foundational to its market position, particularly in the paints and coatings industry. It is extensively used as a paint thinner component and in wood coating formulation.

The substance's properties, including its slow evaporation rate, make it a critical architectural coating solvent for lacquers, inks, and various protective finishes. Demand is closely tied to industrialization, with sectors like automotive and construction being primary consumers.

The market is experiencing a notable 5.0% year-over-year growth, reflecting increased manufacturing activity. Key applications include its use as a glycol ether synthesis precursor and in diverse chemical intermediate processes, underscoring its versatility as an industrial grade solvent.

Request Free Sample

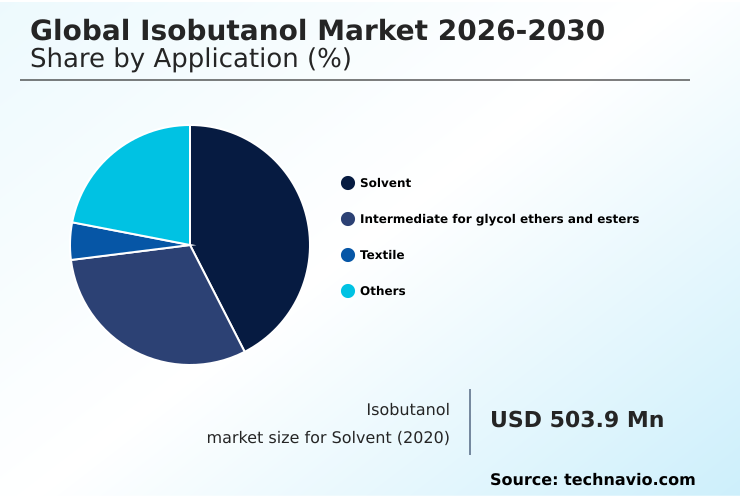
The Solvent segment was valued at USD 567.1 million in 2024 and showed a gradual increase during the forecast period.

Request Free Sample

Regional Analysis

North America is estimated to contribute 31.6% to the growth of the global market during the forecast period.Technavio’s analysts have elaborately explained the regional trends and drivers that shape the market during the forecast period.

See How Isobutanol Market Demand is Rising in North America Request Free Sample

The geographic landscape of the isobutanol market is shaped by regional industrial strengths and regulatory priorities.

North America accounts for 31.6% of the market's incremental growth, driven by its robust petrochemical infrastructure and pioneering efforts in bio-isobutanol for sustainable aviation fuel.

The region's focus on technological advancement allows companies to achieve up to a 15% improvement in production yields from new catalytic processes.

In APAC, rapid industrialization, particularly in China and India, fuels demand for isobutanol as a textile finishing agent and in automotive coating formulation.

Meanwhile, Europe's stringent environmental laws, such as REACH, propel the adoption of bio-based isobutanol and other low-carbon footprint chemical alternatives, emphasizing a move toward a circular economy principle and away from conventional petrochemical derivative products.

Market Dynamics

Our researchers analyzed the data with 2025 as the base year, along with the key drivers, trends, and challenges. A holistic analysis of drivers will help companies refine their marketing strategies to gain a competitive advantage.

  • Strategic decision-making in the global isobutanol market 2026-2030 requires a deep understanding of its multifaceted applications and economic drivers. The process for synthetic isobutanol production remains dominant, but the cost of bio-based isobutanol production is decreasing, making it a viable alternative. Comparing isobutanol and ethanol biofuels reveals isobutanol's superior energy density, which improves fuel economy with isobutanol.
  • This advantage is critical for its role in producing renewable isobutanol from biomass and its potential for sustainable aviation fuel from isobutanol. In industrial settings, the role of isobutanol in textile processing and for non-woven medical textiles is expanding. Formulating paints and coatings with isobutanol is a core application, where it functions as an architectural coating solvent.
  • Automotive sector isobutanol consumption trends show steady demand. Beyond fuels and coatings, isobutanol serves as a versatile chemical intermediate and is used for isobutanol derivative chemical synthesis. Its applications for pharmaceutical grade isobutanol are growing, while common uses for industrial grade isobutanol remain stable. Factors driving isobutanol price volatility and VOC regulations affecting isobutanol usage are key challenges.
  • The material also functions as a feedstock for plasticizers and is used in lubricant additives, showcasing its wide-ranging industrial importance.

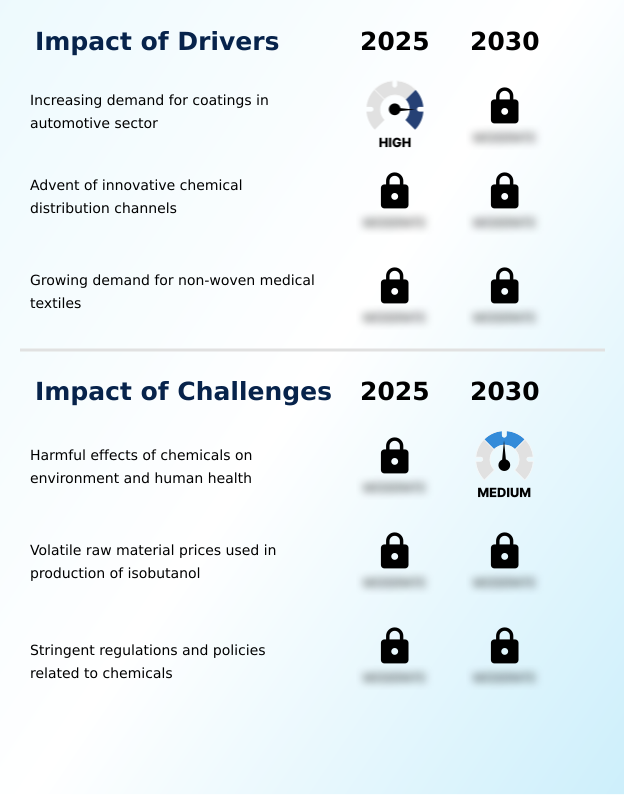
What are the key market drivers leading to the rise in the adoption of Isobutanol Industry?

  • The increasing demand for coatings within the automotive sector stands as a key driver for market growth.

  • Market growth is significantly driven by robust demand from the automotive sector and the modernization of chemical distribution channels.
  • In the automotive industry, isobutanol is essential for formulating high-performance surface coatings and engine coatings that provide superior scratch resistance and chip resistance.
  • This demand is amplified by the global expansion of automotive manufacturing, with isobutanol-based coatings improving production line efficiency by reducing drying times by up to 8%.
  • Simultaneously, the shift from traditional distribution to direct-to-consumer models has enabled producers to reach new customer segments more effectively, increasing market penetration by 15% in previously underserved regions.
  • The growing use of non-woven medical textiles, where isobutanol serves as a critical solvent, further underpins its expanding application base.

What are the market trends shaping the Isobutanol Industry?

  • The rising rate of industrialization in emerging economies is a significant upcoming trend, which is expected to drive demand across key end-user industries.

  • Key market trends are redefining the competitive landscape, primarily through the accelerated adoption of bio-based chemicals and strategic consolidation. The demand for renewable isobutanol, which can be produced from biomass using advanced biofuel technologies, is surging as companies aim to reduce their carbon footprint and lessen dependence on fossil fuels.
  • This shift has led to an uptick in mergers and acquisitions, with major players acquiring innovative startups to gain access to proprietary fermentation technologies and carbon capture infrastructure. These strategic moves are enabling companies to improve production efficiency by over 10%.
  • Furthermore, the development of bio-isobutanol as a drop-in sustainable aviation fuel (SAF) is creating new high-value opportunities, with early adopters demonstrating a 5% improvement in fuel-burn efficiency compared to some alternatives.

What challenges does the Isobutanol Industry face during its growth?

  • The harmful effects of chemicals on the environment and human health present a key challenge affecting industry growth.

  • The market faces considerable challenges from a stringent regulatory environment and the volatility of raw material pricing. Regulations such as REACH and EPA standards impose strict limits on volatile organic compound (VOC) content, compelling manufacturers to invest heavily in reformulation, which can increase R&D costs by up to 20%.
  • These compliance expenses and lengthy approval processes can hinder profitability and slow market entry. Additionally, the price of feedstocks like propylene is subject to significant fluctuations due to geopolitical factors and supply-demand imbalances.
  • This price instability can erode profit margins by as much as 10% in a single quarter, making it difficult for producers to maintain consistent pricing and plan long-term production strategies effectively.

Exclusive Technavio Analysis on Customer Landscape

The isobutanol market forecasting report includes the adoption lifecycle of the market, covering from the innovator’s stage to the laggard’s stage. It focuses on adoption rates in different regions based on penetration. Furthermore, the isobutanol market report also includes key purchase criteria and drivers of price sensitivity to help companies evaluate and develop their market growth analysis strategies.

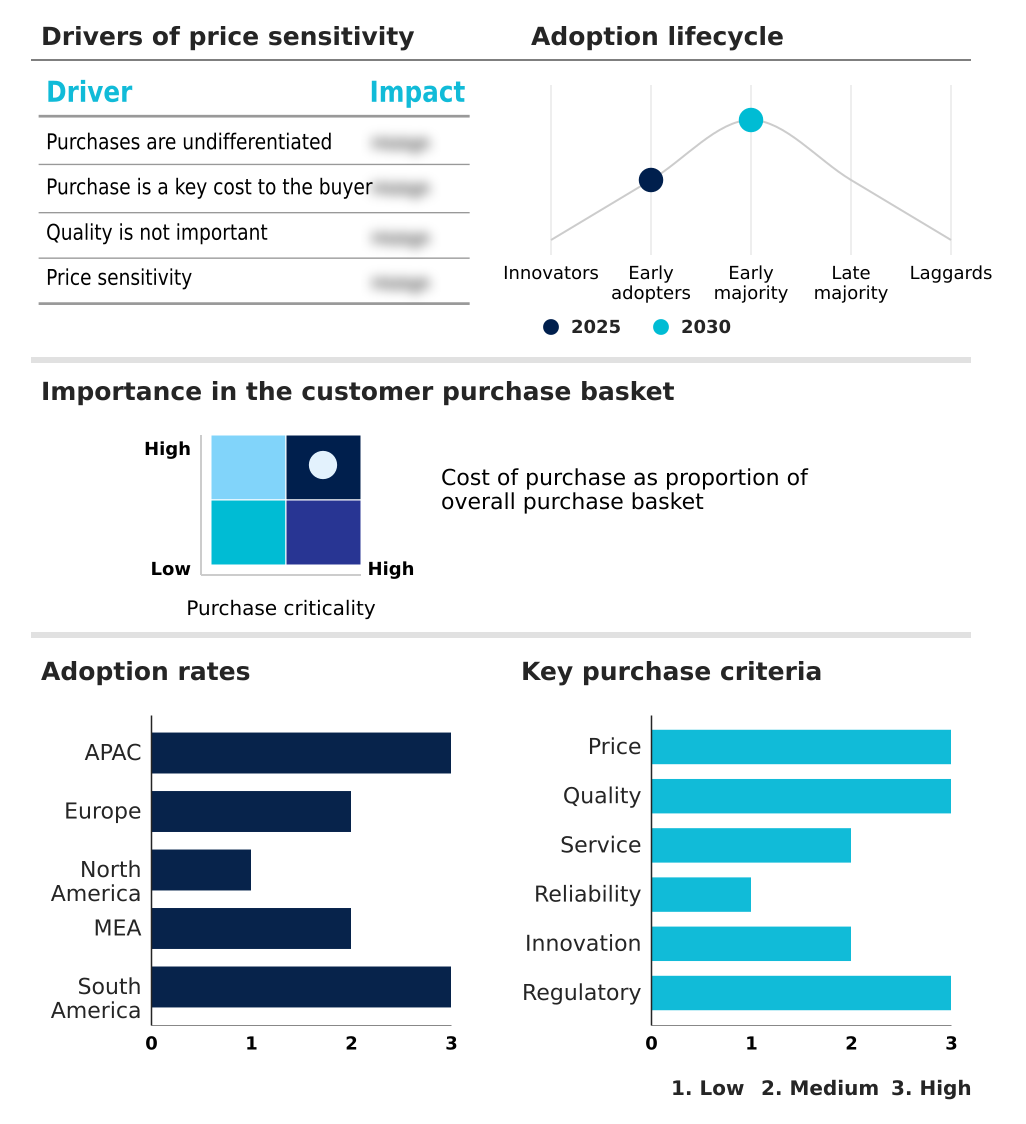
Customer Landscape of Isobutanol Industry

Competitive Landscape

Companies are implementing various strategies, such as strategic alliances, isobutanol market forecast, partnerships, mergers and acquisitions, geographical expansion, and product/service launches, to enhance their presence in the industry.

Andhra Petrochemicals Ltd. - Offerings include high-purity isobutanol for synthesis, serving as a critical raw material for performance chemicals and advanced material applications.

The industry research and growth report includes detailed analyses of the competitive landscape of the market and information about key companies, including:

  • Andhra Petrochemicals Ltd.
  • BASF SE
  • Bharat Petroleum Corp. Ltd.
  • BP Plc
  • DhanLaxmi Organics and Chemicals
  • Dow Chemical Co.
  • Eastman Chemical Co.
  • Formosa Plastics Corp.
  • Grupa Azoty SA
  • Hi Tech Chemicals Converters Pvt. Ltd.
  • INEOS Group Holdings S.A.
  • Merck KGaA
  • Mitsubishi Chemical Corp.
  • Nan Ya Plastic Corp.
  • Niksan Pharmaceutical
  • OQ SAOC
  • Petroliam Nasional Berhad
  • Sasol Ltd.
  • SIBUR Holding PJSC
  • Somu Group of Companies Inc.

Qualitative and quantitative analysis of companies has been conducted to help clients understand the wider business environment as well as the strengths and weaknesses of key industry players. Data is qualitatively analyzed to categorize companies as pure play, category-focused, industry-focused, and diversified; it is quantitatively analyzed to categorize companies as dominant, leading, strong, tentative, and weak.

Recent Development and News in Isobutanol market

  • In August 2024, Gevo Inc. provided a corporate update detailing significant progress on its Net-Zero projects, which are centered around its proprietary isobutanol production technology for creating sustainable aviation fuel and other renewable hydrocarbons.
  • In October 2024, BASF SE announced a major expansion of its isobutanol production facility in China to meet escalating regional demand for automotive coatings and chemical intermediates, reinforcing its position in the APAC market.
  • In February 2025, Gevo Inc. completed its acquisition of Red Trail Energy (RTE), a strategic maneuver that significantly bolsters its position in the sustainable fuels market by integrating RTE's ethanol production with its isobutanol technology.
  • In March 2025, Novo Nordisk's agreement to acquire the contract development and manufacturing organization (CDMO) Catalent signaled a broader trend of consolidation, expected to increase regional demand for high-purity pharmaceutical grade isobutanol to support complex drug syntheses.

Dive into Technavio’s robust research methodology, blending expert interviews, extensive data synthesis, and validated models for unparalleled Isobutanol Market insights. See full methodology.

Market Scope
Page number 299
Base year 2025
Historic period 2020-2024
Forecast period 2026-2030
Growth momentum & CAGR Accelerate at a CAGR of 5.4%
Market growth 2026-2030 USD 438.5 million
Market structure Fragmented
YoY growth 2025-2026(%) 5.0%
Key countries China, Japan, India, South Korea, Australia, Indonesia, Germany, UK, France, Italy, Spain, The Netherlands, US, Canada, Mexico, Saudi Arabia, UAE, South Africa, Israel, Turkey, Brazil, Argentina and Chile
Competitive landscape Leading Companies, Market Positioning of Companies, Competitive Strategies, and Industry Risks

Request Free Sample

Research Analyst Overview

  • The isobutanol market is evolving beyond its traditional role, driven by innovations in both production and application. The use of oxo-alcohol as a foundational chemical intermediate is well-established, but the industry is now pivoting toward advanced bio-based chemical solutions derived from a fermentation process. This shift is a direct response to demand for renewable hydrocarbon alternatives.
  • Boardroom decisions are increasingly focused on navigating the complexities of feedstock sourcing, balancing between conventional propylene hydrogenation and emerging biomass conversion methods. The adoption of carbon capture and storage technologies is becoming a key differentiator, with some producers reporting a 10% reduction in their overall carbon footprint.
  • Applications are diversifying from standard industrial grade solvent use in paint thinner component and wood coating formulation to high-value uses in pharmaceutical grade solvent and food grade adjuvant products. This diversification is also seen in its role as a flotation agent, de-icing fluid, lubricant additive, fuel additive, and agrochemical intermediate, underscoring its expanding utility across sectors.

What are the Key Data Covered in this Isobutanol Market Research and Growth Report?

  • What is the expected growth of the Isobutanol Market between 2026 and 2030?

    • USD 438.5 million, at a CAGR of 5.4%

  • What segmentation does the market report cover?

    • The report is segmented by Application (Solvent, Intermediate for glycol ethers and esters, Textile, and Others), Product (Bio-based, and Synthetic), Grade Type (Industrial grade, Pharmaceutical grade, and Food grade) and Geography (APAC, Europe, North America, Middle East and Africa, South America)

  • Which regions are analyzed in the report?

    • APAC, Europe, North America, Middle East and Africa and South America

  • What are the key growth drivers and market challenges?

    • Increasing demand for coatings in automotive sector, Harmful effects of chemicals on environment and human health

  • Who are the major players in the Isobutanol Market?

    • Andhra Petrochemicals Ltd., BASF SE, Bharat Petroleum Corp. Ltd., BP Plc, DhanLaxmi Organics and Chemicals, Dow Chemical Co., Eastman Chemical Co., Formosa Plastics Corp., Grupa Azoty SA, Hi Tech Chemicals Converters Pvt. Ltd., INEOS Group Holdings S.A., Merck KGaA, Mitsubishi Chemical Corp., Nan Ya Plastic Corp., Niksan Pharmaceutical, OQ SAOC, Petroliam Nasional Berhad, Sasol Ltd., SIBUR Holding PJSC and Somu Group of Companies Inc.

Market Research Insights

  • The isobutanol market's momentum is shaped by the dual demand for traditional synthetic and emerging bio-based variants. Innovations in production are enabling firms to improve process efficiency by over 12%, enhancing the cost-competitiveness of renewable isobutanol. This is crucial as industries seek sustainable alternatives to petroleum-derived feedstocks.
  • For instance, in the coatings sector, reformulations utilizing bio-isobutanol can reduce volatile organic compound (VOC) emissions by up to 25%, aligning with stringent environmental regulations. The adoption of advanced distribution channels has also improved supply chain responsiveness, with some suppliers reporting a 15% reduction in delivery lead times.
  • This efficiency, combined with the material's performance as a flow and gloss enhancer and octane level booster, reinforces its value proposition across diverse applications.

We can help! Our analysts can customize this isobutanol market research report to meet your requirements.

Get in touch

1. Executive Summary

1.1 Market overview

Executive Summary - Chart on Market Overview
Executive Summary - Data Table on Market Overview
Executive Summary - Chart on Global Market Characteristics
Executive Summary - Chart on Market by Geography
Executive Summary - Chart on Market Segmentation by Application
Executive Summary - Chart on Market Segmentation by Product
Executive Summary - Chart on Market Segmentation by Grade Type
Executive Summary - Chart on Incremental Growth
Executive Summary - Data Table on Incremental Growth
Executive Summary - Chart on Company Market Positioning

2. Technavio Analysis

2.1 Analysis of price sensitivity, lifecycle, customer purchase basket, adoption rates, and purchase criteria

2.2 Criticality of inputs and Factors of differentiation

Chart on Overview on criticality of inputs and factors of differentiation

2.3 Factors of disruption

Chart on Overview on factors of disruption

2.4 Impact of drivers and challenges

Chart on Impact of drivers and challenges in 2025 and 2030

3. Market Landscape

3.1 Market ecosystem

Chart on Parent Market
Data Table on - Parent Market

3.2 Market characteristics

Chart on Market characteristics analysis

3.3 Value chain analysis

Chart on Value chain analysis

4. Market Sizing

4.1 Market definition

Data Table on Offerings of companies included in the market definition

4.2 Market segment analysis

Market segments

4.3 Market size 2025

4.4 Market outlook: Forecast for 2025-2030

Chart on Global - Market size and forecast 2025-2030 ($ million)
Data Table on Global - Market size and forecast 2025-2030 ($ million)
Chart on Global Market: Year-over-year growth 2025-2030 (%)
Data Table on Global Market: Year-over-year growth 2025-2030 (%)

5. Historic Market Size

5.1 Global Isobutanol Market 2020 - 2024

Historic Market Size - Data Table on Global Isobutanol Market 2020 - 2024 ($ million)

5.2 Application segment analysis 2020 - 2024

Historic Market Size - Application Segment 2020 - 2024 ($ million)

5.3 Product segment analysis 2020 - 2024

Historic Market Size - Product Segment 2020 - 2024 ($ million)

5.4 Grade Type segment analysis 2020 - 2024

Historic Market Size - Grade Type Segment 2020 - 2024 ($ million)

5.5 Geography segment analysis 2020 - 2024

Historic Market Size - Geography Segment 2020 - 2024 ($ million)

5.6 Country segment analysis 2020 - 2024

Historic Market Size - Country Segment 2020 - 2024 ($ million)

6. Qualitative Analysis

6.1 The AI impact on Global Isobutanol Market

7. Five Forces Analysis

7.1 Five forces summary

Five forces analysis - Comparison between 2025 and 2030

7.2 Bargaining power of buyers

Bargaining power of buyers - Impact of key factors 2025 and 2030

7.3 Bargaining power of suppliers

Bargaining power of suppliers - Impact of key factors in 2025 and 2030

7.4 Threat of new entrants

Threat of new entrants - Impact of key factors in 2025 and 2030

7.5 Threat of substitutes

Threat of substitutes - Impact of key factors in 2025 and 2030

7.6 Threat of rivalry

Threat of rivalry - Impact of key factors in 2025 and 2030

7.7 Market condition

Chart on Market condition - Five forces 2025 and 2030

8. Market Segmentation by Application

8.1 Market segments

Chart on Application - Market share 2025-2030 (%)
Data Table on Application - Market share 2025-2030 (%)

8.2 Comparison by Application

Chart on Comparison by Application
Data Table on Comparison by Application

8.3 Solvent - Market size and forecast 2025-2030

Chart on Solvent - Market size and forecast 2025-2030 ($ million)
Data Table on Solvent - Market size and forecast 2025-2030 ($ million)
Chart on Solvent - Year-over-year growth 2025-2030 (%)
Data Table on Solvent - Year-over-year growth 2025-2030 (%)

8.4 Intermediate for glycol ethers and esters - Market size and forecast 2025-2030

Chart on Intermediate for glycol ethers and esters - Market size and forecast 2025-2030 ($ million)
Data Table on Intermediate for glycol ethers and esters - Market size and forecast 2025-2030 ($ million)
Chart on Intermediate for glycol ethers and esters - Year-over-year growth 2025-2030 (%)
Data Table on Intermediate for glycol ethers and esters - Year-over-year growth 2025-2030 (%)

8.5 Textile - Market size and forecast 2025-2030

Chart on Textile - Market size and forecast 2025-2030 ($ million)
Data Table on Textile - Market size and forecast 2025-2030 ($ million)
Chart on Textile - Year-over-year growth 2025-2030 (%)
Data Table on Textile - Year-over-year growth 2025-2030 (%)

8.6 Others - Market size and forecast 2025-2030

Chart on Others - Market size and forecast 2025-2030 ($ million)
Data Table on Others - Market size and forecast 2025-2030 ($ million)
Chart on Others - Year-over-year growth 2025-2030 (%)
Data Table on Others - Year-over-year growth 2025-2030 (%)

8.7 Market opportunity by Application

Market opportunity by Application ($ million)
Data Table on Market opportunity by Application ($ million)

9. Market Segmentation by Product

9.1 Market segments

Chart on Product - Market share 2025-2030 (%)
Data Table on Product - Market share 2025-2030 (%)

9.2 Comparison by Product

Chart on Comparison by Product
Data Table on Comparison by Product

9.3 Bio-based - Market size and forecast 2025-2030

Chart on Bio-based - Market size and forecast 2025-2030 ($ million)
Data Table on Bio-based - Market size and forecast 2025-2030 ($ million)
Chart on Bio-based - Year-over-year growth 2025-2030 (%)
Data Table on Bio-based - Year-over-year growth 2025-2030 (%)

9.4 Synthetic - Market size and forecast 2025-2030

Chart on Synthetic - Market size and forecast 2025-2030 ($ million)
Data Table on Synthetic - Market size and forecast 2025-2030 ($ million)
Chart on Synthetic - Year-over-year growth 2025-2030 (%)
Data Table on Synthetic - Year-over-year growth 2025-2030 (%)

9.5 Market opportunity by Product

Market opportunity by Product ($ million)
Data Table on Market opportunity by Product ($ million)

10. Market Segmentation by Grade Type

10.1 Market segments

Chart on Grade Type - Market share 2025-2030 (%)
Data Table on Grade Type - Market share 2025-2030 (%)

10.2 Comparison by Grade Type

Chart on Comparison by Grade Type
Data Table on Comparison by Grade Type

10.3 Industrial grade - Market size and forecast 2025-2030

Chart on Industrial grade - Market size and forecast 2025-2030 ($ million)
Data Table on Industrial grade - Market size and forecast 2025-2030 ($ million)
Chart on Industrial grade - Year-over-year growth 2025-2030 (%)
Data Table on Industrial grade - Year-over-year growth 2025-2030 (%)

10.4 Pharmaceutical grade - Market size and forecast 2025-2030

Chart on Pharmaceutical grade - Market size and forecast 2025-2030 ($ million)
Data Table on Pharmaceutical grade - Market size and forecast 2025-2030 ($ million)
Chart on Pharmaceutical grade - Year-over-year growth 2025-2030 (%)
Data Table on Pharmaceutical grade - Year-over-year growth 2025-2030 (%)

10.5 Food grade - Market size and forecast 2025-2030

Chart on Food grade - Market size and forecast 2025-2030 ($ million)
Data Table on Food grade - Market size and forecast 2025-2030 ($ million)
Chart on Food grade - Year-over-year growth 2025-2030 (%)
Data Table on Food grade - Year-over-year growth 2025-2030 (%)

10.6 Market opportunity by Grade Type

Market opportunity by Grade Type ($ million)
Data Table on Market opportunity by Grade Type ($ million)

11. Customer Landscape

11.1 Customer landscape overview

Analysis of price sensitivity, lifecycle, customer purchase basket, adoption rates, and purchase criteria

12. Geographic Landscape

12.1 Geographic segmentation

Chart on Market share by geography 2025-2030 (%)
Data Table on Market share by geography 2025-2030 (%)

12.2 Geographic comparison

Chart on Geographic comparison
Data Table on Geographic comparison

12.3 APAC - Market size and forecast 2025-2030

Chart on APAC - Market size and forecast 2025-2030 ($ million)
Data Table on APAC - Market size and forecast 2025-2030 ($ million)
Chart on APAC - Year-over-year growth 2025-2030 (%)
Data Table on APAC - Year-over-year growth 2025-2030 (%)
Chart on Regional Comparison - APAC
Data Table on Regional Comparison - APAC

12.3.1 China - Market size and forecast 2025-2030

Chart on China - Market size and forecast 2025-2030 ($ million)
Data Table on China - Market size and forecast 2025-2030 ($ million)
Chart on China - Year-over-year growth 2025-2030 (%)
Data Table on China - Year-over-year growth 2025-2030 (%)

12.3.2 Japan - Market size and forecast 2025-2030

Chart on Japan - Market size and forecast 2025-2030 ($ million)
Data Table on Japan - Market size and forecast 2025-2030 ($ million)
Chart on Japan - Year-over-year growth 2025-2030 (%)
Data Table on Japan - Year-over-year growth 2025-2030 (%)

12.3.3 India - Market size and forecast 2025-2030

Chart on India - Market size and forecast 2025-2030 ($ million)
Data Table on India - Market size and forecast 2025-2030 ($ million)
Chart on India - Year-over-year growth 2025-2030 (%)
Data Table on India - Year-over-year growth 2025-2030 (%)

12.3.4 South Korea - Market size and forecast 2025-2030

Chart on South Korea - Market size and forecast 2025-2030 ($ million)
Data Table on South Korea - Market size and forecast 2025-2030 ($ million)
Chart on South Korea - Year-over-year growth 2025-2030 (%)
Data Table on South Korea - Year-over-year growth 2025-2030 (%)

12.3.5 Australia - Market size and forecast 2025-2030

Chart on Australia - Market size and forecast 2025-2030 ($ million)
Data Table on Australia - Market size and forecast 2025-2030 ($ million)
Chart on Australia - Year-over-year growth 2025-2030 (%)
Data Table on Australia - Year-over-year growth 2025-2030 (%)

12.3.6 Indonesia - Market size and forecast 2025-2030

Chart on Indonesia - Market size and forecast 2025-2030 ($ million)
Data Table on Indonesia - Market size and forecast 2025-2030 ($ million)
Chart on Indonesia - Year-over-year growth 2025-2030 (%)
Data Table on Indonesia - Year-over-year growth 2025-2030 (%)

12.4 Europe - Market size and forecast 2025-2030

Chart on Europe - Market size and forecast 2025-2030 ($ million)
Data Table on Europe - Market size and forecast 2025-2030 ($ million)
Chart on Europe - Year-over-year growth 2025-2030 (%)
Data Table on Europe - Year-over-year growth 2025-2030 (%)
Chart on Regional Comparison - Europe
Data Table on Regional Comparison - Europe

12.4.1 Germany - Market size and forecast 2025-2030

Chart on Germany - Market size and forecast 2025-2030 ($ million)
Data Table on Germany - Market size and forecast 2025-2030 ($ million)
Chart on Germany - Year-over-year growth 2025-2030 (%)
Data Table on Germany - Year-over-year growth 2025-2030 (%)

12.4.2 UK - Market size and forecast 2025-2030

Chart on UK - Market size and forecast 2025-2030 ($ million)
Data Table on UK - Market size and forecast 2025-2030 ($ million)
Chart on UK - Year-over-year growth 2025-2030 (%)
Data Table on UK - Year-over-year growth 2025-2030 (%)

12.4.3 France - Market size and forecast 2025-2030

Chart on France - Market size and forecast 2025-2030 ($ million)
Data Table on France - Market size and forecast 2025-2030 ($ million)
Chart on France - Year-over-year growth 2025-2030 (%)
Data Table on France - Year-over-year growth 2025-2030 (%)

12.4.4 Italy - Market size and forecast 2025-2030

Chart on Italy - Market size and forecast 2025-2030 ($ million)
Data Table on Italy - Market size and forecast 2025-2030 ($ million)
Chart on Italy - Year-over-year growth 2025-2030 (%)
Data Table on Italy - Year-over-year growth 2025-2030 (%)

12.4.5 Spain - Market size and forecast 2025-2030

Chart on Spain - Market size and forecast 2025-2030 ($ million)
Data Table on Spain - Market size and forecast 2025-2030 ($ million)
Chart on Spain - Year-over-year growth 2025-2030 (%)
Data Table on Spain - Year-over-year growth 2025-2030 (%)

12.4.6 The Netherlands - Market size and forecast 2025-2030

Chart on The Netherlands - Market size and forecast 2025-2030 ($ million)
Data Table on The Netherlands - Market size and forecast 2025-2030 ($ million)
Chart on The Netherlands - Year-over-year growth 2025-2030 (%)
Data Table on The Netherlands - Year-over-year growth 2025-2030 (%)

12.5 North America - Market size and forecast 2025-2030

Chart on North America - Market size and forecast 2025-2030 ($ million)
Data Table on North America - Market size and forecast 2025-2030 ($ million)
Chart on North America - Year-over-year growth 2025-2030 (%)
Data Table on North America - Year-over-year growth 2025-2030 (%)
Chart on Regional Comparison - North America
Data Table on Regional Comparison - North America

12.5.1 US - Market size and forecast 2025-2030

Chart on US - Market size and forecast 2025-2030 ($ million)
Data Table on US - Market size and forecast 2025-2030 ($ million)
Chart on US - Year-over-year growth 2025-2030 (%)
Data Table on US - Year-over-year growth 2025-2030 (%)

12.5.2 Canada - Market size and forecast 2025-2030

Chart on Canada - Market size and forecast 2025-2030 ($ million)
Data Table on Canada - Market size and forecast 2025-2030 ($ million)
Chart on Canada - Year-over-year growth 2025-2030 (%)
Data Table on Canada - Year-over-year growth 2025-2030 (%)

12.5.3 Mexico - Market size and forecast 2025-2030

Chart on Mexico - Market size and forecast 2025-2030 ($ million)
Data Table on Mexico - Market size and forecast 2025-2030 ($ million)
Chart on Mexico - Year-over-year growth 2025-2030 (%)
Data Table on Mexico - Year-over-year growth 2025-2030 (%)

12.6 Middle East and Africa - Market size and forecast 2025-2030

Chart on Middle East and Africa - Market size and forecast 2025-2030 ($ million)
Data Table on Middle East and Africa - Market size and forecast 2025-2030 ($ million)
Chart on Middle East and Africa - Year-over-year growth 2025-2030 (%)
Data Table on Middle East and Africa - Year-over-year growth 2025-2030 (%)
Chart on Regional Comparison - Middle East and Africa
Data Table on Regional Comparison - Middle East and Africa

12.6.1 Saudi Arabia - Market size and forecast 2025-2030

Chart on Saudi Arabia - Market size and forecast 2025-2030 ($ million)
Data Table on Saudi Arabia - Market size and forecast 2025-2030 ($ million)
Chart on Saudi Arabia - Year-over-year growth 2025-2030 (%)
Data Table on Saudi Arabia - Year-over-year growth 2025-2030 (%)

12.6.2 UAE - Market size and forecast 2025-2030

Chart on UAE - Market size and forecast 2025-2030 ($ million)
Data Table on UAE - Market size and forecast 2025-2030 ($ million)
Chart on UAE - Year-over-year growth 2025-2030 (%)
Data Table on UAE - Year-over-year growth 2025-2030 (%)

12.6.3 South Africa - Market size and forecast 2025-2030

Chart on South Africa - Market size and forecast 2025-2030 ($ million)
Data Table on South Africa - Market size and forecast 2025-2030 ($ million)
Chart on South Africa - Year-over-year growth 2025-2030 (%)
Data Table on South Africa - Year-over-year growth 2025-2030 (%)

12.6.4 Israel - Market size and forecast 2025-2030

Chart on Israel - Market size and forecast 2025-2030 ($ million)
Data Table on Israel - Market size and forecast 2025-2030 ($ million)
Chart on Israel - Year-over-year growth 2025-2030 (%)
Data Table on Israel - Year-over-year growth 2025-2030 (%)

12.6.5 Turkey - Market size and forecast 2025-2030

Chart on Turkey - Market size and forecast 2025-2030 ($ million)
Data Table on Turkey - Market size and forecast 2025-2030 ($ million)
Chart on Turkey - Year-over-year growth 2025-2030 (%)
Data Table on Turkey - Year-over-year growth 2025-2030 (%)

12.7 South America - Market size and forecast 2025-2030

Chart on South America - Market size and forecast 2025-2030 ($ million)
Data Table on South America - Market size and forecast 2025-2030 ($ million)
Chart on South America - Year-over-year growth 2025-2030 (%)
Data Table on South America - Year-over-year growth 2025-2030 (%)
Chart on Regional Comparison - South America
Data Table on Regional Comparison - South America

12.7.1 Brazil - Market size and forecast 2025-2030

Chart on Brazil - Market size and forecast 2025-2030 ($ million)
Data Table on Brazil - Market size and forecast 2025-2030 ($ million)
Chart on Brazil - Year-over-year growth 2025-2030 (%)
Data Table on Brazil - Year-over-year growth 2025-2030 (%)

12.7.2 Argentina - Market size and forecast 2025-2030

Chart on Argentina - Market size and forecast 2025-2030 ($ million)
Data Table on Argentina - Market size and forecast 2025-2030 ($ million)
Chart on Argentina - Year-over-year growth 2025-2030 (%)
Data Table on Argentina - Year-over-year growth 2025-2030 (%)

12.7.3 Chile - Market size and forecast 2025-2030

Chart on Chile - Market size and forecast 2025-2030 ($ million)
Data Table on Chile - Market size and forecast 2025-2030 ($ million)
Chart on Chile - Year-over-year growth 2025-2030 (%)
Data Table on Chile - Year-over-year growth 2025-2030 (%)

12.8 Market opportunity by geography

Market opportunity by geography ($ million)
Data Tables on Market opportunity by geography ($ million)

13. Drivers, Challenges, and Opportunity

13.1 Market drivers

Increasing demand for coatings in automotive sector
Advent of innovative chemical distribution channels
Growing demand for non-woven medical textiles

13.2 Market challenges

Harmful effects of chemicals on environment and human health
Volatile raw material prices used in production of isobutanol
Stringent regulations and policies related to chemicals

13.3 Impact of drivers and challenges

Impact of drivers and challenges in 2025 and 2030

13.4 Market opportunities

Rising rate of industrialization in emerging economies
Growing demand for bio-based chemicals
Rise in number of mergers and acquisitions

14. Competitive Landscape

14.1 Overview

14.2

Overview on criticality of inputs and factors of differentiation

14.3 Landscape disruption

Overview on factors of disruption

14.4 Industry risks

Impact of key risks on business

15. Competitive Analysis

15.1 Companies profiled

Companies covered

15.2 Company ranking index

15.3 Market positioning of companies

Matrix on companies position and classification

15.4 BASF SE

BASF SE - Overview
BASF SE - Business segments
BASF SE - Key news
BASF SE - Key offerings
BASF SE - Segment focus
SWOT

15.5 Bharat Petroleum Corp. Ltd.

Bharat Petroleum Corp. Ltd. - Overview
Bharat Petroleum Corp. Ltd. - Product / Service
Bharat Petroleum Corp. Ltd. - Key offerings
SWOT

15.6 BP Plc

BP Plc - Overview
BP Plc - Business segments
BP Plc - Key news
BP Plc - Key offerings
BP Plc - Segment focus
SWOT

15.7 Dow Chemical Co.

Dow Chemical Co. - Overview
Dow Chemical Co. - Business segments
Dow Chemical Co. - Key news
Dow Chemical Co. - Key offerings
Dow Chemical Co. - Segment focus
SWOT

15.8 Eastman Chemical Co.

Eastman Chemical Co. - Overview
Eastman Chemical Co. - Business segments
Eastman Chemical Co. - Key news
Eastman Chemical Co. - Key offerings
Eastman Chemical Co. - Segment focus
SWOT

15.9 Formosa Plastics Corp.

Formosa Plastics Corp. - Overview
Formosa Plastics Corp. - Business segments
Formosa Plastics Corp. - Key offerings
Formosa Plastics Corp. - Segment focus
SWOT

15.10 Hi Tech Chemicals Converters Pvt. Ltd.

Hi Tech Chemicals Converters Pvt. Ltd. - Overview
Hi Tech Chemicals Converters Pvt. Ltd. - Product / Service
Hi Tech Chemicals Converters Pvt. Ltd. - Key offerings
SWOT

15.11 INEOS Group Holdings S.A.

INEOS Group Holdings S.A. - Overview
INEOS Group Holdings S.A. - Product / Service
INEOS Group Holdings S.A. - Key news
INEOS Group Holdings S.A. - Key offerings
SWOT

15.12 Merck KGaA

Merck KGaA - Overview
Merck KGaA - Business segments
Merck KGaA - Key news
Merck KGaA - Key offerings
Merck KGaA - Segment focus
SWOT

15.13 Mitsubishi Chemical Corp.

Mitsubishi Chemical Corp. - Overview
Mitsubishi Chemical Corp. - Business segments
Mitsubishi Chemical Corp. - Key offerings
Mitsubishi Chemical Corp. - Segment focus
SWOT

15.14 Nan Ya Plastic Corp.

Nan Ya Plastic Corp. - Overview
Nan Ya Plastic Corp. - Business segments
Nan Ya Plastic Corp. - Key offerings
Nan Ya Plastic Corp. - Segment focus
SWOT

15.15 OQ SAOC

OQ SAOC - Overview
OQ SAOC - Product / Service
OQ SAOC - Key offerings
SWOT

15.16 Petroliam Nasional Berhad

Petroliam Nasional Berhad - Overview
Petroliam Nasional Berhad - Business segments
Petroliam Nasional Berhad - Key offerings
Petroliam Nasional Berhad - Segment focus
SWOT

15.17 Sasol Ltd.

Sasol Ltd. - Overview
Sasol Ltd. - Business segments
Sasol Ltd. - Key news
Sasol Ltd. - Key offerings
Sasol Ltd. - Segment focus
SWOT

15.18 SIBUR Holding PJSC

SIBUR Holding PJSC - Overview
SIBUR Holding PJSC - Product / Service
SIBUR Holding PJSC - Key offerings
SWOT

16. Appendix

16.1 Scope of the report

Market definition
Objectives
Notes and caveats

16.2 Inclusions and exclusions checklist

Inclusions checklist
Exclusions checklist

16.3 Currency conversion rates for US$

16.4 Research methodology

16.5 Data procurement

Information sources

16.6 Data validation

16.7 Validation techniques employed for market sizing

16.8 Data synthesis

16.9 360 degree market analysis

16.10 List of abbreviations

Research Methodology

Technavio presents a detailed picture of the market by way of study, synthesis, and summation of data from multiple sources. The analysts have presented the various facets of the market with a particular focus on identifying the key industry influencers. The data thus presented is comprehensive, reliable, and the result of extensive research, both primary and secondary.

INFORMATION SOURCES

Primary sources

  • Manufacturers and suppliers
  • Channel partners
  • Industry experts
  • Strategic decision makers

Secondary sources

  • Industry journals and periodicals
  • Government data
  • Financial reports of key industry players
  • Historical data
  • Press releases

DATA ANALYSIS

Data Synthesis

  • Collation of data
  • Estimation of key figures
  • Analysis of derived insights

Data Validation

  • Triangulation with data models
  • Reference against proprietary databases
  • Corroboration with industry experts

REPORT WRITING

Qualitative

  • Market drivers
  • Market challenges
  • Market trends
  • Five forces analysis

Quantitative

  • Market size and forecast
  • Market segmentation
  • Geographical insights
  • Competitive landscape

Interested in this report?

Get your sample now to see our research methodology and insights!

Download Now

Frequently Asked Questions

Isobutanol market growth will increase by USD 438.5 million during 2026-2030.

The Isobutanol market is expected to grow at a CAGR of 5.4% during 2026-2030.

Isobutanol market is segmented by Application (Solvent, Intermediate for glycol ethers and esters, Textile, Others) Product (Bio-based, Synthetic) Grade type (Industrial grade, Pharmaceutical grade, Food grade)

Andhra Petrochemicals Ltd., BASF SE, Bharat Petroleum Corp. Ltd., BP Plc, DhanLaxmi Organics and Chemicals, Dow Chemical Co., Eastman Chemical Co., Formosa Plastics Corp., Grupa Azoty SA, Hi Tech Chemicals Converters Pvt. Ltd., INEOS Group Holdings S.A., Merck KGaA, Mitsubishi Chemical Corp., Nan Ya Plastic Corp., Niksan Pharmaceutical, OQ SAOC, Petroliam Nasional Berhad, Sasol Ltd., SIBUR Holding PJSC, Somu Group of Companies Inc. are a few of the key vendors in the Isobutanol market.

North America will register the highest growth rate of 31.6% among the other regions. Therefore, the Isobutanol market in North America is expected to garner significant business opportunities for the vendors during the forecast period.

China, Japan, India, South Korea, Australia, Indonesia, Germany, UK, France, Italy, Spain, The Netherlands, US, Canada, Mexico, Saudi Arabia, UAE, South Africa, Israel, Turkey, Brazil, Argentina, Chile

  • Increasing demand for coatings in automotive sector is the driving factor this market.

The Isobutanol market vendors should focus on grabbing business opportunities from the Application segment as it accounted for the largest market share in the base year.