IT Asset Disposition (ITAD) Market Analysis, Size, and Forecast 2026-2030: North America (US, Canada, and Mexico), Europe (Germany, UK, and France), APAC (China, Japan, and India), South America (Brazil and Argentina), Middle East and Africa (Saudi Arabia, UAE, and South Africa), and Rest of World (ROW)

IT Asset Disposition (ITAD) Market Analysis, Size, and Forecast 2026-2030:
North America (US, Canada, and Mexico), Europe (Germany, UK, and France), APAC (China, Japan, and India), South America (Brazil and Argentina), Middle East and Africa (Saudi Arabia, UAE, and South Africa), and Rest of World (ROW)

Published: Mar 2026 301 Pages SKU: IRTNTR72011

Market Overview at a Glance

$18.66 B
Market Opportunity
11.7%
CAGR 2025 - 2030
35.8%
North America Growth
$14.94 B
Computers segment 2024

IT Asset Disposition (ITAD) Market Size 2026-2030

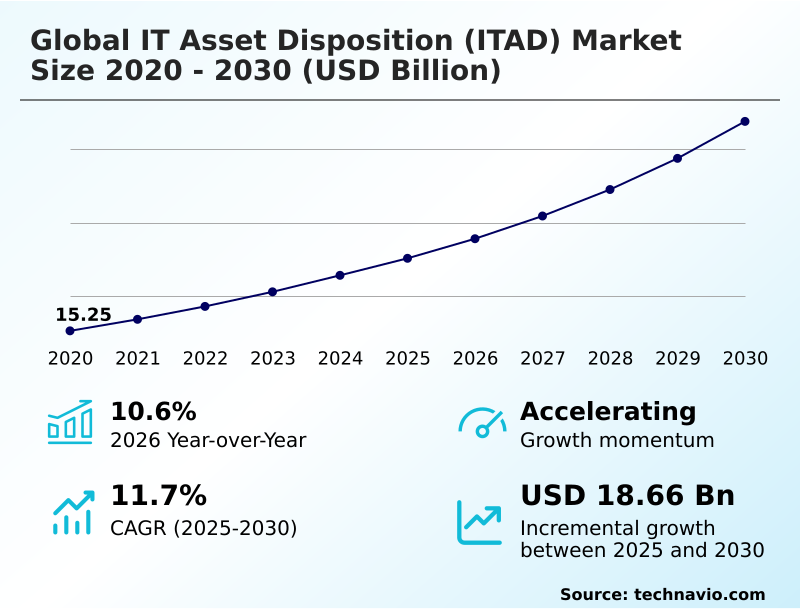
The it asset disposition (itad) market size is valued to increase by USD 18.66 billion, at a CAGR of 11.7% from 2025 to 2030. Heightened requirements for protect sensitive data information will drive the it asset disposition (itad) market.

Major Market Trends & Insights

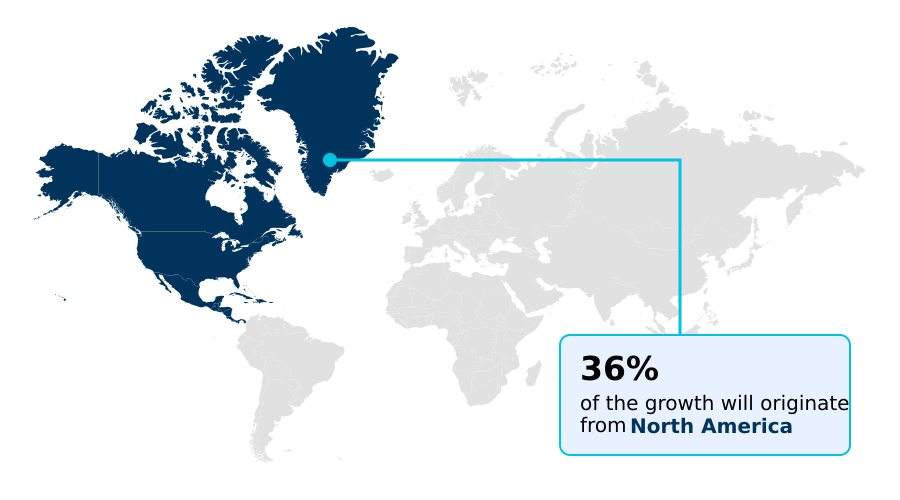
  • North America dominated the market and accounted for a 35.8% growth during the forecast period.
  • By Type - Computers segment was valued at USD 14.94 billion in 2024
  • By Industry Application - Large organizations segment accounted for the largest market revenue share in 2024

Market Size & Forecast

  • Market Opportunities: USD 28.55 billion
  • Market Future Opportunities: USD 18.66 billion
  • CAGR from 2025 to 2030 : 11.7%

Market Summary

  • The IT Asset Disposition (ITAD) Market is expanding as organizations prioritize data security, environmental compliance, and value recovery from retired technology. Driven by rapid hardware refresh cycles in data centers and enterprises, the demand for structured, auditable disposition processes is high.
  • Key trends include the integration of AI and automation to streamline asset tracking, grading, and data sanitization, which enhances efficiency and reporting accuracy. Sustainability mandates are also pushing companies toward circular economy models, where refurbishment and remarketing of assets are prioritized over simple recycling.
  • For instance, a global financial services firm decommissioning a data center would engage a certified ITAD partner to ensure every server and storage device undergoes verifiable data destruction before components are either resold or responsibly recycled. This approach not only mitigates the risk of a data breach but also aligns with corporate ESG goals and can generate significant revenue.
  • However, the industry faces challenges related to complex global logistics, evolving e-waste regulations, and a shortage of skilled technicians, which can impact service consistency and cost.

What will be the Size of the IT Asset Disposition (ITAD) Market during the forecast period?

Get Key Insights on Market Forecast (PDF) Request Free Sample

How is the IT Asset Disposition (ITAD) Market Segmented?

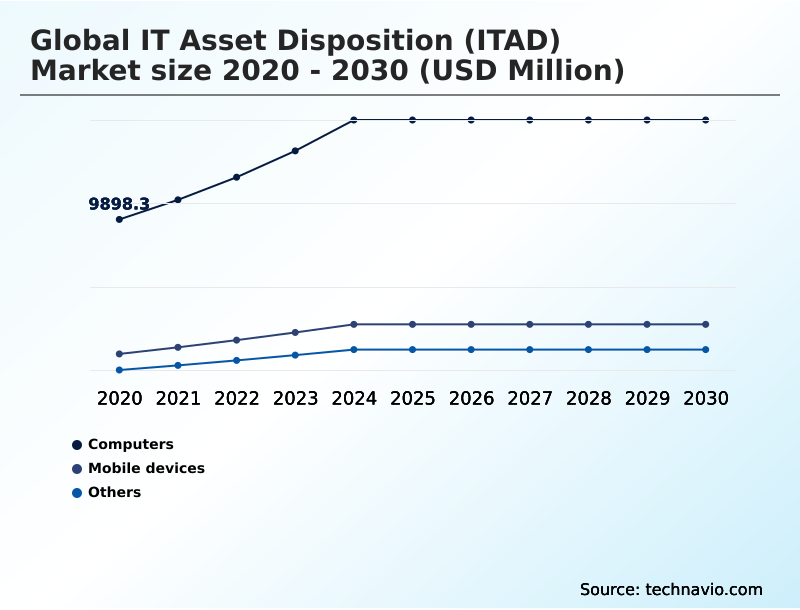
The it asset disposition (itad) industry research report provides comprehensive data (region-wise segment analysis), with forecasts and estimates in "USD million" for the period 2026-2030, as well as historical data from 2020-2024 for the following segments.

  • Type
    • Computers
    • Mobile devices
    • Others
  • Industry application
    • Large organizations
    • Small organizations
  • End-user
    • IT and telecom
    • BFSI
    • Healthcare
    • Government and public sector
    • Others
  • Geography
    • North America
      • US
      • Canada
      • Mexico
    • Europe
      • Germany
      • UK
      • France
    • APAC
      • China
      • Japan
      • India
    • South America
      • Brazil
      • Argentina
    • Middle East and Africa
      • Saudi Arabia
      • UAE
      • South Africa
    • Rest of World (ROW)

By Type Insights

The computers segment is estimated to witness significant growth during the forecast period.

The global IT Asset Disposition (ITAD) Market is segmented by type, industry application, end-user, and geography. By type, the market includes computers, mobile devices, and others. The industry application segment comprises large organizations and small organizations.

End-users are categorized into IT and telecom, BFSI, healthcare, government and public sector, and others. Geographically, the market is divided into North America, Europe, APAC, South America, and the Middle East and Africa.

North America holds a significant share, driven by stringent data security regulations and a mature secondary hardware market. Europe shows accelerated growth due to strong EU policies promoting a circular economy.

APAC is the fastest-growing region, fueled by rapid digital transformation and increasing e-waste regulations. The computers segment is transforming as refresh cycles shorten, prompting organizations to adopt comprehensive IT lifecycle management.

This involves maximizing IT asset value through hardware refurbishment and supporting circular economy models. As part of a robust IT asset end-of-life strategy, businesses now require compliant disposal processes for all end-of-life IT assets.

The adoption of modular PC designs has improved the potential for reuse by over 40%, extending the functional life of corporate computing equipment.

Request Free Sample

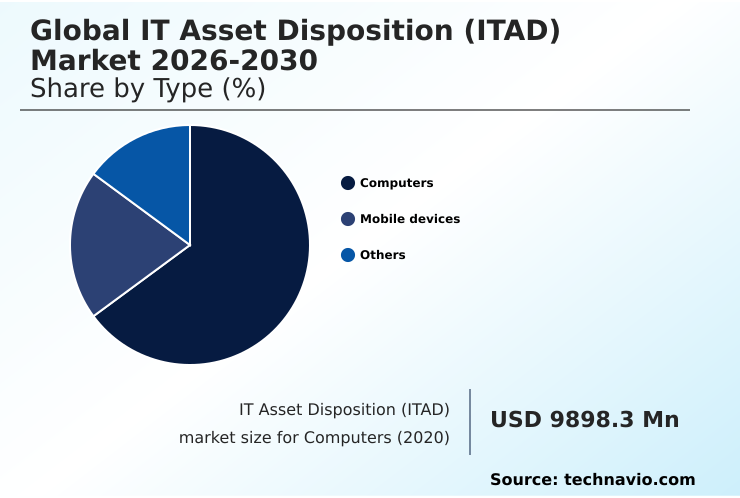
The Computers segment was valued at USD 14.94 billion in 2024 and showed a gradual increase during the forecast period.

Request Free Sample

Regional Analysis

North America is estimated to contribute 35.8% to the growth of the global market during the forecast period.Technavio’s analysts have elaborately explained the regional trends and drivers that shape the market during the forecast period.

See How IT Asset Disposition (ITAD) Market Demand is Rising in North America Request Free Sample

The market's geographic landscape is characterized by varied maturity levels. North America, contributing over 35% of incremental growth, leads with established electronics recycling standards and a strong focus on secure asset retirement.

Europe is rapidly advancing through stringent regulations that mandate comprehensive environmental social and governance (ESG) reporting and sustainable ITAD practices. The region's infrastructure for data center decommissioning is expanding quickly to meet hyperscale demand.

Meanwhile, APAC is the fastest-growing region, with its market expanding at a CAGR of 13.3%, driven by digitalization and new e-waste laws. The adoption of device-as-a-service (DaaS) reverse logistics models is also gaining traction globally, standardizing collection processes across regions.

Market Dynamics

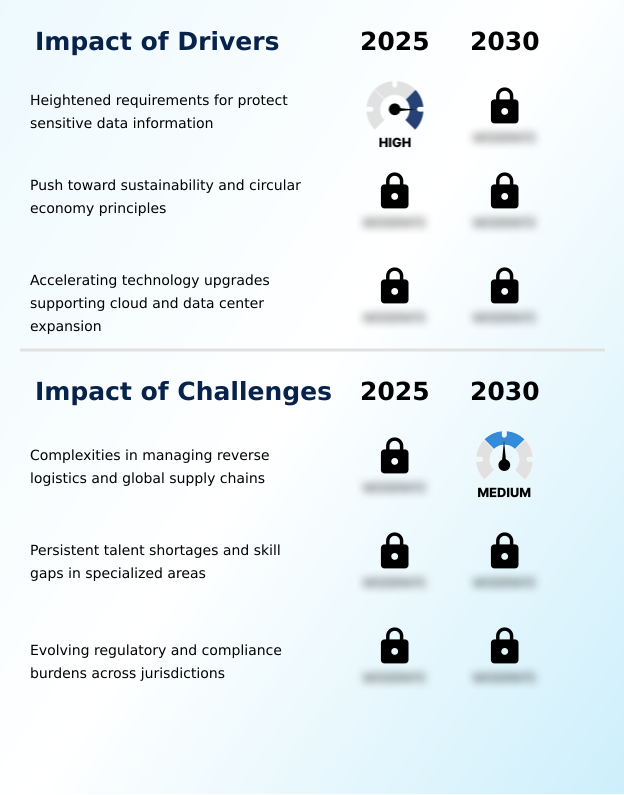
Our researchers analyzed the data with 2025 as the base year, along with the key drivers, trends, and challenges. A holistic analysis of drivers will help companies refine their marketing strategies to gain a competitive advantage.

  • As organizations navigate the complexities of modern IT infrastructure, a strategic approach to asset disposition is critical. Best practices for data center decommissioning are evolving, with an emphasis on minimizing operational disruption and ensuring the secure disposal of enterprise servers.
  • The ITAD process for financial institutions, for example, demands meticulous documentation and certified laptop data destruction services to comply with stringent data privacy regulations. Decisions regarding on-site data destruction versus off-site processing are often informed by a cost-benefit analysis of IT asset remarketing, which evaluates potential returns against security risks.
  • Selecting an R2v3 certified ITAD provider is a key step in mitigating the environmental impact of improper e-waste disposal and aligning with ESG reporting for end-of-life electronics. Managing lithium-ion batteries in ITAD and establishing a clear chain of custody for leased IT equipment are also crucial components of a compliant program.
  • By auditing an ITAD vendor's security protocols and understanding the circular economy impact on IT hardware, businesses can transform disposition from a cost center into a value-generating function. Firms that effectively manage reverse logistics for remote workforces often see a 20% improvement in asset recovery rates compared to those without a structured program.

What are the key market drivers leading to the rise in the adoption of IT Asset Disposition (ITAD) Industry?

  • Heightened requirements to protect sensitive data are a key driver of market growth.

  • Heightened requirements for data security and environmental stewardship are primary market drivers. The need for data breach prevention compels organizations to adopt rigorous data sanitization protocols, with a strong preference for certified data destruction services.
  • Over 80% of regulated industries now mandate NIST compliant data sanitization to meet regulatory compliance for electronics. Concurrently, corporate e-waste responsibility has become a critical component of sustainability goals, with companies integrating ESG metrics for IT into their public reporting.
  • This has led to a greater focus on professional e-waste recycling to ensure all retired assets are processed responsibly, supporting global ITAD compliance and minimizing environmental impact.

What are the market trends shaping the IT Asset Disposition (ITAD) Industry?

  • The integration of automation and artificial intelligence into disposition processes is an emerging market trend. This development enhances efficiency and accuracy in asset tracking and data sanitization.

  • The market is pivoting toward a circular IT economy, where value recovery and asset remarketing are central to operational strategy. Companies now prioritize ITAD vendor selection criteria that emphasize high financial returns from retired assets. Advanced software platforms are streamlining mobile device disposition and automating media sanitization, with some systems achieving a 98% reduction in manual verification errors.
  • These platforms provide auditable data destruction certification, ensuring secure data erasure meets stringent compliance standards. Furthermore, an increasing number of enterprises are exclusively engaging partners with R2v3 certified processes, which guarantee that refurbishment and resale activities are conducted transparently. This shift transforms disposition into a revenue-positive activity, with successful programs recovering up to 35% of the original hardware cost.

What challenges does the IT Asset Disposition (ITAD) Industry face during its growth?

  • The complexities of managing reverse logistics and global supply chains present a key challenge to industry growth.

  • The complexities of the ITAD reverse supply chain present significant operational challenges, particularly for organizations managing ITAD for data centers. Maintaining a verifiable chain of custody becomes difficult with globally dispersed assets, increasing the risk of data exposure. Managing transboundary e-waste movements adds another layer of difficulty, with evolving regulations increasing administrative costs by nearly 30%.
  • Furthermore, the specialized requirements for secure e-waste handling, such as lithium-ion battery recycling and on-site hard drive shredding, create logistical hurdles and necessitate specialized expertise. These factors are compounded by the need for frequent e-waste compliance auditing, which strains internal resources and requires robust tracking systems to ensure full accountability throughout the disposition process.

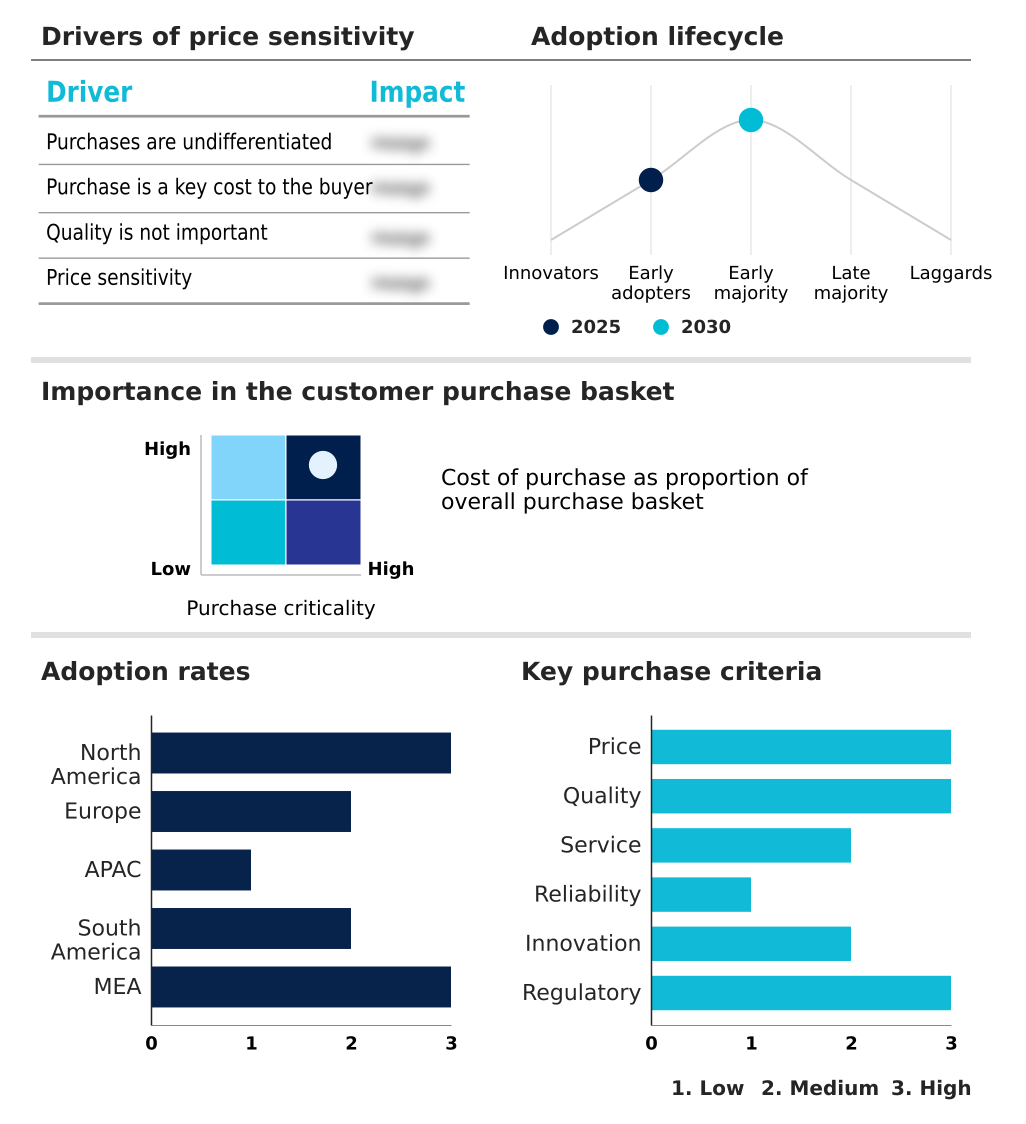
Exclusive Technavio Analysis on Customer Landscape

The it asset disposition (itad) market forecasting report includes the adoption lifecycle of the market, covering from the innovator’s stage to the laggard’s stage. It focuses on adoption rates in different regions based on penetration. Furthermore, the it asset disposition (itad) market report also includes key purchase criteria and drivers of price sensitivity to help companies evaluate and develop their market growth analysis strategies.

Customer Landscape of IT Asset Disposition (ITAD) Industry

Competitive Landscape

Companies are implementing various strategies, such as strategic alliances, it asset disposition (itad) market forecast, partnerships, mergers and acquisitions, geographical expansion, and product/service launches, to enhance their presence in the industry.

Apto Solutions Inc. - Delivering certified data destruction, value recovery, and comprehensive ITAD services through an integrated platform for full lifecycle management.

The industry research and growth report includes detailed analyses of the competitive landscape of the market and information about key companies, including:

  • Apto Solutions Inc.
  • Blancco Technology Plc
  • Computacenter plc
  • Dell Technologies Inc.
  • Dynamic Lifecycle Innovations
  • Electronic Recyclers Inc.
  • Full Circle Electronics
  • Hewlett Packard Entp Co.
  • IBM Corp.
  • Ingram Micro Inc.
  • Iron Mountain Inc.
  • LifeSpan International Inc.
  • MCPC Inc
  • Quantum Lifecycle Partners LP
  • Securis
  • Sims Lifecycle Services Inc.
  • SK Tes
  • TD SYNNEX Corp.

Qualitative and quantitative analysis of companies has been conducted to help clients understand the wider business environment as well as the strengths and weaknesses of key industry players. Data is qualitatively analyzed to categorize companies as pure play, category-focused, industry-focused, and diversified; it is quantitatively analyzed to categorize companies as dominant, leading, strong, tentative, and weak.

Recent Development and News in It asset disposition (itad) market

  • In September 2024, Iron Mountain acquired Wisetek to expand its IT asset disposition capabilities and enhance its secure data destruction and asset remarketing portfolio.
  • In January 2025, Sage Sustainable Electronics acquired Cascade Asset Management, creating one of the largest dedicated ITAD providers in the United States with enhanced service capacity.
  • In February 2025, the European Union passed the Circular Economy Act, which establishes new requirements for the disposal and recycling of mobile electronics across member states.
  • In April 2025, SK tes announced plans to open a new facility in Ireland specifically to support the disposition and decommissioning needs of local hyperscale data centers.

Dive into Technavio’s robust research methodology, blending expert interviews, extensive data synthesis, and validated models for unparalleled IT Asset Disposition (ITAD) Market insights. See full methodology.

Market Scope
Page number 301
Base year 2025
Historic period 2020-2024
Forecast period 2026-2030
Growth momentum & CAGR Accelerate at a CAGR of 11.7%
Market growth 2026-2030 USD 18663.4 million
Market structure Fragmented
YoY growth 2025-2026(%) 10.6%
Key countries US, Canada, Mexico, Germany, UK, France, Italy, Spain, The Netherlands, China, Japan, India, South Korea, Australia, Indonesia, Brazil, Argentina, Chile, Saudi Arabia, UAE, South Africa, Israel and Turkey
Competitive landscape Leading Companies, Market Positioning of Companies, Competitive Strategies, and Industry Risks

Request Free Sample

Research Analyst Overview

  • The IT Asset Disposition (ITAD) Market is defined by the critical need for secure and compliant handling of end-of-life IT assets. Core processes such as data sanitization and maintaining a verifiable chain of custody are non-negotiable for enterprises looking to mitigate data breach risks.
  • The push toward circular economy models has elevated the importance of value recovery through asset remarketing and hardware refurbishment. As technology evolves, specialized services like data center decommissioning and lithium-ion battery recycling are becoming increasingly vital.
  • Adherence to global ITAD compliance frameworks, including R2v3 certified processes and NIST compliant data sanitization standards, is now a primary factor in boardroom-level procurement decisions, directly influencing brand reputation and risk exposure. Firms utilizing certified data destruction methods report a near-100% success rate in preventing data recovery from retired media.
  • This focus on security, coupled with the need for transparent environmental social and governance (ESG) reporting, is driving consolidation toward providers that can offer a full suite of services, from secure data erasure and on-site hard drive shredding to compliant disposal and managing transboundary e-waste movements.

What are the Key Data Covered in this IT Asset Disposition (ITAD) Market Research and Growth Report?

  • What is the expected growth of the IT Asset Disposition (ITAD) Market between 2026 and 2030?

    • USD 18.66 billion, at a CAGR of 11.7%

  • What segmentation does the market report cover?

    • The report is segmented by Type (Computers, Mobile devices, and Others), Industry Application (Large organizations, and Small organizations), End-user (IT and telecom, BFSI, Healthcare, Government and public sector, and Others) and Geography (North America, Europe, APAC, South America, Middle East and Africa)

  • Which regions are analyzed in the report?

    • North America, Europe, APAC, South America and Middle East and Africa

  • What are the key growth drivers and market challenges?

    • Heightened requirements for protect sensitive data information, Complexities in managing reverse logistics and global supply chains

  • Who are the major players in the IT Asset Disposition (ITAD) Market?

    • Apto Solutions Inc., Blancco Technology Plc, Computacenter plc, Dell Technologies Inc., Dynamic Lifecycle Innovations, Electronic Recyclers Inc., Full Circle Electronics, Hewlett Packard Entp Co., IBM Corp., Ingram Micro Inc., Iron Mountain Inc., LifeSpan International Inc., MCPC Inc, Quantum Lifecycle Partners LP, Securis, Sims Lifecycle Services Inc., SK Tes and TD SYNNEX Corp.

Market Research Insights

  • Market dynamics are shaped by a strong focus on data breach prevention and sustainable ITAD practices. The adoption of certified data destruction services has become standard, with enterprises seeking verifiable data destruction certification to meet stringent regulatory compliance for electronics.
  • This has led to a shift in ITAD vendor selection criteria, where proof of secure e-waste handling and adherence to circular IT economy principles are paramount. Effective enterprise IT asset management now includes a clear IT asset end-of-life strategy that emphasizes maximizing IT asset value through remarketing, which can offset disposition costs by over 40%.
  • Concurrently, ESG metrics for IT are driving corporate e-waste responsibility, with leading firms achieving a 90% diversion rate from landfills through responsible electronics recycling programs.

We can help! Our analysts can customize this it asset disposition (itad) market research report to meet your requirements.

Get in touch

1. Executive Summary

1.1 Market overview

Executive Summary - Chart on Market Overview
Executive Summary - Data Table on Market Overview
Executive Summary - Chart on Global Market Characteristics
Executive Summary - Chart on Market by Geography
Executive Summary - Chart on Market Segmentation by Type
Executive Summary - Chart on Market Segmentation by Industry Application
Executive Summary - Chart on Market Segmentation by End-user
Executive Summary - Chart on Incremental Growth
Executive Summary - Data Table on Incremental Growth
Executive Summary - Chart on Company Market Positioning

2. Technavio Analysis

2.1 Analysis of price sensitivity, lifecycle, customer purchase basket, adoption rates, and purchase criteria

2.2 Criticality of inputs and Factors of differentiation

Chart on Overview on criticality of inputs and factors of differentiation

2.3 Factors of disruption

Chart on Overview on factors of disruption

2.4 Impact of drivers and challenges

Chart on Impact of drivers and challenges in 2025 and 2030

3. Market Landscape

3.1 Market ecosystem

Chart on Parent Market
Data Table on - Parent Market

3.2 Market characteristics

Chart on Market characteristics analysis

3.3 Value chain analysis

Chart on Value chain analysis

4. Market Sizing

4.1 Market definition

Data Table on Offerings of companies included in the market definition

4.2 Market segment analysis

Market segments

4.3 Market size 2025

4.4 Market outlook: Forecast for 2025-2030

Chart on Global - Market size and forecast 2025-2030 ($ million)
Data Table on Global - Market size and forecast 2025-2030 ($ million)
Chart on Global Market: Year-over-year growth 2025-2030 (%)
Data Table on Global Market: Year-over-year growth 2025-2030 (%)

5. Historic Market Size

5.1 Global IT Asset Disposition (ITAD) Market 2020 - 2024

Historic Market Size - Data Table on Global IT Asset Disposition (ITAD) Market 2020 - 2024 ($ million)

5.2 Type segment analysis 2020 - 2024

Historic Market Size - Type Segment 2020 - 2024 ($ million)

5.3 Industry Application segment analysis 2020 - 2024

Historic Market Size - Industry Application Segment 2020 - 2024 ($ million)

5.4 End-user segment analysis 2020 - 2024

Historic Market Size - End-user Segment 2020 - 2024 ($ million)

5.5 Geography segment analysis 2020 - 2024

Historic Market Size - Geography Segment 2020 - 2024 ($ million)

5.6 Country segment analysis 2020 - 2024

Historic Market Size - Country Segment 2020 - 2024 ($ million)

6. Qualitative Analysis

6.1 Impact of AI on Global IT Asset Disposition (ITAD) Market

7. Five Forces Analysis

7.1 Five forces summary

Five forces analysis - Comparison between 2025 and 2030

7.2 Bargaining power of buyers

Bargaining power of buyers - Impact of key factors 2025 and 2030

7.3 Bargaining power of suppliers

Bargaining power of suppliers - Impact of key factors in 2025 and 2030

7.4 Threat of new entrants

Threat of new entrants - Impact of key factors in 2025 and 2030

7.5 Threat of substitutes

Threat of substitutes - Impact of key factors in 2025 and 2030

7.6 Threat of rivalry

Threat of rivalry - Impact of key factors in 2025 and 2030

7.7 Market condition

Chart on Market condition - Five forces 2025 and 2030

8. Market Segmentation by Type

8.1 Market segments

Chart on Type - Market share 2025-2030 (%)
Data Table on Type - Market share 2025-2030 (%)

8.2 Comparison by Type

Chart on Comparison by Type
Data Table on Comparison by Type

8.3 Computers - Market size and forecast 2025-2030

Chart on Computers - Market size and forecast 2025-2030 ($ million)
Data Table on Computers - Market size and forecast 2025-2030 ($ million)
Chart on Computers - Year-over-year growth 2025-2030 (%)
Data Table on Computers - Year-over-year growth 2025-2030 (%)

8.4 Mobile devices - Market size and forecast 2025-2030

Chart on Mobile devices - Market size and forecast 2025-2030 ($ million)
Data Table on Mobile devices - Market size and forecast 2025-2030 ($ million)
Chart on Mobile devices - Year-over-year growth 2025-2030 (%)
Data Table on Mobile devices - Year-over-year growth 2025-2030 (%)

8.5 Others - Market size and forecast 2025-2030

Chart on Others - Market size and forecast 2025-2030 ($ million)
Data Table on Others - Market size and forecast 2025-2030 ($ million)
Chart on Others - Year-over-year growth 2025-2030 (%)
Data Table on Others - Year-over-year growth 2025-2030 (%)

8.6 Market opportunity by Type

Market opportunity by Type ($ million)
Data Table on Market opportunity by Type ($ million)

9. Market Segmentation by Industry Application

9.1 Market segments

Chart on Industry Application - Market share 2025-2030 (%)
Data Table on Industry Application - Market share 2025-2030 (%)

9.2 Comparison by Industry Application

Chart on Comparison by Industry Application
Data Table on Comparison by Industry Application

9.3 Large organizations - Market size and forecast 2025-2030

Chart on Large organizations - Market size and forecast 2025-2030 ($ million)
Data Table on Large organizations - Market size and forecast 2025-2030 ($ million)
Chart on Large organizations - Year-over-year growth 2025-2030 (%)
Data Table on Large organizations - Year-over-year growth 2025-2030 (%)

9.4 Small organizations - Market size and forecast 2025-2030

Chart on Small organizations - Market size and forecast 2025-2030 ($ million)
Data Table on Small organizations - Market size and forecast 2025-2030 ($ million)
Chart on Small organizations - Year-over-year growth 2025-2030 (%)
Data Table on Small organizations - Year-over-year growth 2025-2030 (%)

9.5 Market opportunity by Industry Application

Market opportunity by Industry Application ($ million)
Data Table on Market opportunity by Industry Application ($ million)

10. Market Segmentation by End-user

10.1 Market segments

Chart on End-user - Market share 2025-2030 (%)
Data Table on End-user - Market share 2025-2030 (%)

10.2 Comparison by End-user

Chart on Comparison by End-user
Data Table on Comparison by End-user

10.3 IT and telecom - Market size and forecast 2025-2030

Chart on IT and telecom - Market size and forecast 2025-2030 ($ million)
Data Table on IT and telecom - Market size and forecast 2025-2030 ($ million)
Chart on IT and telecom - Year-over-year growth 2025-2030 (%)
Data Table on IT and telecom - Year-over-year growth 2025-2030 (%)

10.4 BFSI - Market size and forecast 2025-2030

Chart on BFSI - Market size and forecast 2025-2030 ($ million)
Data Table on BFSI - Market size and forecast 2025-2030 ($ million)
Chart on BFSI - Year-over-year growth 2025-2030 (%)
Data Table on BFSI - Year-over-year growth 2025-2030 (%)

10.5 Healthcare - Market size and forecast 2025-2030

Chart on Healthcare - Market size and forecast 2025-2030 ($ million)
Data Table on Healthcare - Market size and forecast 2025-2030 ($ million)
Chart on Healthcare - Year-over-year growth 2025-2030 (%)
Data Table on Healthcare - Year-over-year growth 2025-2030 (%)

10.6 Government and public sector - Market size and forecast 2025-2030

Chart on Government and public sector - Market size and forecast 2025-2030 ($ million)
Data Table on Government and public sector - Market size and forecast 2025-2030 ($ million)
Chart on Government and public sector - Year-over-year growth 2025-2030 (%)
Data Table on Government and public sector - Year-over-year growth 2025-2030 (%)

10.7 Others - Market size and forecast 2025-2030

Chart on Others - Market size and forecast 2025-2030 ($ million)
Data Table on Others - Market size and forecast 2025-2030 ($ million)
Chart on Others - Year-over-year growth 2025-2030 (%)
Data Table on Others - Year-over-year growth 2025-2030 (%)

10.8 Market opportunity by End-user

Market opportunity by End-user ($ million)
Data Table on Market opportunity by End-user ($ million)

11. Customer Landscape

11.1 Customer landscape overview

Analysis of price sensitivity, lifecycle, customer purchase basket, adoption rates, and purchase criteria

12. Geographic Landscape

12.1 Geographic segmentation

Chart on Market share by geography 2025-2030 (%)
Data Table on Market share by geography 2025-2030 (%)

12.2 Geographic comparison

Chart on Geographic comparison
Data Table on Geographic comparison

12.3 North America - Market size and forecast 2025-2030

Chart on North America - Market size and forecast 2025-2030 ($ million)
Data Table on North America - Market size and forecast 2025-2030 ($ million)
Chart on North America - Year-over-year growth 2025-2030 (%)
Data Table on North America - Year-over-year growth 2025-2030 (%)
Chart on Regional Comparison - North America
Data Table on Regional Comparison - North America

12.3.1 US - Market size and forecast 2025-2030

Chart on US - Market size and forecast 2025-2030 ($ million)
Data Table on US - Market size and forecast 2025-2030 ($ million)
Chart on US - Year-over-year growth 2025-2030 (%)
Data Table on US - Year-over-year growth 2025-2030 (%)

12.3.2 Canada - Market size and forecast 2025-2030

Chart on Canada - Market size and forecast 2025-2030 ($ million)
Data Table on Canada - Market size and forecast 2025-2030 ($ million)
Chart on Canada - Year-over-year growth 2025-2030 (%)
Data Table on Canada - Year-over-year growth 2025-2030 (%)

12.3.3 Mexico - Market size and forecast 2025-2030

Chart on Mexico - Market size and forecast 2025-2030 ($ million)
Data Table on Mexico - Market size and forecast 2025-2030 ($ million)
Chart on Mexico - Year-over-year growth 2025-2030 (%)
Data Table on Mexico - Year-over-year growth 2025-2030 (%)

12.4 Europe - Market size and forecast 2025-2030

Chart on Europe - Market size and forecast 2025-2030 ($ million)
Data Table on Europe - Market size and forecast 2025-2030 ($ million)
Chart on Europe - Year-over-year growth 2025-2030 (%)
Data Table on Europe - Year-over-year growth 2025-2030 (%)
Chart on Regional Comparison - Europe
Data Table on Regional Comparison - Europe

12.4.1 Germany - Market size and forecast 2025-2030

Chart on Germany - Market size and forecast 2025-2030 ($ million)
Data Table on Germany - Market size and forecast 2025-2030 ($ million)
Chart on Germany - Year-over-year growth 2025-2030 (%)
Data Table on Germany - Year-over-year growth 2025-2030 (%)

12.4.2 UK - Market size and forecast 2025-2030

Chart on UK - Market size and forecast 2025-2030 ($ million)
Data Table on UK - Market size and forecast 2025-2030 ($ million)
Chart on UK - Year-over-year growth 2025-2030 (%)
Data Table on UK - Year-over-year growth 2025-2030 (%)

12.4.3 France - Market size and forecast 2025-2030

Chart on France - Market size and forecast 2025-2030 ($ million)
Data Table on France - Market size and forecast 2025-2030 ($ million)
Chart on France - Year-over-year growth 2025-2030 (%)
Data Table on France - Year-over-year growth 2025-2030 (%)

12.4.4 Italy - Market size and forecast 2025-2030

Chart on Italy - Market size and forecast 2025-2030 ($ million)
Data Table on Italy - Market size and forecast 2025-2030 ($ million)
Chart on Italy - Year-over-year growth 2025-2030 (%)
Data Table on Italy - Year-over-year growth 2025-2030 (%)

12.4.5 Spain - Market size and forecast 2025-2030

Chart on Spain - Market size and forecast 2025-2030 ($ million)
Data Table on Spain - Market size and forecast 2025-2030 ($ million)
Chart on Spain - Year-over-year growth 2025-2030 (%)
Data Table on Spain - Year-over-year growth 2025-2030 (%)

12.4.6 The Netherlands - Market size and forecast 2025-2030

Chart on The Netherlands - Market size and forecast 2025-2030 ($ million)
Data Table on The Netherlands - Market size and forecast 2025-2030 ($ million)
Chart on The Netherlands - Year-over-year growth 2025-2030 (%)
Data Table on The Netherlands - Year-over-year growth 2025-2030 (%)

12.5 APAC - Market size and forecast 2025-2030

Chart on APAC - Market size and forecast 2025-2030 ($ million)
Data Table on APAC - Market size and forecast 2025-2030 ($ million)
Chart on APAC - Year-over-year growth 2025-2030 (%)
Data Table on APAC - Year-over-year growth 2025-2030 (%)
Chart on Regional Comparison - APAC
Data Table on Regional Comparison - APAC

12.5.1 China - Market size and forecast 2025-2030

Chart on China - Market size and forecast 2025-2030 ($ million)
Data Table on China - Market size and forecast 2025-2030 ($ million)
Chart on China - Year-over-year growth 2025-2030 (%)
Data Table on China - Year-over-year growth 2025-2030 (%)

12.5.2 Japan - Market size and forecast 2025-2030

Chart on Japan - Market size and forecast 2025-2030 ($ million)
Data Table on Japan - Market size and forecast 2025-2030 ($ million)
Chart on Japan - Year-over-year growth 2025-2030 (%)
Data Table on Japan - Year-over-year growth 2025-2030 (%)

12.5.3 India - Market size and forecast 2025-2030

Chart on India - Market size and forecast 2025-2030 ($ million)
Data Table on India - Market size and forecast 2025-2030 ($ million)
Chart on India - Year-over-year growth 2025-2030 (%)
Data Table on India - Year-over-year growth 2025-2030 (%)

12.5.4 South Korea - Market size and forecast 2025-2030

Chart on South Korea - Market size and forecast 2025-2030 ($ million)
Data Table on South Korea - Market size and forecast 2025-2030 ($ million)
Chart on South Korea - Year-over-year growth 2025-2030 (%)
Data Table on South Korea - Year-over-year growth 2025-2030 (%)

12.5.5 Australia - Market size and forecast 2025-2030

Chart on Australia - Market size and forecast 2025-2030 ($ million)
Data Table on Australia - Market size and forecast 2025-2030 ($ million)
Chart on Australia - Year-over-year growth 2025-2030 (%)
Data Table on Australia - Year-over-year growth 2025-2030 (%)

12.5.6 Indonesia - Market size and forecast 2025-2030

Chart on Indonesia - Market size and forecast 2025-2030 ($ million)
Data Table on Indonesia - Market size and forecast 2025-2030 ($ million)
Chart on Indonesia - Year-over-year growth 2025-2030 (%)
Data Table on Indonesia - Year-over-year growth 2025-2030 (%)

12.6 South America - Market size and forecast 2025-2030

Chart on South America - Market size and forecast 2025-2030 ($ million)
Data Table on South America - Market size and forecast 2025-2030 ($ million)
Chart on South America - Year-over-year growth 2025-2030 (%)
Data Table on South America - Year-over-year growth 2025-2030 (%)
Chart on Regional Comparison - South America
Data Table on Regional Comparison - South America

12.6.1 Brazil - Market size and forecast 2025-2030

Chart on Brazil - Market size and forecast 2025-2030 ($ million)
Data Table on Brazil - Market size and forecast 2025-2030 ($ million)
Chart on Brazil - Year-over-year growth 2025-2030 (%)
Data Table on Brazil - Year-over-year growth 2025-2030 (%)

12.6.2 Argentina - Market size and forecast 2025-2030

Chart on Argentina - Market size and forecast 2025-2030 ($ million)
Data Table on Argentina - Market size and forecast 2025-2030 ($ million)
Chart on Argentina - Year-over-year growth 2025-2030 (%)
Data Table on Argentina - Year-over-year growth 2025-2030 (%)

12.6.3 Chile - Market size and forecast 2025-2030

Chart on Chile - Market size and forecast 2025-2030 ($ million)
Data Table on Chile - Market size and forecast 2025-2030 ($ million)
Chart on Chile - Year-over-year growth 2025-2030 (%)
Data Table on Chile - Year-over-year growth 2025-2030 (%)

12.7 Middle East and Africa - Market size and forecast 2025-2030

Chart on Middle East and Africa - Market size and forecast 2025-2030 ($ million)
Data Table on Middle East and Africa - Market size and forecast 2025-2030 ($ million)
Chart on Middle East and Africa - Year-over-year growth 2025-2030 (%)
Data Table on Middle East and Africa - Year-over-year growth 2025-2030 (%)
Chart on Regional Comparison - Middle East and Africa
Data Table on Regional Comparison - Middle East and Africa

12.7.1 Saudi Arabia - Market size and forecast 2025-2030

Chart on Saudi Arabia - Market size and forecast 2025-2030 ($ million)
Data Table on Saudi Arabia - Market size and forecast 2025-2030 ($ million)
Chart on Saudi Arabia - Year-over-year growth 2025-2030 (%)
Data Table on Saudi Arabia - Year-over-year growth 2025-2030 (%)

12.7.2 UAE - Market size and forecast 2025-2030

Chart on UAE - Market size and forecast 2025-2030 ($ million)
Data Table on UAE - Market size and forecast 2025-2030 ($ million)
Chart on UAE - Year-over-year growth 2025-2030 (%)
Data Table on UAE - Year-over-year growth 2025-2030 (%)

12.7.3 South Africa - Market size and forecast 2025-2030

Chart on South Africa - Market size and forecast 2025-2030 ($ million)
Data Table on South Africa - Market size and forecast 2025-2030 ($ million)
Chart on South Africa - Year-over-year growth 2025-2030 (%)
Data Table on South Africa - Year-over-year growth 2025-2030 (%)

12.7.4 Israel - Market size and forecast 2025-2030

Chart on Israel - Market size and forecast 2025-2030 ($ million)
Data Table on Israel - Market size and forecast 2025-2030 ($ million)
Chart on Israel - Year-over-year growth 2025-2030 (%)
Data Table on Israel - Year-over-year growth 2025-2030 (%)

12.7.5 Turkey - Market size and forecast 2025-2030

Chart on Turkey - Market size and forecast 2025-2030 ($ million)
Data Table on Turkey - Market size and forecast 2025-2030 ($ million)
Chart on Turkey - Year-over-year growth 2025-2030 (%)
Data Table on Turkey - Year-over-year growth 2025-2030 (%)

12.8 Market opportunity by geography

Market opportunity by geography ($ million)
Data Tables on Market opportunity by geography ($ million)

13. Drivers, Challenges, and Opportunity

13.1 Market drivers

Heightened requirements for protect sensitive data information
Push toward sustainability and circular economy principles
Accelerating technology upgrades supporting cloud and data center expansion

13.2 Market challenges

Complexities in managing reverse logistics and global supply chains
Persistent talent shortages and skill gaps in specialized areas
Evolving regulatory and compliance burdens across jurisdictions

13.3 Impact of drivers and challenges

Impact of drivers and challenges in 2025 and 2030

13.4 Market opportunities

Integration of automation and AI in disposition processes
Regional acceleration of infrastructure development
Growing emphasis on value recovery through remarketing and refurbishment

14. Competitive Landscape

14.1 Overview

14.2

Overview on criticality of inputs and factors of differentiation

14.3 Landscape disruption

Overview on factors of disruption

14.4 Industry risks

Impact of key risks on business

15. Competitive Analysis

15.1 Companies profiled

Companies covered

15.2 Company ranking index

15.3 Market positioning of companies

Matrix on companies position and classification

15.4 Apto Solutions Inc.

Apto Solutions Inc. - Overview
Apto Solutions Inc. - Product / Service
Apto Solutions Inc. - Key offerings
SWOT

15.5 Blancco Technology Plc

Blancco Technology Plc - Overview
Blancco Technology Plc - Product / Service
Blancco Technology Plc - Key offerings
SWOT

15.6 Computacenter plc

Computacenter plc - Overview
Computacenter plc - Product / Service
Computacenter plc - Key offerings
SWOT

15.7 Dell Technologies Inc.

Dell Technologies Inc. - Overview
Dell Technologies Inc. - Business segments
Dell Technologies Inc. - Key news
Dell Technologies Inc. - Key offerings
Dell Technologies Inc. - Segment focus
SWOT

15.8 Dynamic Lifecycle Innovations

Dynamic Lifecycle Innovations - Overview
Dynamic Lifecycle Innovations - Product / Service
Dynamic Lifecycle Innovations - Key offerings
SWOT

15.9 Electronic Recyclers Inc.

Electronic Recyclers Inc. - Overview
Electronic Recyclers Inc. - Product / Service
Electronic Recyclers Inc. - Key offerings
SWOT

15.10 Full Circle Electronics

Full Circle Electronics - Overview
Full Circle Electronics - Product / Service
Full Circle Electronics - Key offerings
SWOT

15.11 Hewlett Packard Entp Co.

Hewlett Packard Entp Co. - Overview
Hewlett Packard Entp Co. - Business segments
Hewlett Packard Entp Co. - Key news
Hewlett Packard Entp Co. - Key offerings
Hewlett Packard Entp Co. - Segment focus
SWOT

15.12 IBM Corp.

IBM Corp. - Overview
IBM Corp. - Business segments
IBM Corp. - Key news
IBM Corp. - Key offerings
IBM Corp. - Segment focus
SWOT

15.13 Ingram Micro Inc.

Ingram Micro Inc. - Overview
Ingram Micro Inc. - Product / Service
Ingram Micro Inc. - Key offerings
SWOT

15.14 Iron Mountain Inc.

Iron Mountain Inc. - Overview
Iron Mountain Inc. - Business segments
Iron Mountain Inc. - Key news
Iron Mountain Inc. - Key offerings
Iron Mountain Inc. - Segment focus
SWOT

15.15 LifeSpan International Inc.

LifeSpan International Inc. - Overview
LifeSpan International Inc. - Product / Service
LifeSpan International Inc. - Key offerings
SWOT

15.16 MCPC Inc

MCPC Inc - Overview
MCPC Inc - Product / Service
MCPC Inc - Key offerings
SWOT

15.17 Quantum Lifecycle Partners LP

Quantum Lifecycle Partners LP - Overview
Quantum Lifecycle Partners LP - Product / Service
Quantum Lifecycle Partners LP - Key offerings
SWOT

15.18 Securis

Securis - Overview
Securis - Product / Service
Securis - Key offerings
SWOT

16. Appendix

16.1 Scope of the report

Market definition
Objectives
Notes and caveats

16.2 Inclusions and exclusions checklist

Inclusions checklist
Exclusions checklist

16.3 Currency conversion rates for US$

16.4 Research methodology

16.5 Data procurement

Information sources

16.6 Data validation

16.7 Validation techniques employed for market sizing

16.8 Data synthesis

16.9 360 degree market analysis

16.10 List of abbreviations

Research Methodology

Technavio presents a detailed picture of the market by way of study, synthesis, and summation of data from multiple sources. The analysts have presented the various facets of the market with a particular focus on identifying the key industry influencers. The data thus presented is comprehensive, reliable, and the result of extensive research, both primary and secondary.

INFORMATION SOURCES

Primary sources

  • Manufacturers and suppliers
  • Channel partners
  • Industry experts
  • Strategic decision makers

Secondary sources

  • Industry journals and periodicals
  • Government data
  • Financial reports of key industry players
  • Historical data
  • Press releases

DATA ANALYSIS

Data Synthesis

  • Collation of data
  • Estimation of key figures
  • Analysis of derived insights

Data Validation

  • Triangulation with data models
  • Reference against proprietary databases
  • Corroboration with industry experts

REPORT WRITING

Qualitative

  • Market drivers
  • Market challenges
  • Market trends
  • Five forces analysis

Quantitative

  • Market size and forecast
  • Market segmentation
  • Geographical insights
  • Competitive landscape

Interested in this report?

Get your sample now to see our research methodology and insights!

Download Now

Frequently Asked Questions

IT Asset Disposition (ITAD) market growth will increase by USD 18663.4 million during 2026-2030.

The IT Asset Disposition (ITAD) market is expected to grow at a CAGR of 11.7% during 2026-2030.

IT Asset Disposition (ITAD) market is segmented by Type (Computers, Mobile devices, Others) Industry application (Large organizations, Small organizations) End-user (IT and telecom, BFSI, Healthcare, Government and public sector, Others)

Apto Solutions Inc., Blancco Technology Plc, Computacenter plc, Dell Technologies Inc., Dynamic Lifecycle Innovations, Electronic Recyclers Inc., Full Circle Electronics, Hewlett Packard Entp Co., IBM Corp., Ingram Micro Inc., Iron Mountain Inc., LifeSpan International Inc., MCPC Inc, Quantum Lifecycle Partners LP, Securis, Sims Lifecycle Services Inc., SK Tes, TD SYNNEX Corp. are a few of the key vendors in the IT Asset Disposition (ITAD) market.

North America will register the highest growth rate of 35.8% among the other regions. Therefore, the IT Asset Disposition (ITAD) market in North America is expected to garner significant business opportunities for the vendors during the forecast period.

US, Canada, Mexico, Germany, UK, France, Italy, Spain, The Netherlands, China, Japan, India, South Korea, Australia, Indonesia, Brazil, Argentina, Chile, Saudi Arabia, UAE, South Africa, Israel, Turkey

  • Heightened requirements for protect sensitive data information is the driving factor this market.

The IT Asset Disposition (ITAD) market vendors should focus on grabbing business opportunities from the Type segment as it accounted for the largest market share in the base year.
RIA - Research AI Assistant
Ask RIA