
IT Professional Services Market Size 2026-2030
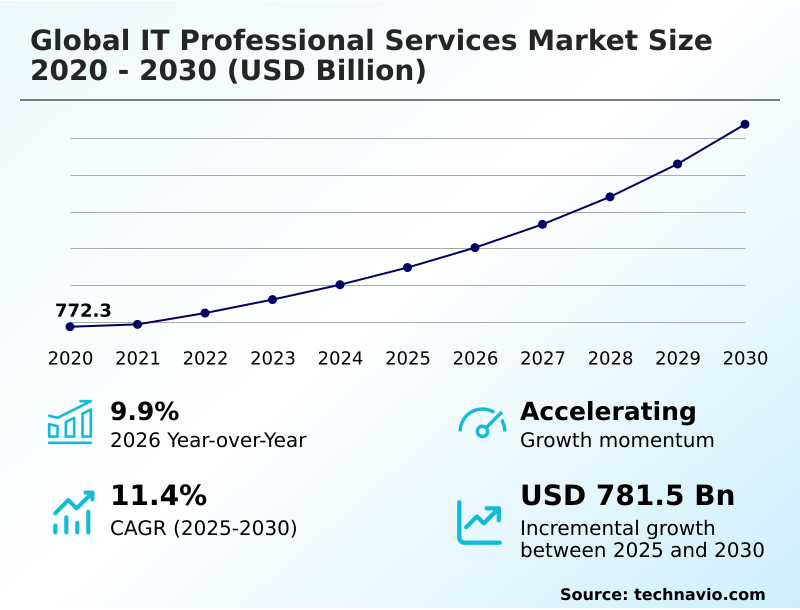
The it professional services market size is valued to increase by USD 781.5 billion, at a CAGR of 11.4% from 2025 to 2030. Growing digital transformation in IT sector will drive the it professional services market.
Major Market Trends & Insights
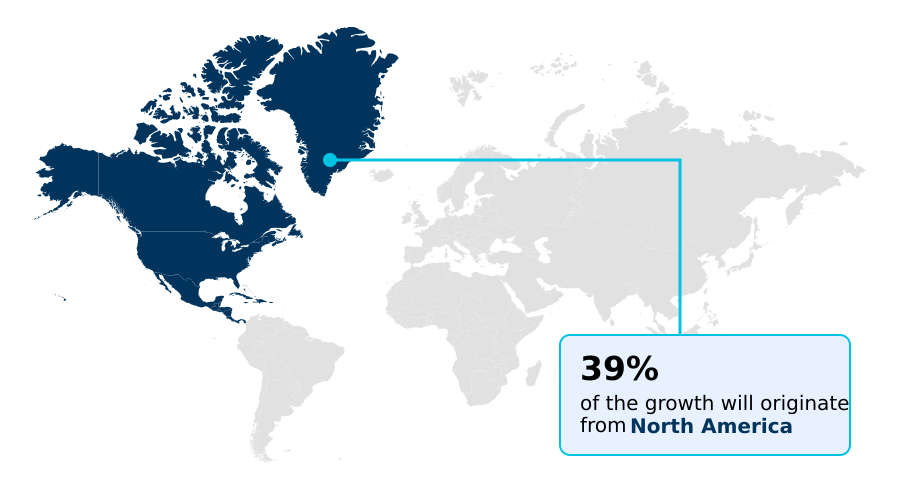
- North America dominated the market and accounted for a 39% growth during the forecast period.
- By Type - Project-oriented services segment was valued at USD 364.2 billion in 2024
- By End-user - Large enterprises segment accounted for the largest market revenue share in 2024
Market Size & Forecast
- Market Opportunities: USD 1104.4 billion
- Market Future Opportunities: USD 781.5 billion
- CAGR from 2025 to 2030 : 11.4%
Market Summary
- The IT professional services market is undergoing a significant evolution, driven by the need for advanced technical expertise in areas like high performance computing and zero trust architecture. Businesses are moving beyond simple outsourcing to form strategic partnerships for complex initiatives such as legacy system modernization and multi cloud management.
- This shift is fueled by the demand for greater operational agility and data-driven decision making. For instance, a manufacturing firm might engage professional services to implement digital twin technology and real time data processing, integrating its operational technology with enterprise resource planning systems for a unified view of its supply chain.
- This involves not only systems integration but also deep consulting on it governance frameworks and change management consulting to ensure user adoption. As challenges like data sovereignty compliance and the need for ai ethics consulting grow, specialized providers offering bespoke solutions for technical debt reduction and application portfolio modernization are becoming indispensable for maintaining a competitive edge.
What will be the Size of the IT Professional Services Market during the forecast period?
Get Key Insights on Market Forecast (PDF) Get Free Sample
How is the IT Professional Services Market Segmented?
The it professional services industry research report provides comprehensive data (region-wise segment analysis), with forecasts and estimates in "USD billion" for the period 2026-2030, as well as historical data from 2020-2024 for the following segments.
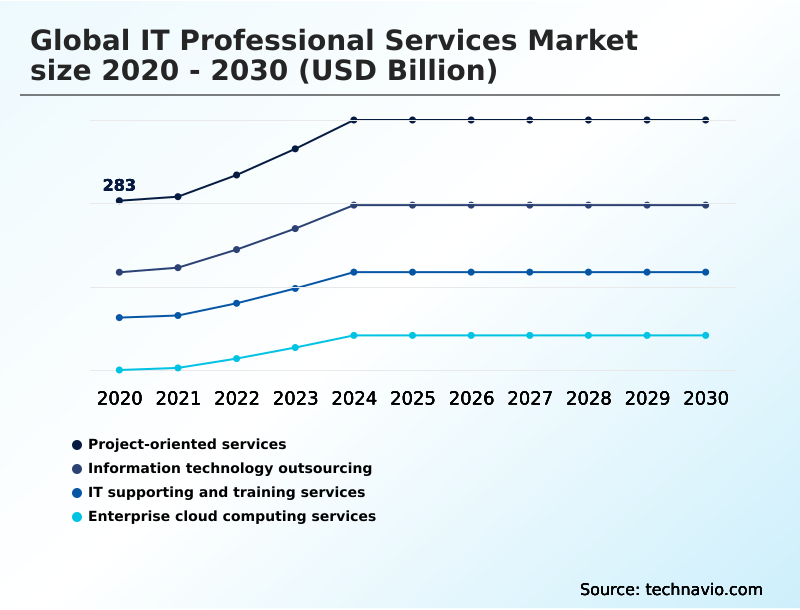
- Type
- Project-oriented services
- Information technology outsourcing
- IT supporting and training services
- Enterprise cloud computing services
- End-user
- Large enterprises
- Small and medium enterprises
- Deployment
- Cloud
- On-premises
- Geography
- North America
- US
- Canada
- Mexico
- Europe
- UK
- Germany
- France
- APAC
- China
- India
- Japan
- Middle East and Africa
- UAE
- Saudi Arabia
- South Africa
- South America
- Brazil
- Argentina
- Colombia
- Rest of World (ROW)
- North America
By Type Insights
The project-oriented services segment is estimated to witness significant growth during the forecast period.
The project-oriented services segment is defined by targeted, time-bound initiatives that leverage custom application development and generative ai integration to drive enterprise goals.
Organizations engage these services for complex tasks like legacy system modernization and implementing a robust hybrid cloud strategy. This approach, centered on agile development cycles and technical roadmap execution, facilitates a shift toward operational expenditure models.
Effective systems integration is crucial, ensuring disparate software and hardware platforms are harmonized into a unified architecture.
By utilizing specialized it infrastructure consulting, firms have achieved a 20% improvement in project delivery timelines, optimizing resource allocation and accelerating time to market acceleration for new digital products.
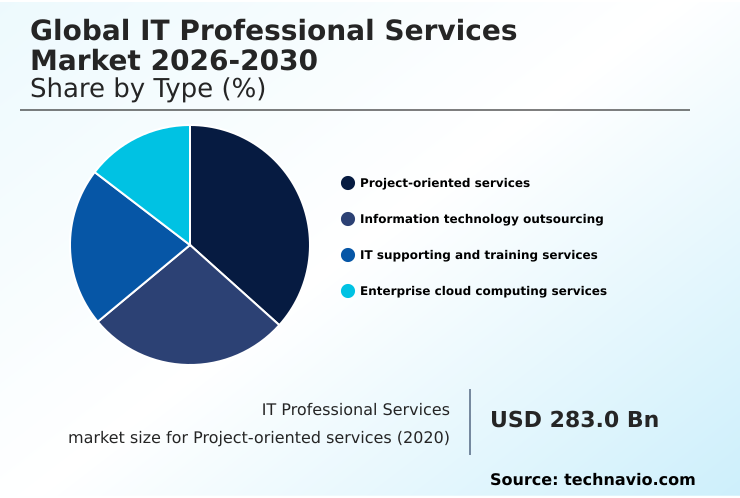
The Project-oriented services segment was valued at USD 364.2 billion in 2024 and showed a gradual increase during the forecast period.
Regional Analysis
North America is estimated to contribute 39% to the growth of the global market during the forecast period.Technavio’s analysts have elaborately explained the regional trends and drivers that shape the market during the forecast period.
See How IT Professional Services Market Demand is Rising in North America Get Free Sample
The geographic landscape of the IT professional services market is characterized by distinct regional dynamics.
North America, contributing nearly 39% of the market's incremental growth, remains a dominant force, driven by intense demand for application management services and high performance computing. Europe focuses heavily on data sovereignty compliance and smart factory implementation.
Meanwhile, APAC is a rapidly expanding hub for bpo and kpo services, leveraging its vast talent pool for global delivery models and nearshore development hubs.
Businesses in the region are adopting software as a service at an accelerated rate, leading to operational efficiency gains of up to 25%.
This global distribution of expertise allows for follow the sun development, significantly enhancing project velocity and resilience across international operations.
Market Dynamics
Our researchers analyzed the data with 2025 as the base year, along with the key drivers, trends, and challenges. A holistic analysis of drivers will help companies refine their marketing strategies to gain a competitive advantage.
- Enterprises are increasingly seeking specialized expertise for high-stakes digital initiatives, moving beyond generic consulting to demand specific outcomes. The focus is now on advanced services such as cloud native application refactoring services and ai-driven predictive maintenance implementation to overhaul core operations.
- In sectors like manufacturing, iot platform integration for manufacturing is critical for building intelligent supply chains, while enterprise blockchain solution development is gaining traction for enhancing transparency and security. The implementation of a zero trust security model implementation is no longer optional but a baseline requirement for protecting distributed assets.
- Forward-thinking organizations are also engaging in quantum computing readiness consulting to prepare for future technological disruptions. In finance, regulatory compliance automation for finance streamlines complex reporting, and the adoption of a data fabric architecture design services unifies disparate data sources.
- Strategic projects like multicloud governance and cost management and legacy erp to saas migration strategy are essential for optimizing IT spend, with successful migrations reducing infrastructure costs by over 40% compared to unmanaged environments. Furthermore, the use of a digital twin for supply chain visibility and generative ai for code generation is accelerating innovation.
- The demand for these sophisticated services, including it professional services for healthcare, it professional services for retail, it professional services for banking, it professional services for manufacturing, it professional services for government, it professional services for sme and it professional services for large enterprises highlights a market shifting toward deep, domain-specific partnerships.
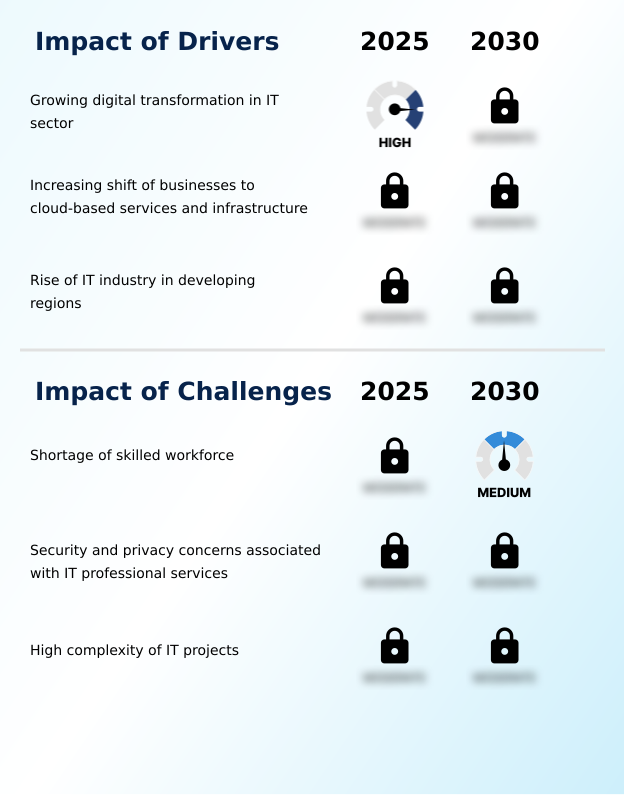
What are the key market drivers leading to the rise in the adoption of IT Professional Services Industry?
- The pervasive digital transformation across the IT sector serves as a primary driver, fueling the demand for specialized expertise in IT professional services.
- Digital transformation continues to be a primary market driver, compelling organizations to rethink their core business processes and customer engagement strategies. The push for an omnichannel customer experience necessitates sophisticated systems integration and the development of interoperable software solutions.
- Businesses are increasingly adopting operational expenditure models through infrastructure as a service and platform as a service, which has been shown to reduce upfront capital investment by over 60%.
- This shift allows for greater focus on strategic initiatives and time to market acceleration.
- The need for continuous innovation is also fueling demand for services that support agile development cycles and efficient technical roadmap execution, ensuring that technology investments deliver measurable business outcomes.
What are the market trends shaping the IT Professional Services Industry?
- The increasing adoption of hybrid and multi-cloud environments is a significant market trend, providing enterprises with greater operational flexibility and infrastructure resilience.
- Key market trends are reshaping service delivery models, with a pronounced shift toward intelligent automation and decentralized architectures. The rising adoption of low code development and no code platforms is empowering businesses to accelerate application delivery, reducing dependency on traditional coding. This democratization of development has led to productivity gains of up to 40% in certain business units.
- Concurrently, the integration of automated coding tools into devops methodology is streamlining workflows and improving code quality. The strategic importance of business continuity planning and disaster recovery planning is also growing, driving investment in more resilient and distributed infrastructure. Organizations are increasingly adopting value stream mapping to identify and eliminate inefficiencies in their digital service lifecycle, further optimizing performance.
What challenges does the IT Professional Services Industry face during its growth?
- A persistent shortage of a skilled workforce capable of managing rapid technological innovations remains a key challenge affecting the industry's growth trajectory.
- The market faces significant constraints, primarily stemming from talent scarcity and rising project complexity. The shortage of professionals skilled in edge computing solutions and network security infrastructure creates a bottleneck for innovation, with project delays increasing by an average of 15% due to staffing issues.
- Additionally, managing technical debt reduction and executing a comprehensive application portfolio modernization strategy require deep expertise that is in short supply. Security remains a paramount concern; implementing a robust it governance framework and effective technology risk management are non-negotiable but add layers of complexity and cost.
- Navigating vendor lock in avoidance while building a resilient system design in a multi-provider environment further complicates strategic planning and execution for many enterprises.
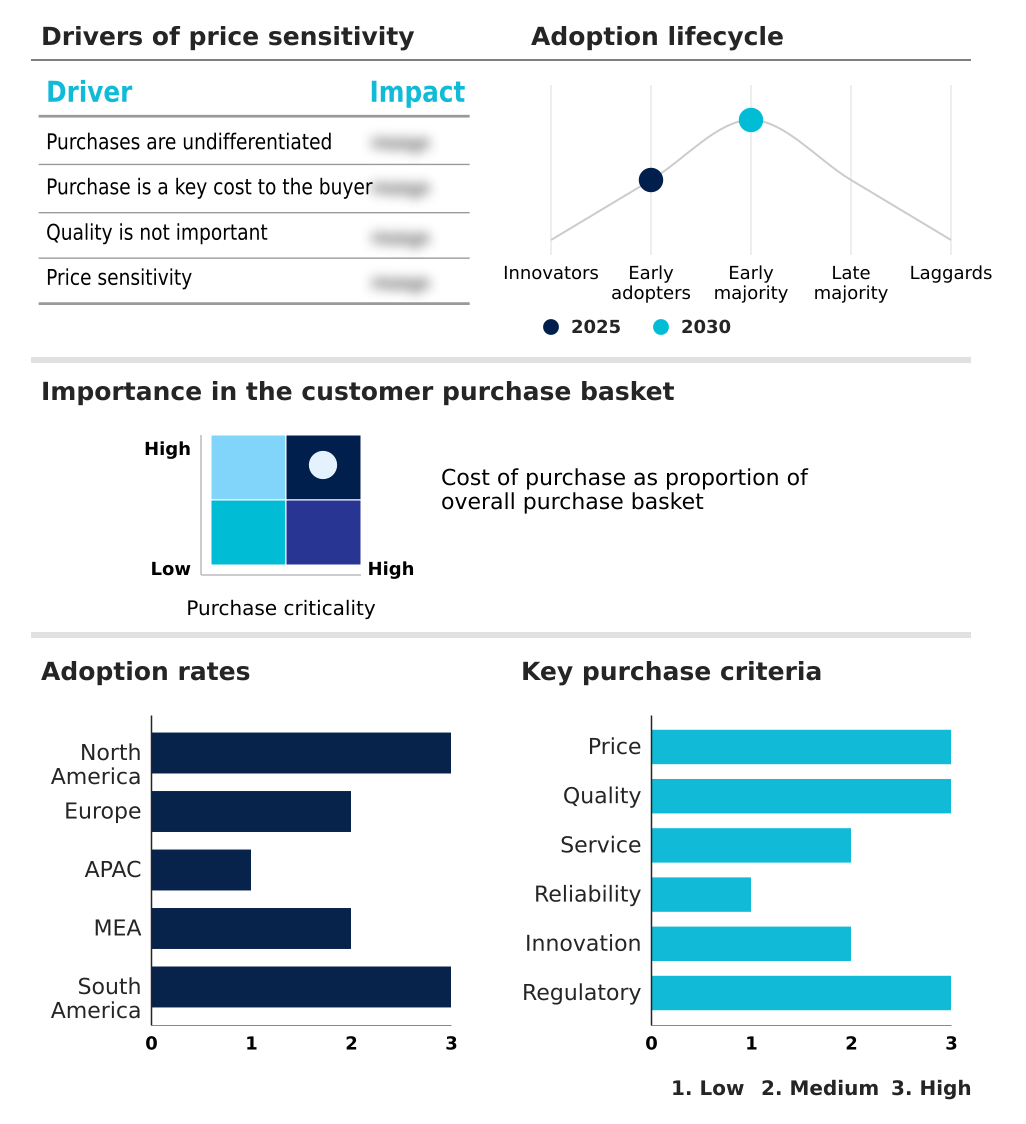
Exclusive Technavio Analysis on Customer Landscape
The it professional services market forecasting report includes the adoption lifecycle of the market, covering from the innovator’s stage to the laggard’s stage. It focuses on adoption rates in different regions based on penetration. Furthermore, the it professional services market report also includes key purchase criteria and drivers of price sensitivity to help companies evaluate and develop their market growth analysis strategies.
Customer Landscape of IT Professional Services Industry
Competitive Landscape
Companies are implementing various strategies, such as strategic alliances, it professional services market forecast, partnerships, mergers and acquisitions, geographical expansion, and product/service launches, to enhance their presence in the industry.
Accenture Plc - Offerings encompass strategic digital transformation, including cloud migration, cybersecurity, and large-scale enterprise system overhauls designed to enhance operational efficiency and market competitiveness.
The industry research and growth report includes detailed analyses of the competitive landscape of the market and information about key companies, including:
- Accenture Plc
- Atos SE
- Booz Allen Hamilton Corp.
- Capgemini SE
- Cognizant Technology Solution
- Deloitte Touche Tohmatsu Ltd.
- DXC Technology Co.
- Ernst and Young Global Ltd.
- Fujitsu Ltd.
- HCL Technologies Ltd.
- IBM Corp.
- Infosys Ltd.
- KPMG International Ltd.
- Kyndryl Inc.
- LTIMindtree Ltd.
- NTT Communications Corp.
- PricewaterhouseCoopers LLP
- Tata Consultancy Services
- Tech Mahindra Ltd.
- Wipro Ltd.
Qualitative and quantitative analysis of companies has been conducted to help clients understand the wider business environment as well as the strengths and weaknesses of key industry players. Data is qualitatively analyzed to categorize companies as pure play, category-focused, industry-focused, and diversified; it is quantitatively analyzed to categorize companies as dominant, leading, strong, tentative, and weak.
Recent Development and News in It professional services market
- In August 2025, Oracle enhanced its database services with new professional support options for its high-performance on-premises hardware, specifically targeting secure government installations.
- In January 2025, Accenture launched a new generative AI integration service designed to help global clients accelerate their custom software development and modernization projects.
- In March 2025, Wipro initiated a major global training program to certify ten thousand employees in advanced cloud security and automated support protocols, addressing the industry's talent gap.
- In May 2025, Tata Consultancy Services announced a new multi-million dollar partnership with a major global retailer to overhaul its core legacy systems by integrating advanced AI analytics.
Dive into Technavio’s robust research methodology, blending expert interviews, extensive data synthesis, and validated models for unparalleled IT Professional Services Market insights. See full methodology.
| Market Scope | |
|---|---|
| Page number | 304 |
| Base year | 2025 |
| Historic period | 2020-2024 |
| Forecast period | 2026-2030 |
| Growth momentum & CAGR | Accelerate at a CAGR of 11.4% |
| Market growth 2026-2030 | USD 781.5 billion |
| Market structure | Fragmented |
| YoY growth 2025-2026(%) | 9.9% |
| Key countries | US, Canada, Mexico, UK, Germany, France, Italy, Spain, The Netherlands, China, India, Japan, South Korea, Australia, Indonesia, UAE, Saudi Arabia, South Africa, Israel, Turkey, Brazil, Argentina and Colombia |
| Competitive landscape | Leading Companies, Market Positioning of Companies, Competitive Strategies, and Industry Risks |
Research Analyst Overview
- The IT professional services market is defined by its pivotal role in enterprise transformation, where the focus has shifted from operational support to strategic enablement. Key activities like systems integration, cloud migration services, and custom application development are now foundational for achieving competitive advantage.
- Businesses are leveraging devops methodology and serverless computing to accelerate innovation, while multi cloud management has become essential for balancing cost and performance. The integration of technologies such as generative ai integration, high performance computing, and digital twin technology requires deep expertise that is often sourced externally.
- A critical boardroom consideration is legacy system modernization, where successful projects involving enterprise resource planning and customer relationship management overhauls have demonstrated a 30% reduction in process cycle times. As firms implement a zero trust architecture and address data sovereignty compliance, the demand for specialized it infrastructure consulting, managed infrastructure services, and automated coding tools continues to rise.
- Service providers are also expanding into areas like ai ethics consulting, smart factory implementation, and developing electronic payment networks to meet evolving industry needs. This complex ecosystem, which also includes services for digital patient records, e-government portals, and software defined networking, relies on a robust framework of technical support services and talent upskilling programs.
What are the Key Data Covered in this IT Professional Services Market Research and Growth Report?
-
What is the expected growth of the IT Professional Services Market between 2026 and 2030?
-
USD 781.5 billion, at a CAGR of 11.4%
-
-
What segmentation does the market report cover?
-
The report is segmented by Type (Project-oriented services, Information technology outsourcing, IT supporting and training services, and Enterprise cloud computing services), End-user (Large enterprises, and Small and medium enterprises), Deployment (Cloud, and On-premises) and Geography (North America, Europe, APAC, Middle East and Africa, South America)
-
-
Which regions are analyzed in the report?
-
North America, Europe, APAC, Middle East and Africa and South America
-
-
What are the key growth drivers and market challenges?
-
Growing digital transformation in IT sector, Shortage of skilled workforce
-
-
Who are the major players in the IT Professional Services Market?
-
Accenture Plc, Atos SE, Booz Allen Hamilton Corp., Capgemini SE, Cognizant Technology Solution, Deloitte Touche Tohmatsu Ltd., DXC Technology Co., Ernst and Young Global Ltd., Fujitsu Ltd., HCL Technologies Ltd., IBM Corp., Infosys Ltd., KPMG International Ltd., Kyndryl Inc., LTIMindtree Ltd., NTT Communications Corp., PricewaterhouseCoopers LLP, Tata Consultancy Services, Tech Mahindra Ltd. and Wipro Ltd.
-
Market Research Insights
- The market's momentum is defined by a strategic pivot toward value-added outcomes, where performance-based contracts are increasingly common. Enterprises leverage a global delivery model and nearshore development hubs to achieve continuous integration deployment, accelerating product launches. This approach improves it cost optimization and facilitates vendor lock in avoidance.
- Organizations implementing a formal data migration strategy have reported a 35% reduction in associated risks, while those adopting comprehensive change management consulting see user adoption rates improve by over 50%. The focus on talent upskilling programs is critical for building resilient system design capabilities internally.
- As businesses refine their it operating model design, they are better positioned to capitalize on emerging digital opportunities.
We can help! Our analysts can customize this it professional services market research report to meet your requirements.
 RIA -
RIA - 
