IT Workflow Automation Platforms (non-itsm) Market Analysis, Size, and Forecast 2026-2030: North America (US, Canada, and Mexico), Europe (Germany, UK, and France), APAC (China, Japan, and India), Middle East and Africa (Saudi Arabia, UAE, and South Africa), South America (Brazil, Argentina, and Colombia), and Rest of World (ROW)

IT Workflow Automation Platforms (non-itsm) Market Analysis, Size, and Forecast 2026-2030:
North America (US, Canada, and Mexico), Europe (Germany, UK, and France), APAC (China, Japan, and India), Middle East and Africa (Saudi Arabia, UAE, and South Africa), South America (Brazil, Argentina, and Colombia), and Rest of World (ROW)

Published: Mar 2026 298 Pages SKU: IRTNTR81286

Market Overview at a Glance

$15.76 B
Market Opportunity
13.7%
CAGR 2025 - 2030
43.9%
North America Growth
$10.88 B
Solutions segment 2024

IT Workflow Automation Platforms (non-itsm) Market Size 2026-2030

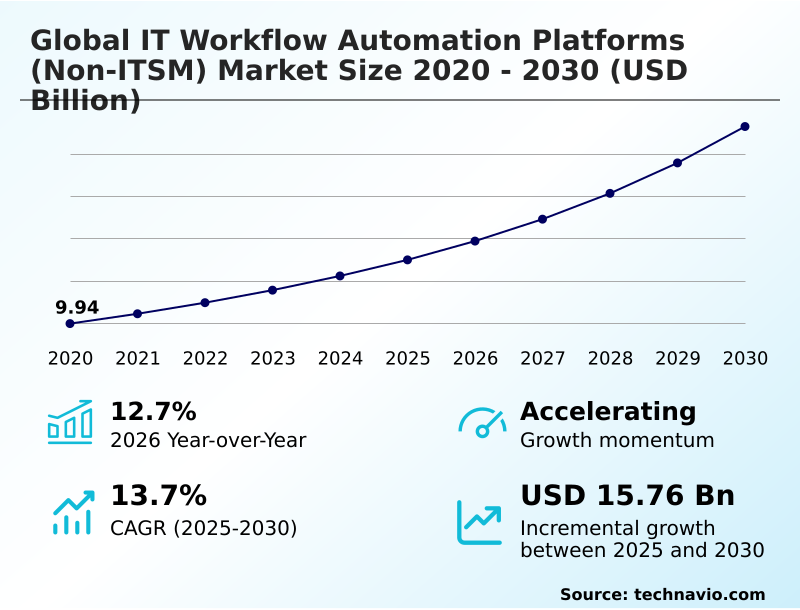
The it workflow automation platforms (non-itsm) market size is valued to increase by USD 15.76 billion, at a CAGR of 13.7% from 2025 to 2030. Escalating complexity of multi-cloud and hybrid infrastructure environments will drive the it workflow automation platforms (non-itsm) market.

Major Market Trends & Insights

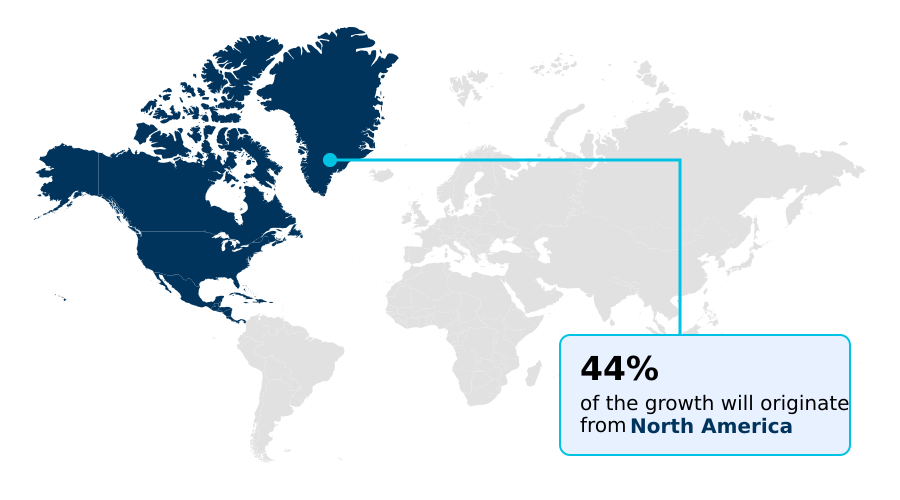
  • North America dominated the market and accounted for a 43.9% growth during the forecast period.
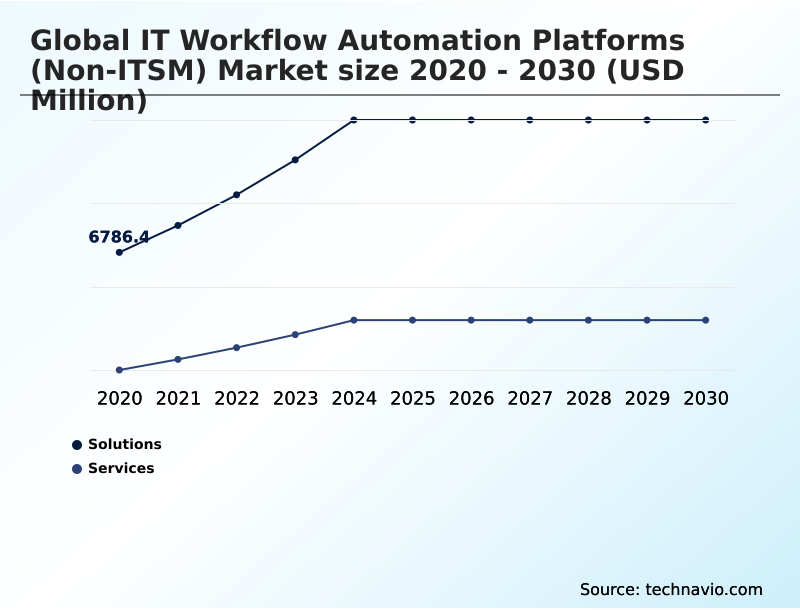
  • By Component - Solutions segment was valued at USD 10.88 billion in 2024
  • By Deployment - Cloud based segment accounted for the largest market revenue share in 2024

Market Size & Forecast

  • Market Opportunities: USD 23.29 billion
  • Market Future Opportunities: USD 15.76 billion
  • CAGR from 2025 to 2030 : 13.7%

Market Summary

  • The IT workflow automation platforms (non-itsm) market is defined by the strategic shift from manual intervention to automated orchestration of core technical processes. This evolution is driven by the need to manage complex hybrid cloud architectures and enforce security at scale, moving beyond the scope of traditional service management.
  • Platforms centered on infrastructure as code and multi cloud orchestration enable organizations to achieve higher agility and reduce human error.
  • For instance, in the financial sector, firms leverage automated security remediation to ensure continuous compliance with regulatory standards, applying security patches across thousands of servers in minutes rather than days, which is critical for maintaining system integrity and avoiding costly service disruptions.
  • The integration of AI for IT operations further enhances these capabilities, allowing for predictive maintenance and self-healing systems that proactively address potential failures before they impact business operations. This focus on operational resilience and efficiency is a cornerstone of modern digital strategy, enabling businesses to innovate faster while maintaining a stable and secure technology foundation.

What will be the Size of the IT Workflow Automation Platforms (non-itsm) Market during the forecast period?

Get Key Insights on Market Forecast (PDF) Request Free Sample

How is the IT Workflow Automation Platforms (non-itsm) Market Segmented?

The it workflow automation platforms (non-itsm) industry research report provides comprehensive data (region-wise segment analysis), with forecasts and estimates in "USD million" for the period 2026-2030, as well as historical data from 2020-2024 for the following segments.

  • Component
    • Solutions
    • Services
  • Deployment
    • Cloud based
    • On premises
  • End-user
    • BFSI
    • Healthcare
    • Retail and e-commerce
    • Manufacturing
    • Others
  • Geography
    • North America
      • US
      • Canada
      • Mexico
    • Europe
      • Germany
      • UK
      • France
    • APAC
      • China
      • Japan
      • India
    • Middle East and Africa
      • Saudi Arabia
      • UAE
      • South Africa
    • South America
      • Brazil
      • Argentina
      • Colombia
    • Rest of World (ROW)

By Component Insights

The solutions segment is estimated to witness significant growth during the forecast period.

The solutions segment represents the core software enabling the systematic execution of technical tasks without manual intervention.

These platforms for technical workflow orchestration function as the central nervous system for modern enterprise environments, facilitating end to end process orchestration of complex processes across hybrid and multi-cloud infrastructures, which improves system stability by over 15%.

This architecture includes robust application programming interfaces that allow for the integration of disparate software tools, such as those for devsecops integration and aıops platforms.

The modern solution set prioritizes interoperability and a unified security posture, ensuring that automation workflows can span legacy on-premises servers and modern serverless computing environments.

As organizations seek higher operational maturity, reliance on sophisticated software solutions that provide a unified view of automated tasks becomes paramount, particularly for infrastructure lifecycle management and leveraging lightweight automation agents for edge native automation.

Request Free Sample

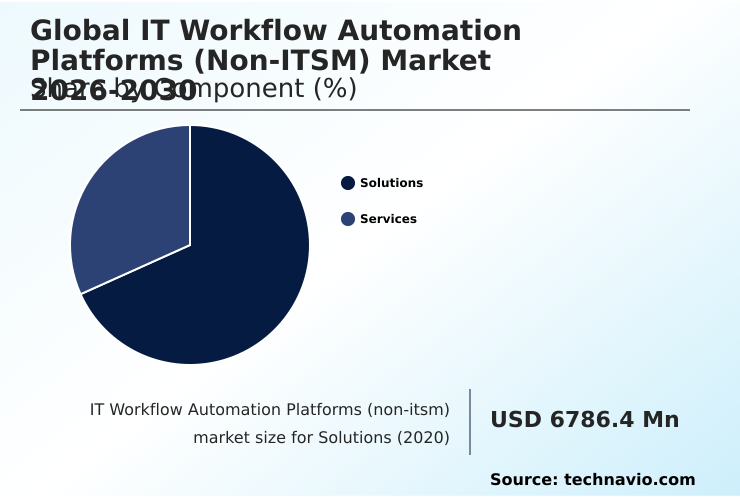
The Solutions segment was valued at USD 10.88 billion in 2024 and showed a gradual increase during the forecast period.

Request Free Sample

Regional Analysis

North America is estimated to contribute 43.9% to the growth of the global market during the forecast period.Technavio’s analysts have elaborately explained the regional trends and drivers that shape the market during the forecast period.

See How IT Workflow Automation Platforms (non-itsm) Market Demand is Rising in North America Request Free Sample

The geographic landscape for IT workflow automation is led by North America, which accounts for over 43% of the market's incremental growth, driven by a high concentration of technology providers and mature enterprise adopters.

Organizations in this region are rapidly moving toward autonomous technical environments for hybrid infrastructure management.

Meanwhile, the APAC region is expanding at the fastest rate, outpacing other regions by nearly a full percentage point, fueled by the massive scale of its digital economies and a mobile-first approach.

Europe prioritizes digital sovereignty, with a strong focus on decentralized workflow automation and compliance with data residency regulations. Key activities include data pipeline management, remote node management, and the use of smart factory systems.

This regional diversity underscores a global trend toward using automated configuration management and runbook automation to achieve operational excellence in increasingly complex digital ecosystems.

Market Dynamics

Our researchers analyzed the data with 2025 as the base year, along with the key drivers, trends, and challenges. A holistic analysis of drivers will help companies refine their marketing strategies to gain a competitive advantage.

  • The successful adoption of non-ITSM automation hinges on addressing several critical factors. A primary challenge involves integrating automation with legacy systems, where low code platforms for process automation are providing a viable bridge for modernization. This allows organizations to begin optimizing costs with workflow automation without a complete overhaul of their existing infrastructure.
  • In comparing ITSM and non-ITSM automation, the latter provides deeper technical control, which is essential for implementing infrastructure as code best practices and securing continuous deployment pipelines. Effective governance for automated workflows is paramount to prevent automated error remediation at scale, a risk that grows with the complexity of multi-cloud automation and governance.
  • Furthermore, the industry is grappling with how to best apply generative AI for infrastructure automation, a trend that promises to lower the barrier to entry but also requires new skill sets. For sectors like financial services, compliance automation remains a top priority, while for manufacturing, the focus is on automating manufacturing execution systems.
  • The rise of trends in internal developer platforms for self-service automation is a direct response to addressing the DevOps skills gap. As edge computing workflow orchestration becomes more common, especially in retail and e-commerce, the ability to manage distributed environments efficiently will be a key differentiator.
  • Firms leveraging dedicated non-ITSM platforms for multi-cloud governance report deployment cycles that are twice as fast as those relying solely on native cloud tools.

What are the key market drivers leading to the rise in the adoption of IT Workflow Automation Platforms (non-itsm) Industry?

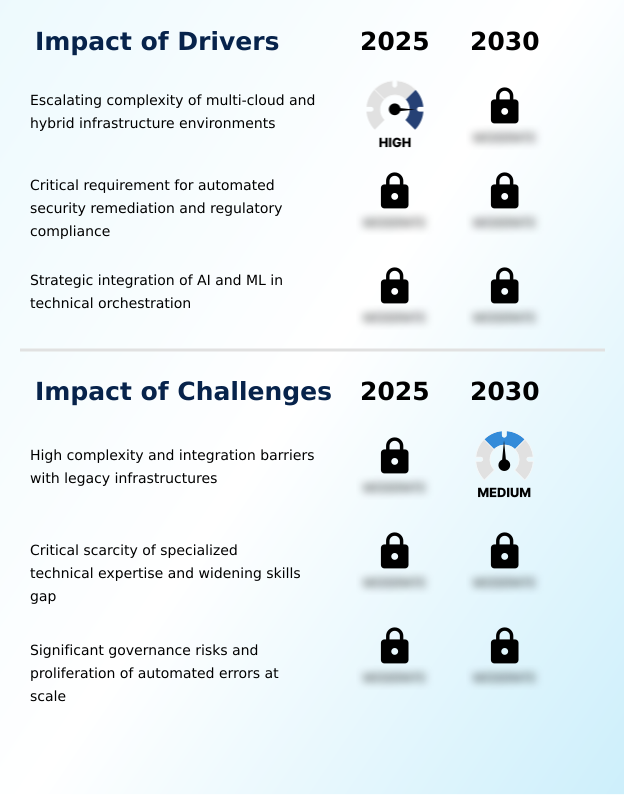
  • The escalating complexity of managing multi-cloud and hybrid infrastructure environments is a primary driver for the adoption of IT workflow automation platforms.

  • Market growth is significantly driven by the escalating complexity of distributed technology environments, compelling a shift toward automated management.
  • The critical requirement for automated security remediation and regulatory compliance is a primary factor, with platforms enabling self-healing security environments that can detect anomalies and trigger immediate corrective actions, reducing threat response times by over 60%.
  • The strategic integration of AI and machine learning, particularly through AI for IT operations, transforms technical operations from reactive to predictive. By using telemetry data analysis, these platforms can anticipate impending failures and trigger remedial workflows.
  • This proactive approach not only minimizes user disruption but also extends hardware lifespan through optimized usage, with some firms reporting a 12% reduction in related capital expenditures.
  • This convergence of intelligent analytics, including process mining and execution and idempotent script execution, creates a powerful engine for digital transformation and technical debt reduction.

What are the market trends shaping the IT Workflow Automation Platforms (non-itsm) Industry?

  • The convergence of generative artificial intelligence and autonomous orchestration is a key trend. This shift is redefining IT operations by enabling intent-based automation and self-managing systems.

  • Key market trends revolve around the convergence of generative artificial intelligence with autonomous systems management, a shift enabling intent based networking and automation. This transition allows technical teams to describe desired infrastructure states in natural language, with platforms translating these into executable code, which has been shown to accelerate development cycles by up to 40%.
  • The proliferation of platform engineering and the use of a predictive analytics engine are creating internal developer portals that offer self-service capabilities through a frictionless consumption model. These portals automate underlying technical workflows, achieving an 18% reduction in cognitive load on developers.
  • This movement toward creating self-healing systems via cloud native orchestration and automated failover and recovery is redefining digital infrastructure management, focusing on strategic architecture rather than routine maintenance.

What challenges does the IT Workflow Automation Platforms (non-itsm) Industry face during its growth?

  • High complexity and significant integration barriers with entrenched legacy infrastructures present a key challenge to the widespread adoption of modern automation platforms.

  • Significant challenges constrain market growth, primarily the complexity and integration barriers associated with legacy infrastructures. Bridging modern orchestration platforms with monolithic systems requires extensive custom development, often increasing technical debt and prolonging implementation timelines by as much as 50% compared to greenfield projects.
  • Another critical restraint is the scarcity of specialized technical expertise, creating a skills gap that forces organizations to delay projects or rely on expensive consultants. The lack of personnel skilled in managing infrastructure as code and observability data platforms can undermine the effectiveness of even the most advanced tools.
  • Furthermore, significant governance risks and the potential for automated errors at scale create hesitation, as a single flawed script can cause widespread outages. This risk is amplified without rigorous automated testing and a mature policy as code governance framework, leading firms to retain manual checks that limit efficiency gains.

Exclusive Technavio Analysis on Customer Landscape

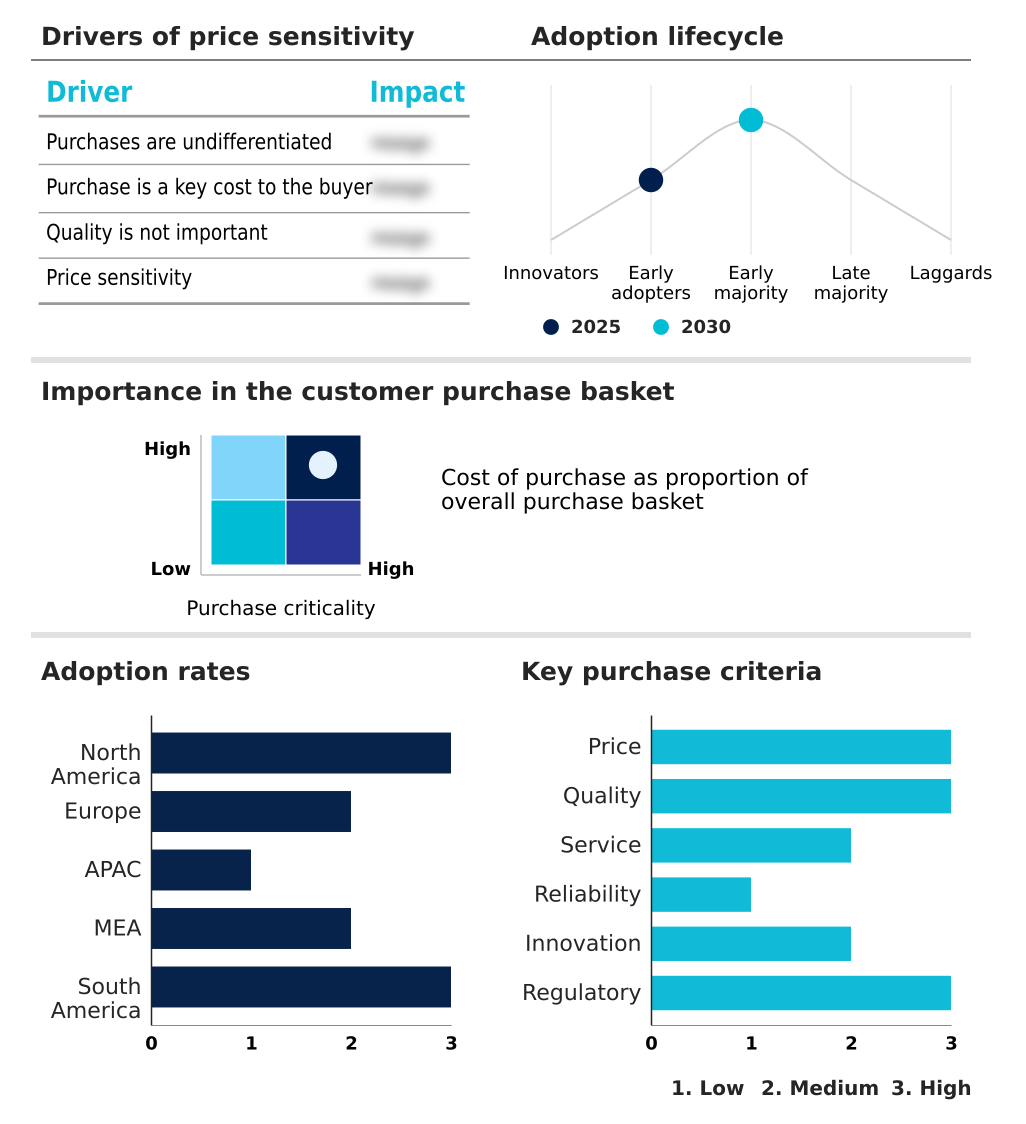
The it workflow automation platforms (non-itsm) market forecasting report includes the adoption lifecycle of the market, covering from the innovator’s stage to the laggard’s stage. It focuses on adoption rates in different regions based on penetration. Furthermore, the it workflow automation platforms (non-itsm) market report also includes key purchase criteria and drivers of price sensitivity to help companies evaluate and develop their market growth analysis strategies.

Customer Landscape of IT Workflow Automation Platforms (non-itsm) Industry

Competitive Landscape

Companies are implementing various strategies, such as strategic alliances, it workflow automation platforms (non-itsm) market forecast, partnerships, mergers and acquisitions, geographical expansion, and product/service launches, to enhance their presence in the industry.

airSlate Inc. - Delivering low-code, AI-driven platforms for process automation, application integration, and end-to-end workflow orchestration across enterprise systems.

The industry research and growth report includes detailed analyses of the competitive landscape of the market and information about key companies, including:

  • airSlate Inc.
  • Appian Corp.
  • Atlassian Corp.
  • BMC Software Inc.
  • Boomi LP
  • Celonis SE
  • IBM Corp.
  • Kissflow Inc.
  • Microsoft Corp.
  • MuleSoft
  • Nintex Global Ltd.
  • Oracle Corp.
  • PagerDuty Inc.
  • Pipefy Inc.
  • SAP SE
  • ServiceNow Inc.
  • UiPath Inc.
  • Workato Inc.
  • Zapier Inc.
  • Zoho Corp. Pvt. Ltd.

Qualitative and quantitative analysis of companies has been conducted to help clients understand the wider business environment as well as the strengths and weaknesses of key industry players. Data is qualitatively analyzed to categorize companies as pure play, category-focused, industry-focused, and diversified; it is quantitatively analyzed to categorize companies as dominant, leading, strong, tentative, and weak.

Recent Development and News in It workflow automation platforms (non-itsm) market

  • In April, 2025, Red Hat announced a major enhancement to its Ansible Automation Platform, utilizing a custom-trained large language model to suggest and complete automation playbooks in real time.
  • In May, 2025, VMware by Broadcom introduced a unified orchestration layer designed to synchronize security and networking policies across private and public cloud environments simultaneously.
  • In May, 2025, Oracle introduced a series of legacy database adapters specifically designed to facilitate connectivity between aging record systems and modern automated cloud environments.
  • In May, 2025, Google Cloud introduced an enhanced workflow orchestration module within its cloud-native services to facilitate the automated management of machine learning pipelines.

Dive into Technavio’s robust research methodology, blending expert interviews, extensive data synthesis, and validated models for unparalleled IT Workflow Automation Platforms (non-itsm) Market insights. See full methodology.

Market Scope
Page number 298
Base year 2025
Historic period 2020-2024
Forecast period 2026-2030
Growth momentum & CAGR Accelerate at a CAGR of 13.7%
Market growth 2026-2030 USD 15758.3 million
Market structure Fragmented
YoY growth 2025-2026(%) 12.7%
Key countries US, Canada, Mexico, Germany, UK, France, Italy, The Netherlands, Spain, China, Japan, India, South Korea, Australia, Indonesia, Saudi Arabia, UAE, South Africa, Israel, Turkey, Brazil, Argentina and Colombia
Competitive landscape Leading Companies, Market Positioning of Companies, Competitive Strategies, and Industry Risks

Request Free Sample

Research Analyst Overview

  • The market is rapidly advancing toward autonomous orchestration, where predictive technical operations are managed via a zero trust architecture. This transformation is built on infrastructure as code, which enables robust automated configuration management and hybrid infrastructure management across diverse hybrid cloud architectures. Leading solutions offer multi cloud orchestration for end to end process orchestration, streamlining technical workflow orchestration.
  • A key boardroom focus is security, where automated security remediation and automated policy enforcement are crucial. This is realized through self healing security environments that use automated vulnerability scanning within continuous deployment pipelines, improving security posture by over 30%. Platforms facilitate dynamic resource scaling and automated resource provisioning for microservices architectures.
  • The rise of low code process orchestration and no code workflow automation, powered by AI driven decisioning, is expanding accessibility.
  • These tools manage everything from system patching automation and data pipeline management to containerized application deployment in serverless computing environments, ensuring full infrastructure lifecycle management through standardized application programming interfaces and event driven workflows, supported by process mining and execution, runbook automation, and robotic process automation for legacy systems.

What are the Key Data Covered in this IT Workflow Automation Platforms (non-itsm) Market Research and Growth Report?

  • What is the expected growth of the IT Workflow Automation Platforms (non-itsm) Market between 2026 and 2030?

    • USD 15.76 billion, at a CAGR of 13.7%

  • What segmentation does the market report cover?

    • The report is segmented by Component (Solutions, and Services), Deployment (Cloud based, and On premises), End-user (BFSI, Healthcare, Retail and e-commerce, Manufacturing, and Others) and Geography (North America, Europe, APAC, Middle East and Africa, South America)

  • Which regions are analyzed in the report?

    • North America, Europe, APAC, Middle East and Africa and South America

  • What are the key growth drivers and market challenges?

    • Escalating complexity of multi-cloud and hybrid infrastructure environments, High complexity and integration barriers with legacy infrastructures

  • Who are the major players in the IT Workflow Automation Platforms (non-itsm) Market?

    • airSlate Inc., Appian Corp., Atlassian Corp., BMC Software Inc., Boomi LP, Celonis SE, IBM Corp., Kissflow Inc., Microsoft Corp., MuleSoft, Nintex Global Ltd., Oracle Corp., PagerDuty Inc., Pipefy Inc., SAP SE, ServiceNow Inc., UiPath Inc., Workato Inc., Zapier Inc. and Zoho Corp. Pvt. Ltd.

Market Research Insights

  • The market's dynamic is shaped by a strategic move toward zero touch operations and a robust digital resilience framework. Enterprises are establishing a unified control plane to manage disparate systems, adopting a frictionless consumption model that reduces developer cognitive load by over 25%.
  • The implementation of policy as code governance and automated compliance monitoring is becoming standard, with some organizations achieving a 40% improvement in audit readiness. This shift, driven by AIOps platforms and a focus on technical debt reduction, emphasizes interoperability standards to connect industrial internet of things devices with enterprise systems.
  • The ultimate goal is a unified security posture through declarative configuration management and configuration drift detection, ensuring stability and efficiency across all operations.

We can help! Our analysts can customize this it workflow automation platforms (non-itsm) market research report to meet your requirements.

Get in touch

1. Executive Summary

1.1 Market overview

Executive Summary - Chart on Market Overview
Executive Summary - Data Table on Market Overview
Executive Summary - Chart on Global Market Characteristics
Executive Summary - Chart on Market by Geography
Executive Summary - Chart on Market Segmentation by Component
Executive Summary - Chart on Market Segmentation by Deployment
Executive Summary - Chart on Market Segmentation by End-user
Executive Summary - Chart on Incremental Growth
Executive Summary - Data Table on Incremental Growth
Executive Summary - Chart on Company Market Positioning

2. Technavio Analysis

2.1 Analysis of price sensitivity, lifecycle, customer purchase basket, adoption rates, and purchase criteria

2.2 Criticality of inputs and Factors of differentiation

Chart on Overview on criticality of inputs and factors of differentiation

2.3 Factors of disruption

Chart on Overview on factors of disruption

2.4 Impact of drivers and challenges

Chart on Impact of drivers and challenges in 2025 and 2030

3. Market Landscape

3.1 Market ecosystem

Chart on Parent Market
Data Table on - Parent Market

3.2 Market characteristics

Chart on Market characteristics analysis

3.3 Value chain analysis

Chart on Value chain analysis

4. Market Sizing

4.1 Market definition

Data Table on Offerings of companies included in the market definition

4.2 Market segment analysis

Market segments

4.3 Market size 2025

4.4 Market outlook: Forecast for 2025-2030

Chart on Global - Market size and forecast 2025-2030 ($ million)
Data Table on Global - Market size and forecast 2025-2030 ($ million)
Chart on Global Market: Year-over-year growth 2025-2030 (%)
Data Table on Global Market: Year-over-year growth 2025-2030 (%)

5. Historic Market Size

5.1 Global IT Workflow Automation Platforms (Non-ITSM) Market 2020 - 2024

Historic Market Size - Data Table on Global IT Workflow Automation Platforms (Non-ITSM) Market 2020 - 2024 ($ million)

5.2 Component segment analysis 2020 - 2024

Historic Market Size - Component Segment 2020 - 2024 ($ million)

5.3 Deployment segment analysis 2020 - 2024

Historic Market Size - Deployment Segment 2020 - 2024 ($ million)

5.4 End-user segment analysis 2020 - 2024

Historic Market Size - End-user Segment 2020 - 2024 ($ million)

5.5 Geography segment analysis 2020 - 2024

Historic Market Size - Geography Segment 2020 - 2024 ($ million)

5.6 Country segment analysis 2020 - 2024

Historic Market Size - Country Segment 2020 - 2024 ($ million)

6. Qualitative Analysis

6.1 The AI impact on Global IT Workflow Automation Platforms (Non-ITSM) Market

7. Five Forces Analysis

7.1 Five forces summary

Five forces analysis - Comparison between 2025 and 2030

7.2 Bargaining power of buyers

Bargaining power of buyers - Impact of key factors 2025 and 2030

7.3 Bargaining power of suppliers

Bargaining power of suppliers - Impact of key factors in 2025 and 2030

7.4 Threat of new entrants

Threat of new entrants - Impact of key factors in 2025 and 2030

7.5 Threat of substitutes

Threat of substitutes - Impact of key factors in 2025 and 2030

7.6 Threat of rivalry

Threat of rivalry - Impact of key factors in 2025 and 2030

7.7 Market condition

Chart on Market condition - Five forces 2025 and 2030

8. Market Segmentation by Component

8.1 Market segments

Chart on Component - Market share 2025-2030 (%)
Data Table on Component - Market share 2025-2030 (%)

8.2 Comparison by Component

Chart on Comparison by Component
Data Table on Comparison by Component

8.3 Solutions - Market size and forecast 2025-2030

Chart on Solutions - Market size and forecast 2025-2030 ($ million)
Data Table on Solutions - Market size and forecast 2025-2030 ($ million)
Chart on Solutions - Year-over-year growth 2025-2030 (%)
Data Table on Solutions - Year-over-year growth 2025-2030 (%)

8.4 Services - Market size and forecast 2025-2030

Chart on Services - Market size and forecast 2025-2030 ($ million)
Data Table on Services - Market size and forecast 2025-2030 ($ million)
Chart on Services - Year-over-year growth 2025-2030 (%)
Data Table on Services - Year-over-year growth 2025-2030 (%)

8.5 Market opportunity by Component

Market opportunity by Component ($ million)
Data Table on Market opportunity by Component ($ million)

9. Market Segmentation by Deployment

9.1 Market segments

Chart on Deployment - Market share 2025-2030 (%)
Data Table on Deployment - Market share 2025-2030 (%)

9.2 Comparison by Deployment

Chart on Comparison by Deployment
Data Table on Comparison by Deployment

9.3 Cloud based - Market size and forecast 2025-2030

Chart on Cloud based - Market size and forecast 2025-2030 ($ million)
Data Table on Cloud based - Market size and forecast 2025-2030 ($ million)
Chart on Cloud based - Year-over-year growth 2025-2030 (%)
Data Table on Cloud based - Year-over-year growth 2025-2030 (%)

9.4 On premises - Market size and forecast 2025-2030

Chart on On premises - Market size and forecast 2025-2030 ($ million)
Data Table on On premises - Market size and forecast 2025-2030 ($ million)
Chart on On premises - Year-over-year growth 2025-2030 (%)
Data Table on On premises - Year-over-year growth 2025-2030 (%)

9.5 Market opportunity by Deployment

Market opportunity by Deployment ($ million)
Data Table on Market opportunity by Deployment ($ million)

10. Market Segmentation by End-user

10.1 Market segments

Chart on End-user - Market share 2025-2030 (%)
Data Table on End-user - Market share 2025-2030 (%)

10.2 Comparison by End-user

Chart on Comparison by End-user
Data Table on Comparison by End-user

10.3 BFSI - Market size and forecast 2025-2030

Chart on BFSI - Market size and forecast 2025-2030 ($ million)
Data Table on BFSI - Market size and forecast 2025-2030 ($ million)
Chart on BFSI - Year-over-year growth 2025-2030 (%)
Data Table on BFSI - Year-over-year growth 2025-2030 (%)

10.4 Healthcare - Market size and forecast 2025-2030

Chart on Healthcare - Market size and forecast 2025-2030 ($ million)
Data Table on Healthcare - Market size and forecast 2025-2030 ($ million)
Chart on Healthcare - Year-over-year growth 2025-2030 (%)
Data Table on Healthcare - Year-over-year growth 2025-2030 (%)

10.5 Retail and e-commerce - Market size and forecast 2025-2030

Chart on Retail and e-commerce - Market size and forecast 2025-2030 ($ million)
Data Table on Retail and e-commerce - Market size and forecast 2025-2030 ($ million)
Chart on Retail and e-commerce - Year-over-year growth 2025-2030 (%)
Data Table on Retail and e-commerce - Year-over-year growth 2025-2030 (%)

10.6 Manufacturing - Market size and forecast 2025-2030

Chart on Manufacturing - Market size and forecast 2025-2030 ($ million)
Data Table on Manufacturing - Market size and forecast 2025-2030 ($ million)
Chart on Manufacturing - Year-over-year growth 2025-2030 (%)
Data Table on Manufacturing - Year-over-year growth 2025-2030 (%)

10.7 Others - Market size and forecast 2025-2030

Chart on Others - Market size and forecast 2025-2030 ($ million)
Data Table on Others - Market size and forecast 2025-2030 ($ million)
Chart on Others - Year-over-year growth 2025-2030 (%)
Data Table on Others - Year-over-year growth 2025-2030 (%)

10.8 Market opportunity by End-user

Market opportunity by End-user ($ million)
Data Table on Market opportunity by End-user ($ million)

11. Customer Landscape

11.1 Customer landscape overview

Analysis of price sensitivity, lifecycle, customer purchase basket, adoption rates, and purchase criteria

12. Geographic Landscape

12.1 Geographic segmentation

Chart on Market share by geography 2025-2030 (%)
Data Table on Market share by geography 2025-2030 (%)

12.2 Geographic comparison

Chart on Geographic comparison
Data Table on Geographic comparison

12.3 North America - Market size and forecast 2025-2030

Chart on North America - Market size and forecast 2025-2030 ($ million)
Data Table on North America - Market size and forecast 2025-2030 ($ million)
Chart on North America - Year-over-year growth 2025-2030 (%)
Data Table on North America - Year-over-year growth 2025-2030 (%)
Chart on Regional Comparison - North America
Data Table on Regional Comparison - North America

12.3.1 US - Market size and forecast 2025-2030

Chart on US - Market size and forecast 2025-2030 ($ million)
Data Table on US - Market size and forecast 2025-2030 ($ million)
Chart on US - Year-over-year growth 2025-2030 (%)
Data Table on US - Year-over-year growth 2025-2030 (%)

12.3.2 Canada - Market size and forecast 2025-2030

Chart on Canada - Market size and forecast 2025-2030 ($ million)
Data Table on Canada - Market size and forecast 2025-2030 ($ million)
Chart on Canada - Year-over-year growth 2025-2030 (%)
Data Table on Canada - Year-over-year growth 2025-2030 (%)

12.3.3 Mexico - Market size and forecast 2025-2030

Chart on Mexico - Market size and forecast 2025-2030 ($ million)
Data Table on Mexico - Market size and forecast 2025-2030 ($ million)
Chart on Mexico - Year-over-year growth 2025-2030 (%)
Data Table on Mexico - Year-over-year growth 2025-2030 (%)

12.4 Europe - Market size and forecast 2025-2030

Chart on Europe - Market size and forecast 2025-2030 ($ million)
Data Table on Europe - Market size and forecast 2025-2030 ($ million)
Chart on Europe - Year-over-year growth 2025-2030 (%)
Data Table on Europe - Year-over-year growth 2025-2030 (%)
Chart on Regional Comparison - Europe
Data Table on Regional Comparison - Europe

12.4.1 Germany - Market size and forecast 2025-2030

Chart on Germany - Market size and forecast 2025-2030 ($ million)
Data Table on Germany - Market size and forecast 2025-2030 ($ million)
Chart on Germany - Year-over-year growth 2025-2030 (%)
Data Table on Germany - Year-over-year growth 2025-2030 (%)

12.4.2 UK - Market size and forecast 2025-2030

Chart on UK - Market size and forecast 2025-2030 ($ million)
Data Table on UK - Market size and forecast 2025-2030 ($ million)
Chart on UK - Year-over-year growth 2025-2030 (%)
Data Table on UK - Year-over-year growth 2025-2030 (%)

12.4.3 France - Market size and forecast 2025-2030

Chart on France - Market size and forecast 2025-2030 ($ million)
Data Table on France - Market size and forecast 2025-2030 ($ million)
Chart on France - Year-over-year growth 2025-2030 (%)
Data Table on France - Year-over-year growth 2025-2030 (%)

12.4.4 Italy - Market size and forecast 2025-2030

Chart on Italy - Market size and forecast 2025-2030 ($ million)
Data Table on Italy - Market size and forecast 2025-2030 ($ million)
Chart on Italy - Year-over-year growth 2025-2030 (%)
Data Table on Italy - Year-over-year growth 2025-2030 (%)

12.4.5 The Netherlands - Market size and forecast 2025-2030

Chart on The Netherlands - Market size and forecast 2025-2030 ($ million)
Data Table on The Netherlands - Market size and forecast 2025-2030 ($ million)
Chart on The Netherlands - Year-over-year growth 2025-2030 (%)
Data Table on The Netherlands - Year-over-year growth 2025-2030 (%)

12.4.6 Spain - Market size and forecast 2025-2030

Chart on Spain - Market size and forecast 2025-2030 ($ million)
Data Table on Spain - Market size and forecast 2025-2030 ($ million)
Chart on Spain - Year-over-year growth 2025-2030 (%)
Data Table on Spain - Year-over-year growth 2025-2030 (%)

12.5 APAC - Market size and forecast 2025-2030

Chart on APAC - Market size and forecast 2025-2030 ($ million)
Data Table on APAC - Market size and forecast 2025-2030 ($ million)
Chart on APAC - Year-over-year growth 2025-2030 (%)
Data Table on APAC - Year-over-year growth 2025-2030 (%)
Chart on Regional Comparison - APAC
Data Table on Regional Comparison - APAC

12.5.1 China - Market size and forecast 2025-2030

Chart on China - Market size and forecast 2025-2030 ($ million)
Data Table on China - Market size and forecast 2025-2030 ($ million)
Chart on China - Year-over-year growth 2025-2030 (%)
Data Table on China - Year-over-year growth 2025-2030 (%)

12.5.2 Japan - Market size and forecast 2025-2030

Chart on Japan - Market size and forecast 2025-2030 ($ million)
Data Table on Japan - Market size and forecast 2025-2030 ($ million)
Chart on Japan - Year-over-year growth 2025-2030 (%)
Data Table on Japan - Year-over-year growth 2025-2030 (%)

12.5.3 India - Market size and forecast 2025-2030

Chart on India - Market size and forecast 2025-2030 ($ million)
Data Table on India - Market size and forecast 2025-2030 ($ million)
Chart on India - Year-over-year growth 2025-2030 (%)
Data Table on India - Year-over-year growth 2025-2030 (%)

12.5.4 South Korea - Market size and forecast 2025-2030

Chart on South Korea - Market size and forecast 2025-2030 ($ million)
Data Table on South Korea - Market size and forecast 2025-2030 ($ million)
Chart on South Korea - Year-over-year growth 2025-2030 (%)
Data Table on South Korea - Year-over-year growth 2025-2030 (%)

12.5.5 Australia - Market size and forecast 2025-2030

Chart on Australia - Market size and forecast 2025-2030 ($ million)
Data Table on Australia - Market size and forecast 2025-2030 ($ million)
Chart on Australia - Year-over-year growth 2025-2030 (%)
Data Table on Australia - Year-over-year growth 2025-2030 (%)

12.5.6 Indonesia - Market size and forecast 2025-2030

Chart on Indonesia - Market size and forecast 2025-2030 ($ million)
Data Table on Indonesia - Market size and forecast 2025-2030 ($ million)
Chart on Indonesia - Year-over-year growth 2025-2030 (%)
Data Table on Indonesia - Year-over-year growth 2025-2030 (%)

12.6 Middle East and Africa - Market size and forecast 2025-2030

Chart on Middle East and Africa - Market size and forecast 2025-2030 ($ million)
Data Table on Middle East and Africa - Market size and forecast 2025-2030 ($ million)
Chart on Middle East and Africa - Year-over-year growth 2025-2030 (%)
Data Table on Middle East and Africa - Year-over-year growth 2025-2030 (%)
Chart on Regional Comparison - Middle East and Africa
Data Table on Regional Comparison - Middle East and Africa

12.6.1 Saudi Arabia - Market size and forecast 2025-2030

Chart on Saudi Arabia - Market size and forecast 2025-2030 ($ million)
Data Table on Saudi Arabia - Market size and forecast 2025-2030 ($ million)
Chart on Saudi Arabia - Year-over-year growth 2025-2030 (%)
Data Table on Saudi Arabia - Year-over-year growth 2025-2030 (%)

12.6.2 UAE - Market size and forecast 2025-2030

Chart on UAE - Market size and forecast 2025-2030 ($ million)
Data Table on UAE - Market size and forecast 2025-2030 ($ million)
Chart on UAE - Year-over-year growth 2025-2030 (%)
Data Table on UAE - Year-over-year growth 2025-2030 (%)

12.6.3 South Africa - Market size and forecast 2025-2030

Chart on South Africa - Market size and forecast 2025-2030 ($ million)
Data Table on South Africa - Market size and forecast 2025-2030 ($ million)
Chart on South Africa - Year-over-year growth 2025-2030 (%)
Data Table on South Africa - Year-over-year growth 2025-2030 (%)

12.6.4 Israel - Market size and forecast 2025-2030

Chart on Israel - Market size and forecast 2025-2030 ($ million)
Data Table on Israel - Market size and forecast 2025-2030 ($ million)
Chart on Israel - Year-over-year growth 2025-2030 (%)
Data Table on Israel - Year-over-year growth 2025-2030 (%)

12.6.5 Turkey - Market size and forecast 2025-2030

Chart on Turkey - Market size and forecast 2025-2030 ($ million)
Data Table on Turkey - Market size and forecast 2025-2030 ($ million)
Chart on Turkey - Year-over-year growth 2025-2030 (%)
Data Table on Turkey - Year-over-year growth 2025-2030 (%)

12.7 South America - Market size and forecast 2025-2030

Chart on South America - Market size and forecast 2025-2030 ($ million)
Data Table on South America - Market size and forecast 2025-2030 ($ million)
Chart on South America - Year-over-year growth 2025-2030 (%)
Data Table on South America - Year-over-year growth 2025-2030 (%)
Chart on Regional Comparison - South America
Data Table on Regional Comparison - South America

12.7.1 Brazil - Market size and forecast 2025-2030

Chart on Brazil - Market size and forecast 2025-2030 ($ million)
Data Table on Brazil - Market size and forecast 2025-2030 ($ million)
Chart on Brazil - Year-over-year growth 2025-2030 (%)
Data Table on Brazil - Year-over-year growth 2025-2030 (%)

12.7.2 Argentina - Market size and forecast 2025-2030

Chart on Argentina - Market size and forecast 2025-2030 ($ million)
Data Table on Argentina - Market size and forecast 2025-2030 ($ million)
Chart on Argentina - Year-over-year growth 2025-2030 (%)
Data Table on Argentina - Year-over-year growth 2025-2030 (%)

12.7.3 Colombia - Market size and forecast 2025-2030

Chart on Colombia - Market size and forecast 2025-2030 ($ million)
Data Table on Colombia - Market size and forecast 2025-2030 ($ million)
Chart on Colombia - Year-over-year growth 2025-2030 (%)
Data Table on Colombia - Year-over-year growth 2025-2030 (%)

12.8 Market opportunity by geography

Market opportunity by geography ($ million)
Data Tables on Market opportunity by geography ($ million)

13. Drivers, Challenges, and Opportunity

13.1 Market drivers

Escalating complexity of multi-cloud and hybrid infrastructure environments
Critical requirement for automated security remediation and regulatory compliance
Strategic integration of AI and ML in technical orchestration

13.2 Market challenges

High complexity and integration barriers with legacy infrastructures
Critical scarcity of specialized technical expertise and widening skills gap
Significant governance risks and proliferation of automated errors at scale

13.3 Impact of drivers and challenges

Impact of drivers and challenges in 2025 and 2030

13.4 Market opportunities

Convergence of generative artificial intelligence and autonomous orchestration
Proliferation of platform engineering and internal developer portals
Expansion of edge-native workflow automation and decentralized management

14. Competitive Landscape

14.1 Overview

14.2

Overview on criticality of inputs and factors of differentiation

14.3 Landscape disruption

Overview on factors of disruption

14.4 Industry risks

Impact of key risks on business

15. Competitive Analysis

15.1 Companies profiled

Companies covered

15.2 Company ranking index

15.3 Market positioning of companies

Matrix on companies position and classification

15.4 Appian Corp.

Appian Corp. - Overview
Appian Corp. - Product / Service
Appian Corp. - Key offerings
SWOT

15.5 Atlassian Corp.

Atlassian Corp. - Overview
Atlassian Corp. - Product / Service
Atlassian Corp. - Key news
Atlassian Corp. - Key offerings
SWOT

15.6 BMC Software Inc.

BMC Software Inc. - Overview
BMC Software Inc. - Product / Service
BMC Software Inc. - Key offerings
SWOT

15.7 Boomi LP

Boomi LP - Overview
Boomi LP - Product / Service
Boomi LP - Key offerings
SWOT

15.8 Celonis SE

Celonis SE - Overview
Celonis SE - Product / Service
Celonis SE - Key offerings
SWOT

15.9 IBM Corp.

IBM Corp. - Overview
IBM Corp. - Business segments
IBM Corp. - Key news
IBM Corp. - Key offerings
IBM Corp. - Segment focus
SWOT

15.10 Kissflow Inc.

Kissflow Inc. - Overview
Kissflow Inc. - Product / Service
Kissflow Inc. - Key offerings
SWOT

15.11 Microsoft Corp.

Microsoft Corp. - Overview
Microsoft Corp. - Business segments
Microsoft Corp. - Key news
Microsoft Corp. - Key offerings
Microsoft Corp. - Segment focus
SWOT

15.12 Oracle Corp.

Oracle Corp. - Overview
Oracle Corp. - Business segments
Oracle Corp. - Key news
Oracle Corp. - Key offerings
Oracle Corp. - Segment focus
SWOT

15.13 PagerDuty Inc.

PagerDuty Inc. - Overview
PagerDuty Inc. - Product / Service
PagerDuty Inc. - Key offerings
SWOT

15.14 Pipefy Inc.

Pipefy Inc. - Overview
Pipefy Inc. - Product / Service
Pipefy Inc. - Key offerings
SWOT

15.15 SAP SE

SAP SE - Overview
SAP SE - Business segments
SAP SE - Key news
SAP SE - Key offerings
SAP SE - Segment focus
SWOT

15.16 UiPath Inc.

UiPath Inc. - Overview
UiPath Inc. - Product / Service
UiPath Inc. - Key news
UiPath Inc. - Key offerings
SWOT

15.17 Zapier Inc.

Zapier Inc. - Overview
Zapier Inc. - Product / Service
Zapier Inc. - Key offerings
SWOT

15.18 Zoho Corp. Pvt. Ltd.

Zoho Corp. Pvt. Ltd. - Overview
Zoho Corp. Pvt. Ltd. - Product / Service
Zoho Corp. Pvt. Ltd. - Key news
Zoho Corp. Pvt. Ltd. - Key offerings
SWOT

16. Appendix

16.1 Scope of the report

Market definition
Objectives
Notes and caveats

16.2 Inclusions and exclusions checklist

Inclusions checklist
Exclusions checklist

16.3 Currency conversion rates for US$

16.4 Research methodology

16.5 Data procurement

Information sources

16.6 Data validation

16.7 Validation techniques employed for market sizing

16.8 Data synthesis

16.9 360 degree market analysis

16.10 List of abbreviations

Research Methodology

Technavio presents a detailed picture of the market by way of study, synthesis, and summation of data from multiple sources. The analysts have presented the various facets of the market with a particular focus on identifying the key industry influencers. The data thus presented is comprehensive, reliable, and the result of extensive research, both primary and secondary.

INFORMATION SOURCES

Primary sources

  • Manufacturers and suppliers
  • Channel partners
  • Industry experts
  • Strategic decision makers

Secondary sources

  • Industry journals and periodicals
  • Government data
  • Financial reports of key industry players
  • Historical data
  • Press releases

DATA ANALYSIS

Data Synthesis

  • Collation of data
  • Estimation of key figures
  • Analysis of derived insights

Data Validation

  • Triangulation with data models
  • Reference against proprietary databases
  • Corroboration with industry experts

REPORT WRITING

Qualitative

  • Market drivers
  • Market challenges
  • Market trends
  • Five forces analysis

Quantitative

  • Market size and forecast
  • Market segmentation
  • Geographical insights
  • Competitive landscape

Interested in this report?

Get your sample now to see our research methodology and insights!

Download Now

Frequently Asked Questions

IT Workflow Automation Platforms (non-itsm) market growth will increase by USD 15758.3 million during 2026-2030.

The IT Workflow Automation Platforms (non-itsm) market is expected to grow at a CAGR of 13.7% during 2026-2030.

IT Workflow Automation Platforms (non-itsm) market is segmented by Component (Solutions, Services) Deployment (Cloud based, On premises) End-user (BFSI, Healthcare, Retail and e-commerce, Manufacturing, Others)

airSlate Inc., Appian Corp., Atlassian Corp., BMC Software Inc., Boomi LP, Celonis SE, IBM Corp., Kissflow Inc., Microsoft Corp., MuleSoft, Nintex Global Ltd., Oracle Corp., PagerDuty Inc., Pipefy Inc., SAP SE, ServiceNow Inc., UiPath Inc., Workato Inc., Zapier Inc., Zoho Corp. Pvt. Ltd. are a few of the key vendors in the IT Workflow Automation Platforms (non-itsm) market.

North America will register the highest growth rate of 43.9% among the other regions. Therefore, the IT Workflow Automation Platforms (non-itsm) market in North America is expected to garner significant business opportunities for the vendors during the forecast period.

US, Canada, Mexico, Germany, UK, France, Italy, The Netherlands, Spain, China, Japan, India, South Korea, Australia, Indonesia, Saudi Arabia, UAE, South Africa, Israel, Turkey, Brazil, Argentina, Colombia

  • Escalating complexity of multi-cloud and hybrid infrastructure environments is the driving factor this market.

The IT Workflow Automation Platforms (non-itsm) market vendors should focus on grabbing business opportunities from the Component segment as it accounted for the largest market share in the base year.
RIA - Research AI Assistant
Ask RIA