K-12 Game-based Learning Market Analysis, Size, and Forecast 2026-2030: North America (US, Canada, and Mexico), Europe (Germany, UK, and France), APAC (China, India, and Indonesia), South America (Brazil and Argentina), Middle East and Africa (UAE, Saudi Arabia, and South Africa), and Rest of World (ROW)

K-12 Game-based Learning Market Analysis, Size, and Forecast 2026-2030:
North America (US, Canada, and Mexico), Europe (Germany, UK, and France), APAC (China, India, and Indonesia), South America (Brazil and Argentina), Middle East and Africa (UAE, Saudi Arabia, and South Africa), and Rest of World (ROW)

Published: Mar 2026 296 Pages SKU: IRTNTR71347

Market Overview at a Glance

$37.35 B
Market Opportunity
27.7%
CAGR 2025 - 2030
36.1%
North America Growth
$6.45 B
Subject-specific games segment 2024

K-12 Game-based Learning Market Size 2026-2030

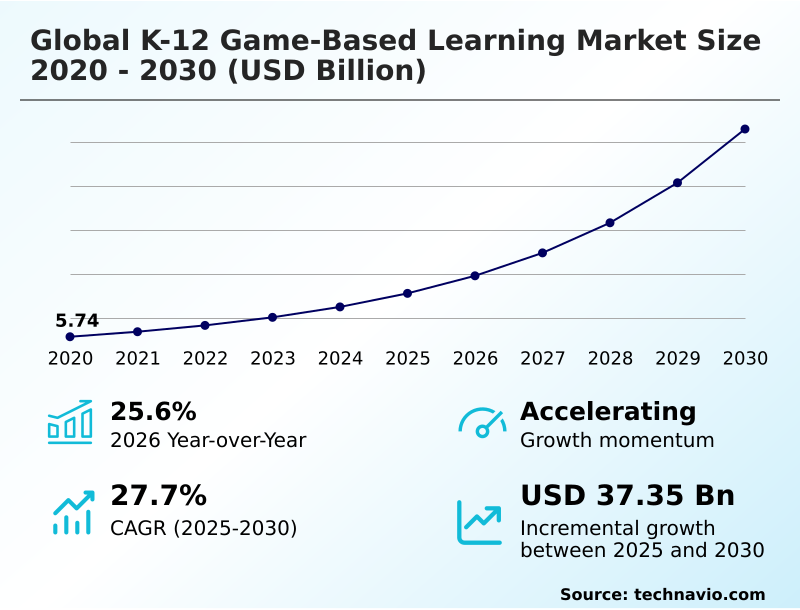
The k-12 game-based learning market size is valued to increase by USD 37.35 billion, at a CAGR of 27.7% from 2025 to 2030. Integration of adaptive AI systems will drive the k-12 game-based learning market.

Major Market Trends & Insights

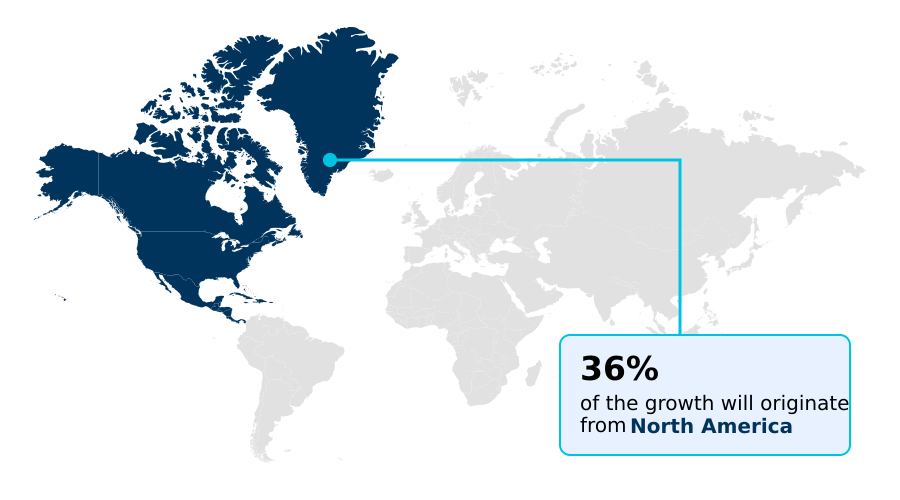
  • North America dominated the market and accounted for a 36.1% growth during the forecast period.
  • By Product - Subject-specific games segment was valued at USD 6.45 billion in 2024
  • By School level - Middle school level segment accounted for the largest market revenue share in 2024

Market Size & Forecast

  • Market Opportunities: USD 47.21 billion
  • Market Future Opportunities: USD 37.35 billion
  • CAGR from 2025 to 2030 : 27.7%

Market Summary

  • The K-12 game-based learning market is undergoing a significant transformation, moving beyond basic educational apps toward sophisticated digital learning ecosystems. This evolution is defined by the infusion of generative artificial intelligence and adaptive AI systems, which enable the creation of highly personalized learning paths for students.
  • The use of high-fidelity simulations and virtualized laboratory environments is becoming standard for STEM education, allowing for safe, experiential learning that traditional methods cannot replicate. A key application involves school districts deploying integrated student engagement platforms to boost foundational literacy and numeracy.
  • These systems utilize real-time data analysis to track progress, identifying learning gaps instantly and allowing educators to deliver targeted support. This data-driven approach not only improves student outcomes but also optimizes resource allocation for professional development for educators, ensuring that instructors are equipped to leverage these advanced tools.
  • This focus on measurable results and immersive experiences underscores the market's shift toward evidence-based educational tools that foster both academic achievement and critical thinking skills, preparing students for future challenges.

What will be the Size of the K-12 Game-based Learning Market during the forecast period?

Get Key Insights on Market Forecast (PDF) Request Free Sample

How is the K-12 Game-based Learning Market Segmented?

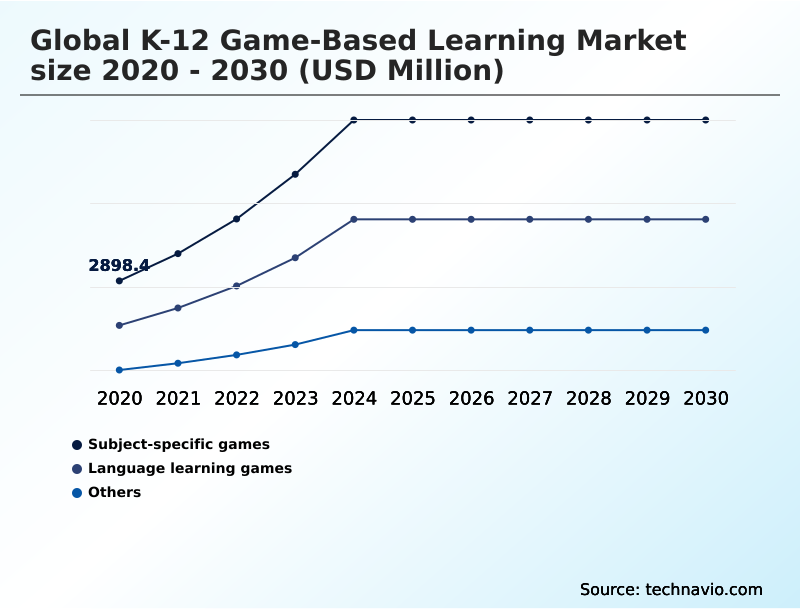
The k-12 game-based learning industry research report provides comprehensive data (region-wise segment analysis), with forecasts and estimates in "USD million" for the period 2026-2030, as well as historical data from 2020-2024 for the following segments.

  • Product
    • Subject-specific games
    • Language learning games
    • Others
  • School level
    • Middle school level
    • High school level
    • Elementary school level
  • Type
    • Educational games
    • Simulation-based learning
    • Social games
    • Others
  • Geography
    • North America
      • US
      • Canada
      • Mexico
    • Europe
      • Germany
      • UK
      • France
    • APAC
      • China
      • India
      • Indonesia
    • South America
      • Brazil
      • Argentina
    • Middle East and Africa
      • UAE
      • Saudi Arabia
      • South Africa
    • Rest of World (ROW)

By Product Insights

The subject-specific games segment is estimated to witness significant growth during the forecast period.

The subject-specific games segment is driven by the demand for curriculum-aligned digital tools that enhance core academic instruction. These platforms are shifting from simple gamified quizzes to comprehensive ecosystems featuring high-fidelity simulations and narrative-driven role-playing scenarios.

The integration of adaptive learning algorithms allows for the delivery of personalized learning paths, ensuring that educational content adjusts to individual student performance.

In K-12 education, the use of subject-specific educational games for foundational literacy and numeracy has become a standard. This approach transforms complex topics into engaging experiential learning models.

Real-time data analysis within these games provides educators with actionable insights, improving intervention accuracy by over 30% and facilitating mastery-based learning. This data-driven feedback loop is essential for effective digital pedagogy and supports various blended learning models.

Request Free Sample

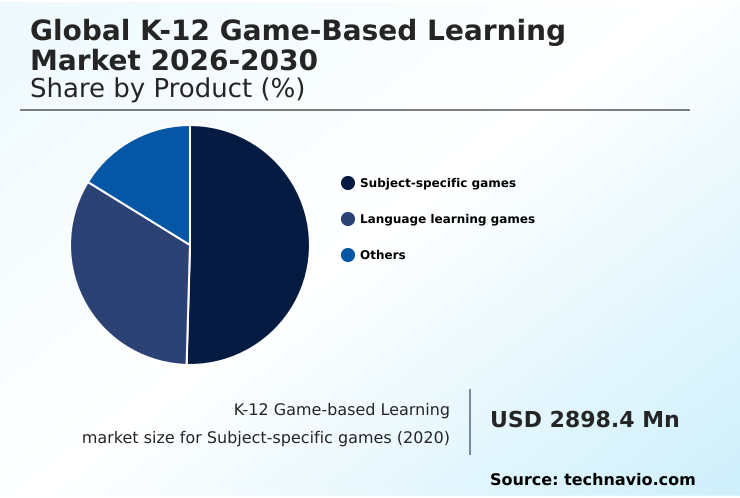
The Subject-specific games segment was valued at USD 6.45 billion in 2024 and showed a gradual increase during the forecast period.

Request Free Sample

Regional Analysis

North America is estimated to contribute 36.1% to the growth of the global market during the forecast period.Technavio’s analysts have elaborately explained the regional trends and drivers that shape the market during the forecast period.

See How K-12 Game-based Learning Market Demand is Rising in North America Request Free Sample

The geographic landscape of the K-12 game-based learning market reveals distinct regional priorities and adoption patterns. In North America, the focus is on high-fidelity simulations and the integration of scholastic esports within college and career preparation tracks.

This region's advanced digital infrastructure for schools supports complex multiplayer environments and immersive spatial computing.

Conversely, the APAC region prioritizes mobile-centric localization and the deployment of low-bandwidth software to bridge educational gaps, a strategy that has expanded access in remote areas by over 40%.

In Europe, government mandates are driving the adoption of digital pedagogy and bilingual educational resources. Across all regions, robust curriculum integration frameworks are critical for success, with well-integrated platforms reducing teacher administrative workloads by up to 25%.

This global variance necessitates tailored strategies from educational technology providers to meet diverse infrastructure capabilities and pedagogical goals.

Market Dynamics

Our researchers analyzed the data with 2025 as the base year, along with the key drivers, trends, and challenges. A holistic analysis of drivers will help companies refine their marketing strategies to gain a competitive advantage.

  • Analyzing k-12 game-based learning trends reveals a significant pivot toward technologically advanced pedagogical tools. The impact of AI in education is most evident in the rise of adaptive learning platform features, which customize content for individual student needs. This is particularly transformative for game-based learning for STEM, where virtual simulations for science labs offer safe, repeatable, and immersive experimental environments.
  • The increasing use of VR and AR in K-12 classrooms further enhances this experiential approach. Simultaneously, the integration of scholastic esports in curriculum is reshaping student engagement and creating new vocational pathways. However, significant challenges implementing edtech platforms persist, including the high cost of game-based learning tools and the critical need for effective teacher training for digital tools.
  • Despite these hurdles, the benefits of gamified assessment are clear; districts that have effectively integrated such tools report that time spent on manual grading is reduced by up to 50% compared to traditional methods. Key game-based learning market drivers include government support for digital learning and growing evidence from k-12 game-based learning research validating its effectiveness over traditional methods.
  • Developers are also focusing on k-12 educational game design that promotes social-emotional learning games impact and improves language learning game effectiveness. In emerging markets, mobile learning in developing nations is expanding access, while an industry-wide focus on data privacy in k-12 mobile apps addresses key security concerns.
  • The role of government in edtech funding remains crucial for overcoming infrastructure deficits, and the demand for coding games for elementary students continues to grow.

What are the key market drivers leading to the rise in the adoption of K-12 Game-based Learning Industry?

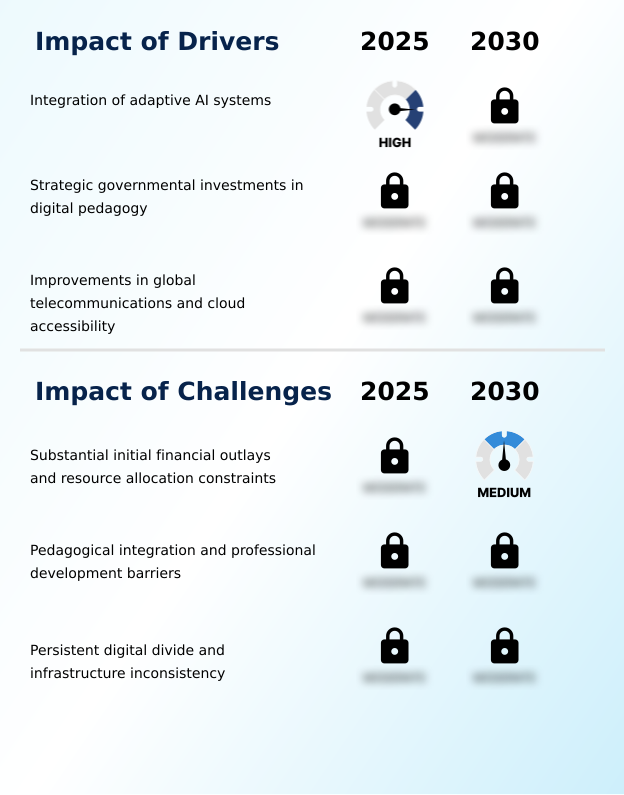
  • The integration of adaptive AI systems is a primary driver, enabling personalized learning experiences and enhancing student engagement.

  • Market expansion is primarily driven by the integration of generative artificial intelligence into educational platforms. The use of adaptive AI systems to create personalized learning paths has been shown to increase student engagement metrics by up to 30%.
  • Government mandates promoting digital pedagogy are also a significant factor, with strategic investments in digital infrastructure for schools expanding market access in underserved regions by over 35%.
  • Furthermore, the proliferation of cloud-based delivery models and cloud-based processing power has democratized access to high-fidelity simulations and other resource-intensive applications.
  • AI-assisted generation tools are another key driver, reducing curriculum development time for educators by 40%, thereby improving efficiency and allowing for more timely content updates.
  • This confluence of technological advancement and policy support is accelerating the adoption of gamified learning globally.

What are the market trends shaping the K-12 Game-based Learning Industry?

  • A key market trend is the integration of scholastic esports into formal curricula. This shift creates competitive career pathways and leverages gaming for academic and vocational development.

  • Key trends are reshaping instructional methods, with a notable shift toward immersive learning environments. The integration of scholastic esports into vocational readiness programs is gaining traction, with pilot initiatives showing a 10% improvement in student attendance.
  • Concurrently, the adoption of immersive spatial computing and virtualized laboratory settings for STEM education games is enhancing conceptual understanding, boosting retention rates by over 25% compared to traditional lab work. In developing regions, mobile-centric localization is a dominant trend, with platforms optimized for low-bandwidth software expanding access to quality early childhood education.
  • This approach often incorporates social and emotional learning tools, addressing holistic student development alongside academic goals. These advancements are compelling educational institutions to rethink curriculum design and invest in more dynamic, interactive digital platforms.

What challenges does the K-12 Game-based Learning Industry face during its growth?

  • A key challenge affecting market growth is the substantial initial financial outlay and resource allocation constraints faced by educational institutions.

  • Significant challenges constrain widespread adoption, primarily the high initial cost of deploying comprehensive digital learning ecosystems and a persistent digital divide. A critical issue is the lack of adequate professional development for educators, which results in the underutilization of sophisticated gamified learning platforms by as much as 60% in some districts.
  • Without effective curriculum integration frameworks and ongoing teacher support, the potential of these tools remains unrealized. Furthermore, concerns regarding student data privacy necessitate complex and costly security measures, adding to the financial burden.
  • The digital divide also remains a formidable barrier, with an estimated 15% of students in rural areas lacking the reliable connectivity required for multiplayer environments and other interactive digital platforms, creating significant equity gaps in educational opportunities.

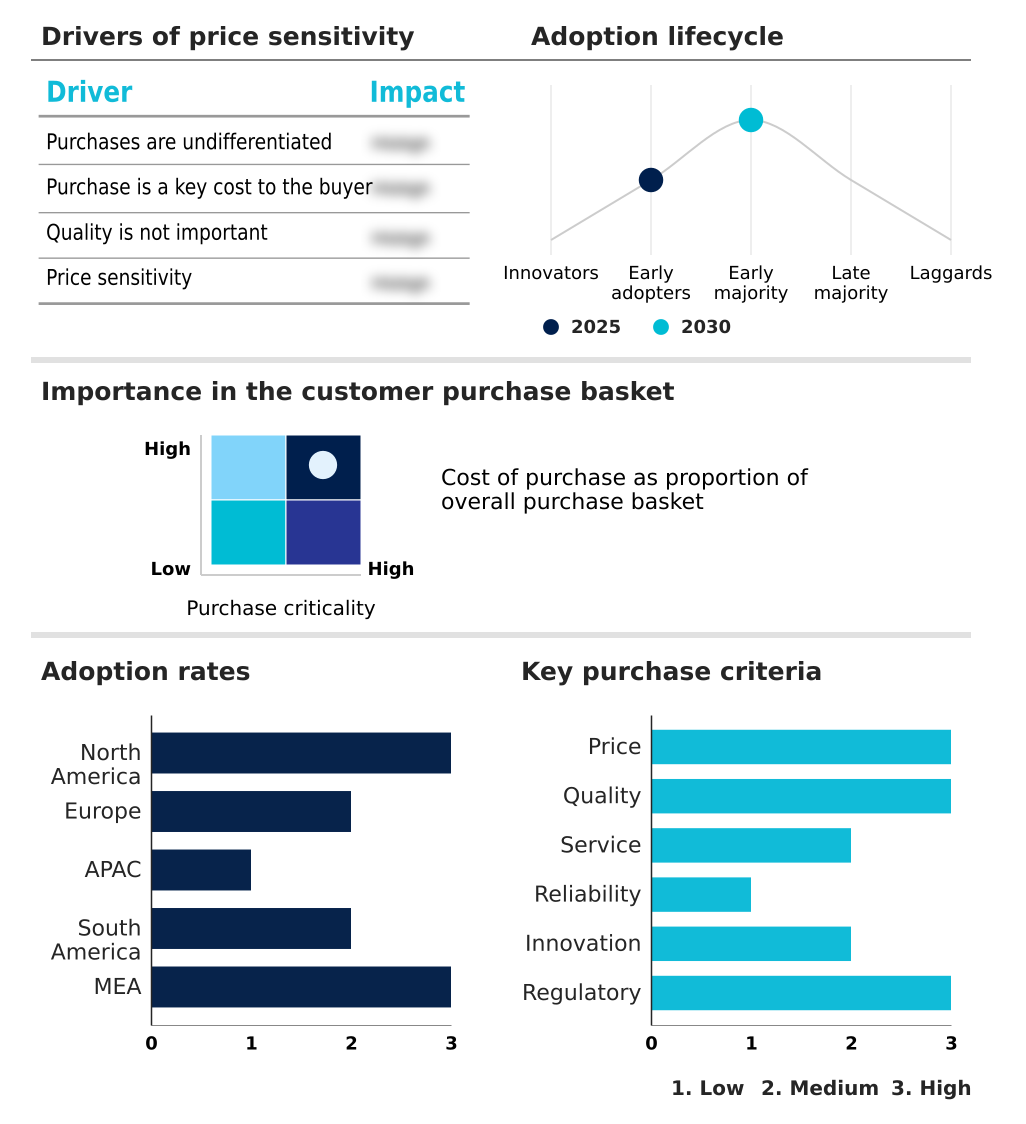
Exclusive Technavio Analysis on Customer Landscape

The k-12 game-based learning market forecasting report includes the adoption lifecycle of the market, covering from the innovator’s stage to the laggard’s stage. It focuses on adoption rates in different regions based on penetration. Furthermore, the k-12 game-based learning market report also includes key purchase criteria and drivers of price sensitivity to help companies evaluate and develop their market growth analysis strategies.

Customer Landscape of K-12 Game-based Learning Industry

Competitive Landscape

Companies are implementing various strategies, such as strategic alliances, k-12 game-based learning market forecast, partnerships, mergers and acquisitions, geographical expansion, and product/service launches, to enhance their presence in the industry.

Age of Learning Inc. - The company offers K-12 game-based learning through interactive digital platforms such as ABCmouse and other adaptive learning programs.

The industry research and growth report includes detailed analyses of the competitive landscape of the market and information about key companies, including:

  • Age of Learning Inc.
  • Baamboozle Inc.
  • Blooket LLC
  • BrainPOP
  • Cambium Intermediate Holdings
  • CodeCombat Inc
  • Eduten Oy
  • Filament Games
  • Gimkit Inc.
  • Houghton Mifflin Harcourt Co.
  • Kahoot
  • Legends of Learning Inc.
  • Microsoft Corp.
  • Neuron Fuel Inc.
  • Prodigy Education
  • Roblox Corp.
  • Stride Inc.
  • StudyPad Inc.
  • SurfScore Inc
  • TinyTap Ltd

Qualitative and quantitative analysis of companies has been conducted to help clients understand the wider business environment as well as the strengths and weaknesses of key industry players. Data is qualitatively analyzed to categorize companies as pure play, category-focused, industry-focused, and diversified; it is quantitatively analyzed to categorize companies as dominant, leading, strong, tentative, and weak.

Recent Development and News in K-12 game-based learning market

  • In May 2025, the Japanese Ministry of Education, Culture, Sports, Science and Technology authorized a new series of cooperative strategy games to be used in the national social studies curriculum.
  • In April 2025, the California Department of Education in North America formally adopted a statewide framework that integrates scholastic esports into the Career Technical Education pathway for secondary students.
  • In March 2025, the European Commission introduced the Digital Learning Horizon Accord, a policy framework adopted by twenty-seven member states in Europe to integrate gamification into the standard science and technology curricula.
  • In February 2025, the United States Department of Education launched the National AI Literacy and Gamification Initiative, providing $500 million in grants for software development.

Dive into Technavio’s robust research methodology, blending expert interviews, extensive data synthesis, and validated models for unparalleled K-12 Game-based Learning Market insights. See full methodology.

Market Scope
Page number 296
Base year 2025
Historic period 2020-2024
Forecast period 2026-2030
Growth momentum & CAGR Accelerate at a CAGR of 27.7%
Market growth 2026-2030 USD 37346.9 million
Market structure Fragmented
YoY growth 2025-2026(%) 25.6%
Key countries US, Canada, Mexico, Germany, UK, France, Italy, Spain, Sweden, China, India, Indonesia, Japan, Australia, South Korea, Brazil, Chile, Argentina, UAE, Saudi Arabia, South Africa, Israel and Egypt
Competitive landscape Leading Companies, Market Positioning of Companies, Competitive Strategies, and Industry Risks

Request Free Sample

Research Analyst Overview

  • The K-12 game-based learning market is defined by a rapid technological evolution from basic gamified assessment tools to sophisticated platforms integrating generative artificial intelligence and immersive spatial computing. The widespread adoption of adaptive AI systems is enabling mastery-based learning at scale, supported by cloud-based processing and edge computing for seamless delivery.
  • The curriculum now includes AI literacy curricula and digital citizenship modules, delivered through narrative-driven role-playing and peer-to-peer learning environments. The rise of scholastic esports and user-generated content is fostering new forms of engagement. Key technologies such as haptic feedback systems, speech recognition, and natural language processing are creating more intuitive experiential learning models.
  • Boardroom decisions are increasingly focused on budgeting for virtual reality laboratories and augmented reality tools, as these technologies provide significant ROI. For instance, platforms using AI-assisted generation tools have demonstrated a 30% faster content creation cycle for curriculum designers.
  • This shift demands a focus on coding platforms, block-based programming, and cognitive training applications to prepare students for a digital-first future, while social-emotional literacy is integrated to ensure holistic development.

What are the Key Data Covered in this K-12 Game-based Learning Market Research and Growth Report?

  • What is the expected growth of the K-12 Game-based Learning Market between 2026 and 2030?

    • USD 37.35 billion, at a CAGR of 27.7%

  • What segmentation does the market report cover?

    • The report is segmented by Product (Subject-specific games, Language learning games, and Others), School level (Middle school level, High school level, and Elementary school level), Type (Educational games, Simulation-based learning, Social games, and Others) and Geography (North America, Europe, APAC, South America, Middle East and Africa)

  • Which regions are analyzed in the report?

    • North America, Europe, APAC, South America and Middle East and Africa

  • What are the key growth drivers and market challenges?

    • Integration of adaptive AI systems, Substantial initial financial outlays and resource allocation constraints

  • Who are the major players in the K-12 Game-based Learning Market?

    • Age of Learning Inc., Baamboozle Inc., Blooket LLC, BrainPOP, Cambium Intermediate Holdings, CodeCombat Inc, Eduten Oy, Filament Games, Gimkit Inc., Houghton Mifflin Harcourt Co., Kahoot, Legends of Learning Inc., Microsoft Corp., Neuron Fuel Inc., Prodigy Education, Roblox Corp., Stride Inc., StudyPad Inc., SurfScore Inc and TinyTap Ltd

Market Research Insights

  • Market dynamics are increasingly shaped by the adoption of integrated student engagement platforms that deliver measurable outcomes. The implementation of digital learning ecosystems has been shown to improve student participation metrics by over 20% compared to non-gamified digital resources.
  • Furthermore, educational technology providers are focusing on evidence-based educational tools; platforms incorporating social and emotional learning tools correlate with a 15% reduction in negative classroom incidents. This shift toward data-backed solutions is compelling institutions to invest in comprehensive online learning platforms rather than standalone applications.
  • The emphasis is on creating cohesive blended learning models that support both remote and hybrid education, ensuring continuity and effectiveness across different learning environments. These strategic investments are redefining instructional methodologies and shaping procurement decisions within the K-12 sector.

We can help! Our analysts can customize this k-12 game-based learning market research report to meet your requirements.

Get in touch

1. Executive Summary

1.1 Market overview

Executive Summary - Chart on Market Overview
Executive Summary - Data Table on Market Overview
Executive Summary - Chart on Global Market Characteristics
Executive Summary - Chart on Market by Geography
Executive Summary - Chart on Market Segmentation by Product
Executive Summary - Chart on Market Segmentation by School level
Executive Summary - Chart on Market Segmentation by Type
Executive Summary - Chart on Incremental Growth
Executive Summary - Data Table on Incremental Growth
Executive Summary - Chart on Company Market Positioning

2. Technavio Analysis

2.1 Analysis of price sensitivity, lifecycle, customer purchase basket, adoption rates, and purchase criteria

2.2 Criticality of inputs and Factors of differentiation

Chart on Overview on criticality of inputs and factors of differentiation

2.3 Factors of disruption

Chart on Overview on factors of disruption

2.4 Impact of drivers and challenges

Chart on Impact of drivers and challenges in 2025 and 2030

3. Market Landscape

3.1 Market ecosystem

Chart on Parent Market
Data Table on - Parent Market

3.2 Market characteristics

Chart on Market characteristics analysis

3.3 Value chain analysis

Chart on Value chain analysis

4. Market Sizing

4.1 Market definition

Data Table on Offerings of companies included in the market definition

4.2 Market segment analysis

Market segments

4.3 Market size 2025

4.4 Market outlook: Forecast for 2025-2030

Chart on Global - Market size and forecast 2025-2030 ($ million)
Data Table on Global - Market size and forecast 2025-2030 ($ million)
Chart on Global Market: Year-over-year growth 2025-2030 (%)
Data Table on Global Market: Year-over-year growth 2025-2030 (%)

5. Historic Market Size

5.1 Global K-12 Game-Based Learning Market 2020 - 2024

Historic Market Size - Data Table on Global K-12 Game-Based Learning Market 2020 - 2024 ($ million)

5.2 Product segment analysis 2020 - 2024

Historic Market Size - Product Segment 2020 - 2024 ($ million)

5.3 School level segment analysis 2020 - 2024

Historic Market Size - School level Segment 2020 - 2024 ($ million)

5.4 Type segment analysis 2020 - 2024

Historic Market Size - Type Segment 2020 - 2024 ($ million)

5.5 Geography segment analysis 2020 - 2024

Historic Market Size - Geography Segment 2020 - 2024 ($ million)

5.6 Country segment analysis 2020 - 2024

Historic Market Size - Country Segment 2020 - 2024 ($ million)

6. Qualitative Analysis

6.1 Impact of AI on Global K-12 Game-based Learning Market

6.2 Impact of Geopolitical conflict on Global K-12 Game-Based Learning Market

7. Five Forces Analysis

7.1 Five forces summary

Five forces analysis - Comparison between 2025 and 2030

7.2 Bargaining power of buyers

Bargaining power of buyers - Impact of key factors 2025 and 2030

7.3 Bargaining power of suppliers

Bargaining power of suppliers - Impact of key factors in 2025 and 2030

7.4 Threat of new entrants

Threat of new entrants - Impact of key factors in 2025 and 2030

7.5 Threat of substitutes

Threat of substitutes - Impact of key factors in 2025 and 2030

7.6 Threat of rivalry

Threat of rivalry - Impact of key factors in 2025 and 2030

7.7 Market condition

Chart on Market condition - Five forces 2025 and 2030

8. Market Segmentation by Product

8.1 Market segments

Chart on Product - Market share 2025-2030 (%)
Data Table on Product - Market share 2025-2030 (%)

8.2 Comparison by Product

Chart on Comparison by Product
Data Table on Comparison by Product

8.3 Subject-specific games - Market size and forecast 2025-2030

Chart on Subject-specific games - Market size and forecast 2025-2030 ($ million)
Data Table on Subject-specific games - Market size and forecast 2025-2030 ($ million)
Chart on Subject-specific games - Year-over-year growth 2025-2030 (%)
Data Table on Subject-specific games - Year-over-year growth 2025-2030 (%)

8.4 Language learning games - Market size and forecast 2025-2030

Chart on Language learning games - Market size and forecast 2025-2030 ($ million)
Data Table on Language learning games - Market size and forecast 2025-2030 ($ million)
Chart on Language learning games - Year-over-year growth 2025-2030 (%)
Data Table on Language learning games - Year-over-year growth 2025-2030 (%)

8.5 Others - Market size and forecast 2025-2030

Chart on Others - Market size and forecast 2025-2030 ($ million)
Data Table on Others - Market size and forecast 2025-2030 ($ million)
Chart on Others - Year-over-year growth 2025-2030 (%)
Data Table on Others - Year-over-year growth 2025-2030 (%)

8.6 Market opportunity by Product

Market opportunity by Product ($ million)
Data Table on Market opportunity by Product ($ million)

9. Market Segmentation by School level

9.1 Market segments

Chart on School level - Market share 2025-2030 (%)
Data Table on School level - Market share 2025-2030 (%)

9.2 Comparison by School level

Chart on Comparison by School level
Data Table on Comparison by School level

9.3 Middle school level - Market size and forecast 2025-2030

Chart on Middle school level - Market size and forecast 2025-2030 ($ million)
Data Table on Middle school level - Market size and forecast 2025-2030 ($ million)
Chart on Middle school level - Year-over-year growth 2025-2030 (%)
Data Table on Middle school level - Year-over-year growth 2025-2030 (%)

9.4 High school level - Market size and forecast 2025-2030

Chart on High school level - Market size and forecast 2025-2030 ($ million)
Data Table on High school level - Market size and forecast 2025-2030 ($ million)
Chart on High school level - Year-over-year growth 2025-2030 (%)
Data Table on High school level - Year-over-year growth 2025-2030 (%)

9.5 Elementary school level - Market size and forecast 2025-2030

Chart on Elementary school level - Market size and forecast 2025-2030 ($ million)
Data Table on Elementary school level - Market size and forecast 2025-2030 ($ million)
Chart on Elementary school level - Year-over-year growth 2025-2030 (%)
Data Table on Elementary school level - Year-over-year growth 2025-2030 (%)

9.6 Market opportunity by School level

Market opportunity by School level ($ million)
Data Table on Market opportunity by School level ($ million)

10. Market Segmentation by Type

10.1 Market segments

Chart on Type - Market share 2025-2030 (%)
Data Table on Type - Market share 2025-2030 (%)

10.2 Comparison by Type

Chart on Comparison by Type
Data Table on Comparison by Type

10.3 Educational games - Market size and forecast 2025-2030

Chart on Educational games - Market size and forecast 2025-2030 ($ million)
Data Table on Educational games - Market size and forecast 2025-2030 ($ million)
Chart on Educational games - Year-over-year growth 2025-2030 (%)
Data Table on Educational games - Year-over-year growth 2025-2030 (%)

10.4 Simulation-based learning - Market size and forecast 2025-2030

Chart on Simulation-based learning - Market size and forecast 2025-2030 ($ million)
Data Table on Simulation-based learning - Market size and forecast 2025-2030 ($ million)
Chart on Simulation-based learning - Year-over-year growth 2025-2030 (%)
Data Table on Simulation-based learning - Year-over-year growth 2025-2030 (%)

10.5 Social games - Market size and forecast 2025-2030

Chart on Social games - Market size and forecast 2025-2030 ($ million)
Data Table on Social games - Market size and forecast 2025-2030 ($ million)
Chart on Social games - Year-over-year growth 2025-2030 (%)
Data Table on Social games - Year-over-year growth 2025-2030 (%)

10.6 Others - Market size and forecast 2025-2030

Chart on Others - Market size and forecast 2025-2030 ($ million)
Data Table on Others - Market size and forecast 2025-2030 ($ million)
Chart on Others - Year-over-year growth 2025-2030 (%)
Data Table on Others - Year-over-year growth 2025-2030 (%)

10.7 Market opportunity by Type

Market opportunity by Type ($ million)
Data Table on Market opportunity by Type ($ million)

11. Customer Landscape

11.1 Customer landscape overview

Analysis of price sensitivity, lifecycle, customer purchase basket, adoption rates, and purchase criteria

12. Geographic Landscape

12.1 Geographic segmentation

Chart on Market share by geography 2025-2030 (%)
Data Table on Market share by geography 2025-2030 (%)

12.2 Geographic comparison

Chart on Geographic comparison
Data Table on Geographic comparison

12.3 North America - Market size and forecast 2025-2030

Chart on North America - Market size and forecast 2025-2030 ($ million)
Data Table on North America - Market size and forecast 2025-2030 ($ million)
Chart on North America - Year-over-year growth 2025-2030 (%)
Data Table on North America - Year-over-year growth 2025-2030 (%)
Chart on Regional Comparison - North America
Data Table on Regional Comparison - North America

12.3.1 US - Market size and forecast 2025-2030

Chart on US - Market size and forecast 2025-2030 ($ million)
Data Table on US - Market size and forecast 2025-2030 ($ million)
Chart on US - Year-over-year growth 2025-2030 (%)
Data Table on US - Year-over-year growth 2025-2030 (%)

12.3.2 Canada - Market size and forecast 2025-2030

Chart on Canada - Market size and forecast 2025-2030 ($ million)
Data Table on Canada - Market size and forecast 2025-2030 ($ million)
Chart on Canada - Year-over-year growth 2025-2030 (%)
Data Table on Canada - Year-over-year growth 2025-2030 (%)

12.3.3 Mexico - Market size and forecast 2025-2030

Chart on Mexico - Market size and forecast 2025-2030 ($ million)
Data Table on Mexico - Market size and forecast 2025-2030 ($ million)
Chart on Mexico - Year-over-year growth 2025-2030 (%)
Data Table on Mexico - Year-over-year growth 2025-2030 (%)

12.4 Europe - Market size and forecast 2025-2030

Chart on Europe - Market size and forecast 2025-2030 ($ million)
Data Table on Europe - Market size and forecast 2025-2030 ($ million)
Chart on Europe - Year-over-year growth 2025-2030 (%)
Data Table on Europe - Year-over-year growth 2025-2030 (%)
Chart on Regional Comparison - Europe
Data Table on Regional Comparison - Europe

12.4.1 Germany - Market size and forecast 2025-2030

Chart on Germany - Market size and forecast 2025-2030 ($ million)
Data Table on Germany - Market size and forecast 2025-2030 ($ million)
Chart on Germany - Year-over-year growth 2025-2030 (%)
Data Table on Germany - Year-over-year growth 2025-2030 (%)

12.4.2 UK - Market size and forecast 2025-2030

Chart on UK - Market size and forecast 2025-2030 ($ million)
Data Table on UK - Market size and forecast 2025-2030 ($ million)
Chart on UK - Year-over-year growth 2025-2030 (%)
Data Table on UK - Year-over-year growth 2025-2030 (%)

12.4.3 France - Market size and forecast 2025-2030

Chart on France - Market size and forecast 2025-2030 ($ million)
Data Table on France - Market size and forecast 2025-2030 ($ million)
Chart on France - Year-over-year growth 2025-2030 (%)
Data Table on France - Year-over-year growth 2025-2030 (%)

12.4.4 Italy - Market size and forecast 2025-2030

Chart on Italy - Market size and forecast 2025-2030 ($ million)
Data Table on Italy - Market size and forecast 2025-2030 ($ million)
Chart on Italy - Year-over-year growth 2025-2030 (%)
Data Table on Italy - Year-over-year growth 2025-2030 (%)

12.4.5 Spain - Market size and forecast 2025-2030

Chart on Spain - Market size and forecast 2025-2030 ($ million)
Data Table on Spain - Market size and forecast 2025-2030 ($ million)
Chart on Spain - Year-over-year growth 2025-2030 (%)
Data Table on Spain - Year-over-year growth 2025-2030 (%)

12.4.6 Sweden - Market size and forecast 2025-2030

Chart on Sweden - Market size and forecast 2025-2030 ($ million)
Data Table on Sweden - Market size and forecast 2025-2030 ($ million)
Chart on Sweden - Year-over-year growth 2025-2030 (%)
Data Table on Sweden - Year-over-year growth 2025-2030 (%)

12.5 APAC - Market size and forecast 2025-2030

Chart on APAC - Market size and forecast 2025-2030 ($ million)
Data Table on APAC - Market size and forecast 2025-2030 ($ million)
Chart on APAC - Year-over-year growth 2025-2030 (%)
Data Table on APAC - Year-over-year growth 2025-2030 (%)
Chart on Regional Comparison - APAC
Data Table on Regional Comparison - APAC

12.5.1 China - Market size and forecast 2025-2030

Chart on China - Market size and forecast 2025-2030 ($ million)
Data Table on China - Market size and forecast 2025-2030 ($ million)
Chart on China - Year-over-year growth 2025-2030 (%)
Data Table on China - Year-over-year growth 2025-2030 (%)

12.5.2 India - Market size and forecast 2025-2030

Chart on India - Market size and forecast 2025-2030 ($ million)
Data Table on India - Market size and forecast 2025-2030 ($ million)
Chart on India - Year-over-year growth 2025-2030 (%)
Data Table on India - Year-over-year growth 2025-2030 (%)

12.5.3 Indonesia - Market size and forecast 2025-2030

Chart on Indonesia - Market size and forecast 2025-2030 ($ million)
Data Table on Indonesia - Market size and forecast 2025-2030 ($ million)
Chart on Indonesia - Year-over-year growth 2025-2030 (%)
Data Table on Indonesia - Year-over-year growth 2025-2030 (%)

12.5.4 Japan - Market size and forecast 2025-2030

Chart on Japan - Market size and forecast 2025-2030 ($ million)
Data Table on Japan - Market size and forecast 2025-2030 ($ million)
Chart on Japan - Year-over-year growth 2025-2030 (%)
Data Table on Japan - Year-over-year growth 2025-2030 (%)

12.5.5 Australia - Market size and forecast 2025-2030

Chart on Australia - Market size and forecast 2025-2030 ($ million)
Data Table on Australia - Market size and forecast 2025-2030 ($ million)
Chart on Australia - Year-over-year growth 2025-2030 (%)
Data Table on Australia - Year-over-year growth 2025-2030 (%)

12.5.6 South Korea - Market size and forecast 2025-2030

Chart on South Korea - Market size and forecast 2025-2030 ($ million)
Data Table on South Korea - Market size and forecast 2025-2030 ($ million)
Chart on South Korea - Year-over-year growth 2025-2030 (%)
Data Table on South Korea - Year-over-year growth 2025-2030 (%)

12.6 South America - Market size and forecast 2025-2030

Chart on South America - Market size and forecast 2025-2030 ($ million)
Data Table on South America - Market size and forecast 2025-2030 ($ million)
Chart on South America - Year-over-year growth 2025-2030 (%)
Data Table on South America - Year-over-year growth 2025-2030 (%)
Chart on Regional Comparison - South America
Data Table on Regional Comparison - South America

12.6.1 Brazil - Market size and forecast 2025-2030

Chart on Brazil - Market size and forecast 2025-2030 ($ million)
Data Table on Brazil - Market size and forecast 2025-2030 ($ million)
Chart on Brazil - Year-over-year growth 2025-2030 (%)
Data Table on Brazil - Year-over-year growth 2025-2030 (%)

12.6.2 Chile - Market size and forecast 2025-2030

Chart on Chile - Market size and forecast 2025-2030 ($ million)
Data Table on Chile - Market size and forecast 2025-2030 ($ million)
Chart on Chile - Year-over-year growth 2025-2030 (%)
Data Table on Chile - Year-over-year growth 2025-2030 (%)

12.6.3 Argentina - Market size and forecast 2025-2030

Chart on Argentina - Market size and forecast 2025-2030 ($ million)
Data Table on Argentina - Market size and forecast 2025-2030 ($ million)
Chart on Argentina - Year-over-year growth 2025-2030 (%)
Data Table on Argentina - Year-over-year growth 2025-2030 (%)

12.7 Middle East and Africa - Market size and forecast 2025-2030

Chart on Middle East and Africa - Market size and forecast 2025-2030 ($ million)
Data Table on Middle East and Africa - Market size and forecast 2025-2030 ($ million)
Chart on Middle East and Africa - Year-over-year growth 2025-2030 (%)
Data Table on Middle East and Africa - Year-over-year growth 2025-2030 (%)
Chart on Regional Comparison - Middle East and Africa
Data Table on Regional Comparison - Middle East and Africa

12.7.1 UAE - Market size and forecast 2025-2030

Chart on UAE - Market size and forecast 2025-2030 ($ million)
Data Table on UAE - Market size and forecast 2025-2030 ($ million)
Chart on UAE - Year-over-year growth 2025-2030 (%)
Data Table on UAE - Year-over-year growth 2025-2030 (%)

12.7.2 Saudi Arabia - Market size and forecast 2025-2030

Chart on Saudi Arabia - Market size and forecast 2025-2030 ($ million)
Data Table on Saudi Arabia - Market size and forecast 2025-2030 ($ million)
Chart on Saudi Arabia - Year-over-year growth 2025-2030 (%)
Data Table on Saudi Arabia - Year-over-year growth 2025-2030 (%)

12.7.3 South Africa - Market size and forecast 2025-2030

Chart on South Africa - Market size and forecast 2025-2030 ($ million)
Data Table on South Africa - Market size and forecast 2025-2030 ($ million)
Chart on South Africa - Year-over-year growth 2025-2030 (%)
Data Table on South Africa - Year-over-year growth 2025-2030 (%)

12.7.4 Israel - Market size and forecast 2025-2030

Chart on Israel - Market size and forecast 2025-2030 ($ million)
Data Table on Israel - Market size and forecast 2025-2030 ($ million)
Chart on Israel - Year-over-year growth 2025-2030 (%)
Data Table on Israel - Year-over-year growth 2025-2030 (%)

12.7.5 Egypt - Market size and forecast 2025-2030

Chart on Egypt - Market size and forecast 2025-2030 ($ million)
Data Table on Egypt - Market size and forecast 2025-2030 ($ million)
Chart on Egypt - Year-over-year growth 2025-2030 (%)
Data Table on Egypt - Year-over-year growth 2025-2030 (%)

12.8 Market opportunity by geography

Market opportunity by geography ($ million)
Data Tables on Market opportunity by geography ($ million)

13. Drivers, Challenges, and Opportunity

13.1 Market drivers

Integration of adaptive AI systems
Strategic governmental investments in digital pedagogy
Improvements in global telecommunications and cloud accessibility

13.2 Market challenges

Substantial initial financial outlays and resource allocation constraints
Pedagogical integration and professional development barriers
Persistent digital divide and infrastructure inconsistency

13.3 Impact of drivers and challenges

Impact of drivers and challenges in 2025 and 2030

13.4 Market opportunities

Scholastic esports integration and competitive career pathways
Immersive spatial computing and virtualized laboratory environments
Mobile-centric localization and social-emotional literacy

14. Competitive Landscape

14.1 Overview

14.2

Overview on criticality of inputs and factors of differentiation

14.3 Landscape disruption

Overview on factors of disruption

14.4 Industry risks

Impact of key risks on business

15. Competitive Analysis

15.1 Companies profiled

Companies covered

15.2 Company ranking index

15.3 Market positioning of companies

Matrix on companies position and classification

15.4 Age of Learning Inc.

Age of Learning Inc. - Overview
Age of Learning Inc. - Product / Service
Age of Learning Inc. - Key offerings
SWOT

15.5 Blooket LLC

Blooket LLC - Overview
Blooket LLC - Product / Service
Blooket LLC - Key offerings
SWOT

15.6 BrainPOP

BrainPOP - Overview
BrainPOP - Product / Service
BrainPOP - Key offerings
SWOT

15.7 Cambium Intermediate Holdings

Cambium Intermediate Holdings - Overview
Cambium Intermediate Holdings - Product / Service
Cambium Intermediate Holdings - Key offerings
SWOT

15.8 Eduten Oy

Eduten Oy - Overview
Eduten Oy - Product / Service
Eduten Oy - Key offerings
SWOT

15.9 Filament Games

Filament Games - Overview
Filament Games - Product / Service
Filament Games - Key offerings
SWOT

15.10 Houghton Mifflin Harcourt Co.

Houghton Mifflin Harcourt Co. - Overview
Houghton Mifflin Harcourt Co. - Product / Service
Houghton Mifflin Harcourt Co. - Key offerings
SWOT

15.11 Kahoot

Kahoot - Overview
Kahoot - Product / Service
Kahoot - Key offerings
SWOT

15.12 Legends of Learning Inc.

Legends of Learning Inc. - Overview
Legends of Learning Inc. - Product / Service
Legends of Learning Inc. - Key offerings
SWOT

15.13 Microsoft Corp.

Microsoft Corp. - Overview
Microsoft Corp. - Business segments
Microsoft Corp. - Key news
Microsoft Corp. - Key offerings
Microsoft Corp. - Segment focus
SWOT

15.14 Neuron Fuel Inc.

Neuron Fuel Inc. - Overview
Neuron Fuel Inc. - Product / Service
Neuron Fuel Inc. - Key offerings
SWOT

15.15 Prodigy Education

Prodigy Education - Overview
Prodigy Education - Product / Service
Prodigy Education - Key offerings
SWOT

15.16 Roblox Corp.

Roblox Corp. - Overview
Roblox Corp. - Product / Service
Roblox Corp. - Key offerings
SWOT

15.17 Stride Inc.

Stride Inc. - Overview
Stride Inc. - Business segments
Stride Inc. - Key offerings
Stride Inc. - Segment focus
SWOT

15.18 TinyTap Ltd

TinyTap Ltd - Overview
TinyTap Ltd - Product / Service
TinyTap Ltd - Key offerings
SWOT

16. Appendix

16.1 Scope of the report

Market definition
Objectives
Notes and caveats

16.2 Inclusions and exclusions checklist

Inclusions checklist
Exclusions checklist

16.3 Currency conversion rates for US$

16.4 Research methodology

16.5 Data procurement

Information sources

16.6 Data validation

16.7 Validation techniques employed for market sizing

16.8 Data synthesis

16.9 360 degree market analysis

16.10 List of abbreviations

Research Methodology

Technavio presents a detailed picture of the market by way of study, synthesis, and summation of data from multiple sources. The analysts have presented the various facets of the market with a particular focus on identifying the key industry influencers. The data thus presented is comprehensive, reliable, and the result of extensive research, both primary and secondary.

INFORMATION SOURCES

Primary sources

  • Manufacturers and suppliers
  • Channel partners
  • Industry experts
  • Strategic decision makers

Secondary sources

  • Industry journals and periodicals
  • Government data
  • Financial reports of key industry players
  • Historical data
  • Press releases

DATA ANALYSIS

Data Synthesis

  • Collation of data
  • Estimation of key figures
  • Analysis of derived insights

Data Validation

  • Triangulation with data models
  • Reference against proprietary databases
  • Corroboration with industry experts

REPORT WRITING

Qualitative

  • Market drivers
  • Market challenges
  • Market trends
  • Five forces analysis

Quantitative

  • Market size and forecast
  • Market segmentation
  • Geographical insights
  • Competitive landscape

Interested in this report?

Get your sample now to see our research methodology and insights!

Download Now

Frequently Asked Questions

K-12 Game-based Learning market growth will increase by USD 37346.9 million during 2026-2030.

The K-12 Game-based Learning market is expected to grow at a CAGR of 27.7% during 2026-2030.

K-12 Game-based Learning market is segmented by Product (Subject-specific games, Language learning games, Others) School level (Middle school level, High school level, Elementary school level) Type (Educational games, Simulation-based learning, Social games, Others)

Age of Learning Inc., Baamboozle Inc., Blooket LLC, BrainPOP, Cambium Intermediate Holdings, CodeCombat Inc, Eduten Oy, Filament Games, Gimkit Inc., Houghton Mifflin Harcourt Co., Kahoot, Legends of Learning Inc., Microsoft Corp., Neuron Fuel Inc., Prodigy Education, Roblox Corp., Stride Inc., StudyPad Inc., SurfScore Inc, TinyTap Ltd are a few of the key vendors in the K-12 Game-based Learning market.

North America will register the highest growth rate of 36.1% among the other regions. Therefore, the K-12 Game-based Learning market in North America is expected to garner significant business opportunities for the vendors during the forecast period.

US, Canada, Mexico, Germany, UK, France, Italy, Spain, Sweden, China, India, Indonesia, Japan, Australia, South Korea, Brazil, Chile, Argentina, UAE, Saudi Arabia, South Africa, Israel, Egypt

  • Integration of adaptive AI systems is the driving factor this market.

The K-12 Game-based Learning market vendors should focus on grabbing business opportunities from the Product segment as it accounted for the largest market share in the base year.
RIA - Research AI Assistant
Ask RIA