K-12 Makerspace Materials Market Analysis, Size, and Forecast 2026-2030: APAC (China, Japan, and India), Europe (Germany, UK, and France), North America (US, Canada, and Mexico), Middle East and Africa (Saudi Arabia, UAE, and South Africa), South America (Brazil and Argentina), and Rest of World (ROW)

K-12 Makerspace Materials Market Analysis, Size, and Forecast 2026-2030:
APAC (China, Japan, and India), Europe (Germany, UK, and France), North America (US, Canada, and Mexico), Middle East and Africa (Saudi Arabia, UAE, and South Africa), South America (Brazil and Argentina), and Rest of World (ROW)

Published: Apr 2026 301 Pages SKU: IRTNTR44598

Market Overview at a Glance

$3.16 B
Market Opportunity
12.5%
CAGR 2025 - 2030
35%
APAC Growth
$1.41 B
Robotic toolkit segment 2024

K-12 Makerspace Materials Market Size 2026-2030

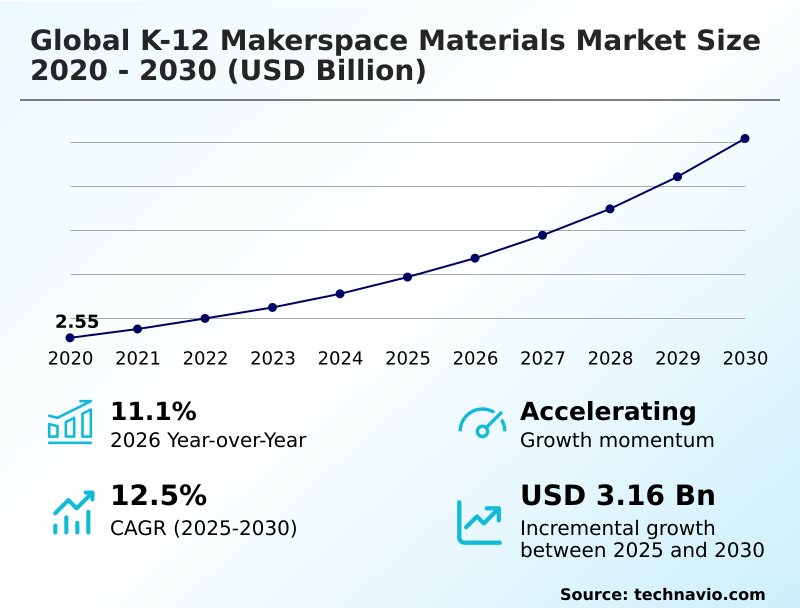
The k-12 makerspace materials market size is valued to increase by USD 3.16 billion, at a CAGR of 12.5% from 2025 to 2030. Advent of advanced makerspace materials will drive the k-12 makerspace materials market.

Major Market Trends & Insights

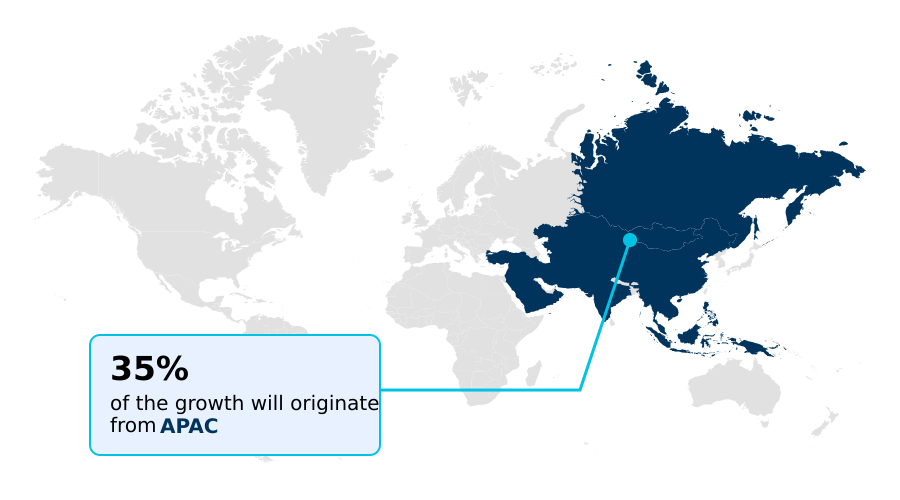
  • APAC dominated the market and accounted for a 35% growth during the forecast period.
  • By Product - Robotic toolkit segment was valued at USD 1.41 billion in 2024
  • By Application - Elementary school segment accounted for the largest market revenue share in 2024

Market Size & Forecast

  • Market Opportunities: USD 4.54 billion
  • Market Future Opportunities: USD 3.16 billion
  • CAGR from 2025 to 2030 : 12.5%

Market Summary

  • The K-12 makerspace materials market is experiencing steady expansion, driven by the increasing emphasis on experiential learning models and the need to equip students with practical, future-ready skills. Makerspaces, supported by a wide range of resources from robotics kits to 3D printing filaments, have become integral to modern education.
  • The shift from traditional rote learning to interactive, project-based learning is a key factor fueling demand. Technological advancements are also shaping the landscape, with digital tools like AI and cloud-based platforms enhancing the effectiveness of these learning environments.
  • For instance, a school district can optimize its resource allocation by using management software to track the usage of consumables like 3D printing materials across its makerspaces, ensuring continuous availability for student projects. However, the market faces challenges, including high initial setup costs and a lack of educators trained to manage these complex spaces, which can slow adoption.
  • Despite these hurdles, the long-term outlook is positive as the demand for skill-based education continues to rise, solidifying makerspaces as a key component of modern learning ecosystems.

What will be the Size of the K-12 Makerspace Materials Market during the forecast period?

Get Key Insights on Market Forecast (PDF) Request Free Sample

How is the K-12 Makerspace Materials Market Segmented?

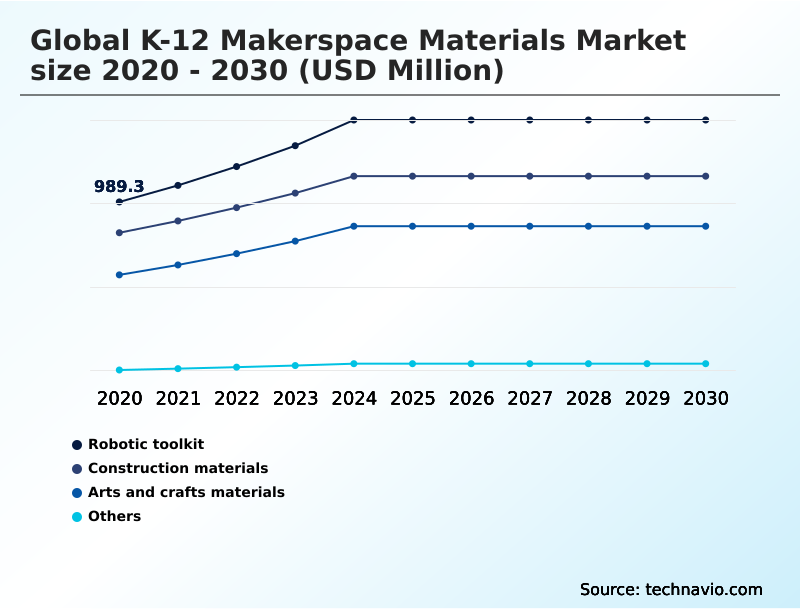
The k-12 makerspace materials industry research report provides comprehensive data (region-wise segment analysis), with forecasts and estimates in "USD million" for the period 2026-2030, as well as historical data from 2020-2024 for the following segments.

  • Product
    • Robotic toolkit
    • Construction materials
    • Arts and crafts materials
    • Others
  • Application
    • Elementary school
    • Middle school
    • High school
  • End-user
    • Classroom
    • Library
    • Cafeteria
    • Office
    • Others
  • Geography
    • APAC
      • China
      • Japan
      • India
    • Europe
      • Germany
      • UK
      • France
    • North America
      • US
      • Canada
      • Mexico
    • Middle East and Africa
      • Saudi Arabia
      • UAE
      • South Africa
    • South America
      • Brazil
      • Argentina
    • Rest of World (ROW)

By Product Insights

The robotic toolkit segment is estimated to witness significant growth during the forecast period.

The robotic toolkit segment is central to the K-12 makerspace materials market, driven by the shift toward experiential learning models and project-based learning.

This category, encompassing programmable robotics kits and other hands-on learning tools, is fundamental to modern STEM and STEAM education. Demand is accelerating due to curriculum mandates requiring resources like educational electronics kits, interactive learning tools, and coding robots.

The adoption of advanced kits has resulted in a reported 20% improvement in student participation.

This trend, supported by digital fabrication tools like classroom 3d printers and laser cutting machines, underscores the move toward practical, hands-on stem learning over theoretical instruction, even incorporating materials like cardboard construction kits.

Request Free Sample

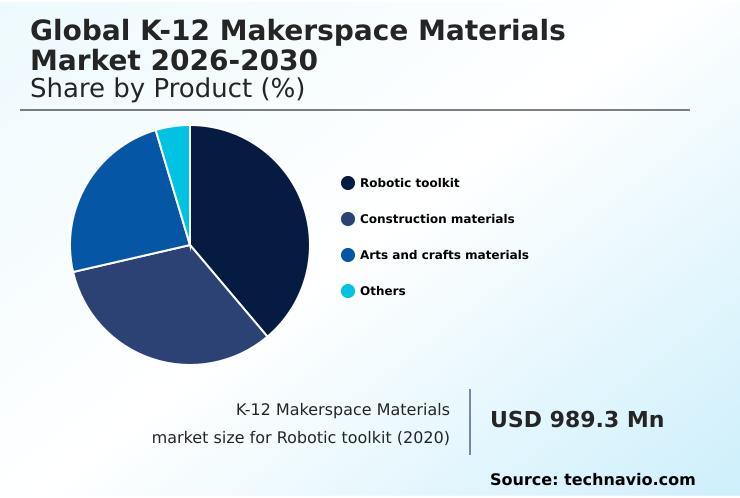
The Robotic toolkit segment was valued at USD 1.41 billion in 2024 and showed a gradual increase during the forecast period.

Request Free Sample

Regional Analysis

APAC is estimated to contribute 35% to the growth of the global market during the forecast period.Technavio’s analysts have elaborately explained the regional trends and drivers that shape the market during the forecast period.

See How K-12 Makerspace Materials Market Demand is Rising in APAC Request Free Sample

The geographic landscape is defined by regional priorities and varying infrastructure requirements. APAC is set to lead growth, accounting for over 35% of market expansion, focusing on deploying modular building kits and microcontroller platforms.

North America's mature market is upgrading with advanced electronics components and coding modules, while also refining methods for assessing student learning in makerspaces. Europe emphasizes sustainability, incorporating paper-based electronics and reusable connectors.

In emerging regions, the focus is on overcoming limited internet connectivity to provide foundational educational robotics solutions.

Strategic decisions, such as choosing 3d printers for elementary schools, are critical everywhere, as is the adoption of modular robots and cnc machines to support diverse project-based learning.

Market Dynamics

Our researchers analyzed the data with 2025 as the base year, along with the key drivers, trends, and challenges. A holistic analysis of drivers will help companies refine their marketing strategies to gain a competitive advantage.

  • Strategic planning in the K-12 makerspace domain requires a multi-faceted approach, addressing both pedagogical goals and operational realities. A key focus is on integrating robotics into K-12 curriculum, which highlights the benefits of project-based learning materials in fostering practical skills.
  • Institutions are increasingly exploring curriculum development for STEAM education, which involves integrating art into STEM projects and using the best construction kits for engineering concepts. As schools adopt more advanced tools, understanding how to start a school coding club and planning for robotics competitions for middle schoolers become important engagement strategies.
  • The role of makerspaces in skill development is undeniable, but it necessitates careful planning around safety best practices for school makerspaces and identifying stable funding sources for K-12 stem programs. Operational decisions involve choosing 3d printers for elementary schools that are both safe and user-friendly, alongside effectively managing consumables in a classroom makerspace.
  • Schools with limited infrastructure are exploring mobile makerspace design and setup and other low-cost makerspace ideas for schools. The rise of hybrid learning models brings virtual reality tools for remote making to the forefront, complemented by ai-powered tools for personalized learning. This also changes methods for assessing student learning in makerspaces.
  • Forward-thinking initiatives include using drones to teach high school physics, creating wearable technology projects for students, and prioritizing eco-friendly and sustainable maker materials. Institutions that streamline their supply chain for these materials report inventory-related delays that are 50% lower than those with ad-hoc procurement, underscoring the importance of integrated planning.

What are the key market drivers leading to the rise in the adoption of K-12 Makerspace Materials Industry?

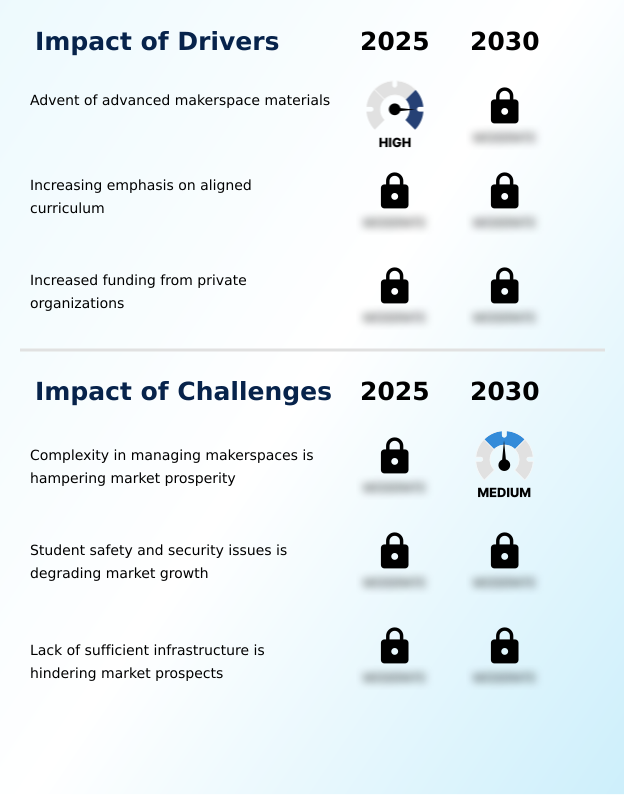
  • The advent of advanced and more accessible makerspace materials is a key driver for the global K-12 makerspace materials market.

  • Market growth is strongly driven by curriculum alignment and private funding from philanthropic foundations. These initiatives support school innovation labs and coding labs, expanding access to technology by over 60% in some regions.
  • The emphasis on project-based work fuels demand for virtual engineering modules for digital prototyping and hands-on tools like drones in robotics, which are popular in after-school stem programs.
  • Widespread deployment of mobile makerspaces and portable learning labs is made possible by these investments.
  • Furthermore, integrated solutions that include teacher professional development alongside classroom management software and makerspace inventory tracking are proving critical, with schools using them reporting a 25% increase in operational efficiency.

What are the market trends shaping the K-12 Makerspace Materials Industry?

  • A strong shift toward online makerspaces is a significant market trend. This is driven by the increasing adoption of digital and hybrid learning models in schools.

  • Key trends are reshaping the market, emphasizing accessibility through mobile stem labs and virtual makerspace platforms. The focus on skill-based learning is driving adoption of ai-enabled learning tools, particularly for ai learning for kids.
  • There is a strong push toward sustainability, with a rising demand for eco-friendly materials, biodegradable materials, and other sustainable classroom supplies, reducing school waste by up to 15%. Tinkering labs are increasingly equipped with modular robotics kits featuring simplified coding interfaces.
  • This enhances programs like robotics for elementary school and coding for middle school, while the introduction of drones for high school stem has increased project engagement by 30%.

What challenges does the K-12 Makerspace Materials Industry face during its growth?

  • The complexity involved in managing school makerspaces is a key challenge that hampers market growth and prosperity.

  • Key challenges include the complexity of curriculum integration for advanced topics like aerodynamics education and sensor-based navigation. Inadequate training in equipment handling and student safety protocols presents significant hurdles, with implementation costs increasing operational overhead by 15%. Poor inventory management of project-based learning supplies leads to material shortages, while digital security concerns slow the adoption of connected educational robotics solutions.
  • Many schools struggle to implement these experiential learning resources and stem curriculum materials effectively. This operational burden often results in the underutilization of steam educational tools and hinders the expansion of digital fabrication in schools, restraining overall market growth.

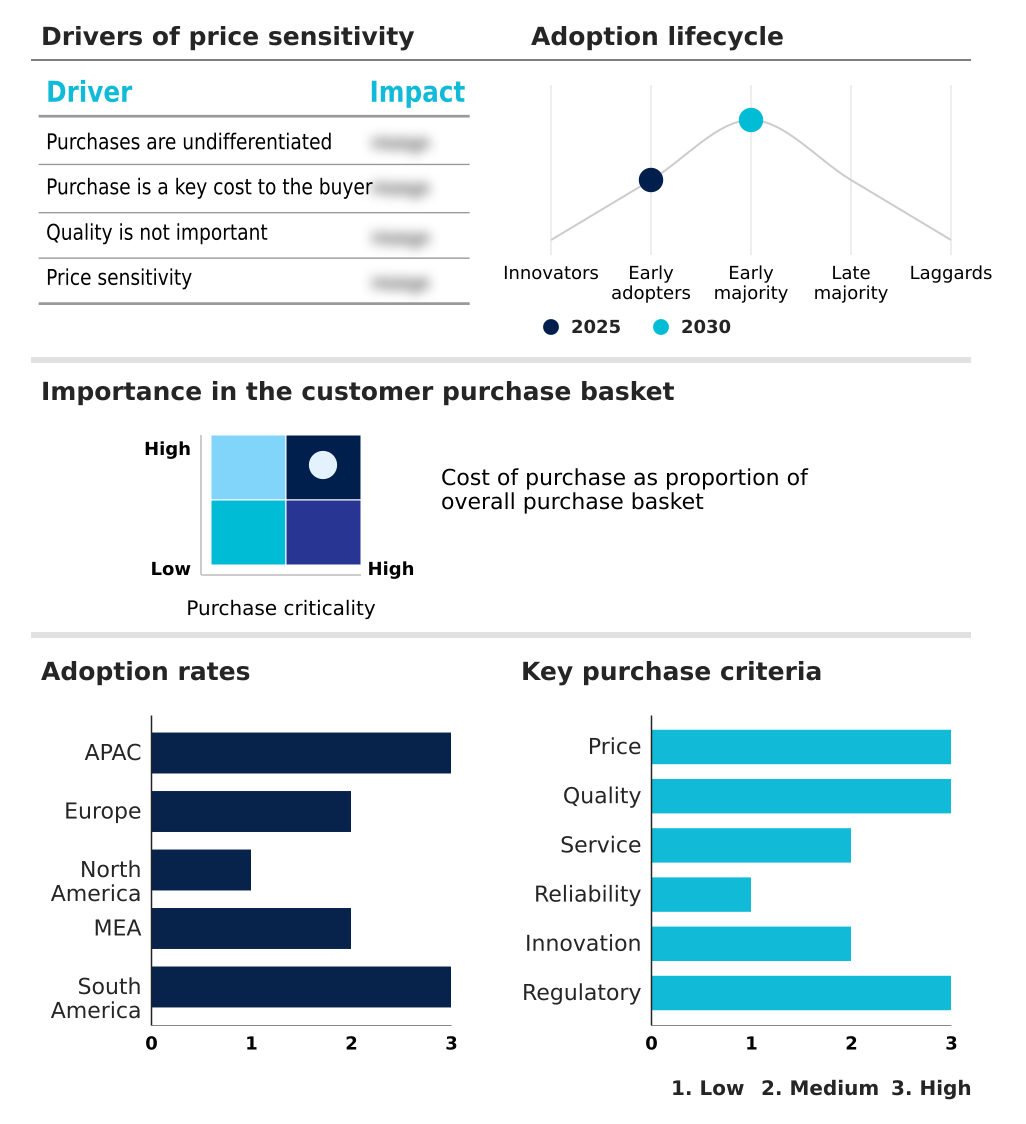
Exclusive Technavio Analysis on Customer Landscape

The k-12 makerspace materials market forecasting report includes the adoption lifecycle of the market, covering from the innovator’s stage to the laggard’s stage. It focuses on adoption rates in different regions based on penetration. Furthermore, the k-12 makerspace materials market report also includes key purchase criteria and drivers of price sensitivity to help companies evaluate and develop their market growth analysis strategies.

Customer Landscape of K-12 Makerspace Materials Industry

Competitive Landscape

Companies are implementing various strategies, such as strategic alliances, k-12 makerspace materials market forecast, partnerships, mergers and acquisitions, geographical expansion, and product/service launches, to enhance their presence in the industry.

Arduino Srl - Offerings include open-source microcontroller platforms and prototyping tools, central to electronics development and STEM education.

The industry research and growth report includes detailed analyses of the competitive landscape of the market and information about key companies, including:

  • Arduino Srl
  • Brown Dog Gadgets
  • Dremel
  • Elenco Electronics Inc.
  • Flashforge
  • Glowforge Inc.
  • hand2mind Inc.
  • LEGO System AS
  • Makeblock Co. Ltd.
  • Makedo
  • MakerBot Industries LLC
  • Makey Makey LLC.
  • Modular Robotics Inc.
  • Ozo EDU Inc.
  • Prusa Research s.r.o.
  • Snapmaker
  • Sphero Inc.
  • Strawbees AB
  • Teknikio Inc.
  • VEX Robotics Inc.

Qualitative and quantitative analysis of companies has been conducted to help clients understand the wider business environment as well as the strengths and weaknesses of key industry players. Data is qualitatively analyzed to categorize companies as pure play, category-focused, industry-focused, and diversified; it is quantitatively analyzed to categorize companies as dominant, leading, strong, tentative, and weak.

Recent Development and News in K-12 makerspace materials market

  • In March 2025, Discovery Education supported mobile STEM and makerspace lab initiatives across multiple school districts in the United States, providing traveling learning units equipped with hands-on science and engineering kits.
  • In April 2025, the Ministry of Education Australia expanded its national curriculum framework to include mandatory STEM-based project learning modules in secondary schools, leading to increased procurement of makerspace kits.
  • In April 2025, Parrot expanded its educational drone program across European K-12 schools, introducing coding-enabled drone kits designed for classroom learning and robotics competitions.
  • In May 2025, Tinkercad, an Autodesk brand, expanded its cloud-based 3D design and simulation tools for school students, allowing them to build and test digital prototypes remotely and increasing adoption in hybrid classrooms.

Dive into Technavio’s robust research methodology, blending expert interviews, extensive data synthesis, and validated models for unparalleled K-12 Makerspace Materials Market insights. See full methodology.

Market Scope
Page number 301
Base year 2025
Historic period 2020-2024
Forecast period 2026-2030
Growth momentum & CAGR Accelerate at a CAGR of 12.5%
Market growth 2026-2030 USD 3158.1 million
Market structure Fragmented
YoY growth 2025-2026(%) 11.1%
Key countries China, Japan, India, South Korea, Australia, Indonesia, Germany, UK, France, Italy, Spain, The Netherlands, US, Canada, Mexico, Saudi Arabia, UAE, South Africa, Israel, Turkey, Brazil, Argentina and Chile
Competitive landscape Leading Companies, Market Positioning of Companies, Competitive Strategies, and Industry Risks

Request Free Sample

Research Analyst Overview

  • The K-12 makerspace materials market is evolving beyond simple supply provision to become a cornerstone of modern pedagogy focused on skill-based learning. A key trend is the integration of hands-on learning tools directly into curriculum integration efforts, moving from standalone tinkering labs to essential classroom components.
  • This shift toward experiential learning models and project-based learning requires a diverse range of materials, including programmable robotics kits, 3d printing filaments, and modular building kits. The adoption of ai-enabled learning tools and virtual engineering modules for digital prototyping is transforming instruction.
  • For boardroom consideration, the growing emphasis on digital security and student safety protocols for equipment handling directly impacts institutional liability and IT budgeting. Schools leveraging integrated inventory management systems for their electronics components and coding modules have achieved a 25% reduction in material waste. The demand for eco-friendly materials and biodegradable materials is also rising.
  • Expansion is supported by philanthropic foundations funding coding labs, mobile makerspaces, and portable learning labs to address infrastructure requirements and improve internet connectivity, especially for advanced applications like drones in robotics, which teach aerodynamics education and sensor-based navigation. Success hinges on a supply chain providing everything from microcontroller platforms with simplified coding interfaces to reusable connectors.

What are the Key Data Covered in this K-12 Makerspace Materials Market Research and Growth Report?

  • What is the expected growth of the K-12 Makerspace Materials Market between 2026 and 2030?

    • USD 3.16 billion, at a CAGR of 12.5%

  • What segmentation does the market report cover?

    • The report is segmented by Product (Robotic toolkit, Construction materials, Arts and crafts materials, and Others), Application (Elementary school, Middle school, and High school), End-user (Classroom, Library, Cafeteria, Office, and Others) and Geography (APAC, Europe, North America, Middle East and Africa, South America)

  • Which regions are analyzed in the report?

    • APAC, Europe, North America, Middle East and Africa and South America

  • What are the key growth drivers and market challenges?

    • Advent of advanced makerspace materials, Complexity in managing makerspaces is hampering market prosperity

  • Who are the major players in the K-12 Makerspace Materials Market?

    • Arduino Srl, Brown Dog Gadgets, Dremel, Elenco Electronics Inc., Flashforge, Glowforge Inc., hand2mind Inc., LEGO System AS, Makeblock Co. Ltd., Makedo, MakerBot Industries LLC, Makey Makey LLC., Modular Robotics Inc., Ozo EDU Inc., Prusa Research s.r.o., Snapmaker, Sphero Inc., Strawbees AB, Teknikio Inc. and VEX Robotics Inc.

Market Research Insights

  • The K-12 makerspace materials market's dynamics are heavily influenced by the push for operational efficiency and measurable learning outcomes. The integration of classroom management software has demonstrated an ability to increase equipment utilization by up to 25%, maximizing institutional investment.
  • Concurrently, effective makerspace inventory tracking systems are critical for reducing material waste by an average of 15%, directly impacting school budgets. The effectiveness of these tools is amplified by robust teacher professional development, which correlates with a 30% higher rate of successful project completion.
  • These factors highlight a market shift toward integrated solutions that not only provide learning materials but also streamline management, improve resource allocation, and ensure that investments in hands-on learning deliver tangible educational returns.

We can help! Our analysts can customize this k-12 makerspace materials market research report to meet your requirements.

Get in touch

1. Executive Summary

1.1 Market overview

Executive Summary - Chart on Market Overview
Executive Summary - Data Table on Market Overview
Executive Summary - Chart on Global Market Characteristics
Executive Summary - Chart on Market by Geography
Executive Summary - Chart on Market Segmentation by Product
Executive Summary - Chart on Market Segmentation by Application
Executive Summary - Chart on Market Segmentation by End-user
Executive Summary - Chart on Incremental Growth
Executive Summary - Data Table on Incremental Growth
Executive Summary - Chart on Company Market Positioning

2. Technavio Analysis

2.1 Analysis of price sensitivity, lifecycle, customer purchase basket, adoption rates, and purchase criteria

2.2 Criticality of inputs and Factors of differentiation

Chart on Overview on criticality of inputs and factors of differentiation

2.3 Factors of disruption

Chart on Overview on factors of disruption

2.4 Impact of drivers and challenges

Chart on Impact of drivers and challenges in 2025 and 2030

3. Market Landscape

3.1 Market ecosystem

Chart on Parent Market
Data Table on - Parent Market

3.2 Market characteristics

Chart on Market characteristics analysis

3.3 Value chain analysis

Chart on Value chain analysis

4. Market Sizing

4.1 Market definition

Data Table on Offerings of companies included in the market definition

4.2 Market segment analysis

Market segments

4.3 Market size 2025

4.4 Market outlook: Forecast for 2025-2030

Chart on Global - Market size and forecast 2025-2030 ($ million)
Data Table on Global - Market size and forecast 2025-2030 ($ million)
Chart on Global Market: Year-over-year growth 2025-2030 (%)
Data Table on Global Market: Year-over-year growth 2025-2030 (%)

5. Historic Market Size

5.1 Global K-12 Makerspace Materials Market 2020 - 2024

Historic Market Size - Data Table on Global K-12 Makerspace Materials Market 2020 - 2024 ($ million)

5.2 Product segment analysis 2020 - 2024

Historic Market Size - Product Segment 2020 - 2024 ($ million)

5.3 Application segment analysis 2020 - 2024

Historic Market Size - Application Segment 2020 - 2024 ($ million)

5.4 End-user segment analysis 2020 - 2024

Historic Market Size - End-user Segment 2020 - 2024 ($ million)

5.5 Geography segment analysis 2020 - 2024

Historic Market Size - Geography Segment 2020 - 2024 ($ million)

5.6 Country segment analysis 2020 - 2024

Historic Market Size - Country Segment 2020 - 2024 ($ million)

6. Qualitative Analysis

6.1 Impact of AI on the Global K-12 Makerspace Materials Market

6.2 Impact of Geopolitical Conflicts on the Global K-12 Makerspace Materials Market

7. Five Forces Analysis

7.1 Five forces summary

Five forces analysis - Comparison between 2025 and 2030

7.2 Bargaining power of buyers

Bargaining power of buyers - Impact of key factors 2025 and 2030

7.3 Bargaining power of suppliers

Bargaining power of suppliers - Impact of key factors in 2025 and 2030

7.4 Threat of new entrants

Threat of new entrants - Impact of key factors in 2025 and 2030

7.5 Threat of substitutes

Threat of substitutes - Impact of key factors in 2025 and 2030

7.6 Threat of rivalry

Threat of rivalry - Impact of key factors in 2025 and 2030

7.7 Market condition

Chart on Market condition - Five forces 2025 and 2030

8. Market Segmentation by Product

8.1 Market segments

Chart on Product - Market share 2025-2030 (%)
Data Table on Product - Market share 2025-2030 (%)

8.2 Comparison by Product

Chart on Comparison by Product
Data Table on Comparison by Product

8.3 Robotic toolkit - Market size and forecast 2025-2030

Chart on Robotic toolkit - Market size and forecast 2025-2030 ($ million)
Data Table on Robotic toolkit - Market size and forecast 2025-2030 ($ million)
Chart on Robotic toolkit - Year-over-year growth 2025-2030 (%)
Data Table on Robotic toolkit - Year-over-year growth 2025-2030 (%)

8.4 Construction materials - Market size and forecast 2025-2030

Chart on Construction materials - Market size and forecast 2025-2030 ($ million)
Data Table on Construction materials - Market size and forecast 2025-2030 ($ million)
Chart on Construction materials - Year-over-year growth 2025-2030 (%)
Data Table on Construction materials - Year-over-year growth 2025-2030 (%)

8.5 Arts and crafts materials - Market size and forecast 2025-2030

Chart on Arts and crafts materials - Market size and forecast 2025-2030 ($ million)
Data Table on Arts and crafts materials - Market size and forecast 2025-2030 ($ million)
Chart on Arts and crafts materials - Year-over-year growth 2025-2030 (%)
Data Table on Arts and crafts materials - Year-over-year growth 2025-2030 (%)

8.6 Others - Market size and forecast 2025-2030

Chart on Others - Market size and forecast 2025-2030 ($ million)
Data Table on Others - Market size and forecast 2025-2030 ($ million)
Chart on Others - Year-over-year growth 2025-2030 (%)
Data Table on Others - Year-over-year growth 2025-2030 (%)

8.7 Market opportunity by Product

Market opportunity by Product ($ million)
Data Table on Market opportunity by Product ($ million)

9. Market Segmentation by Application

9.1 Market segments

Chart on Application - Market share 2025-2030 (%)
Data Table on Application - Market share 2025-2030 (%)

9.2 Comparison by Application

Chart on Comparison by Application
Data Table on Comparison by Application

9.3 Elementary school - Market size and forecast 2025-2030

Chart on Elementary school - Market size and forecast 2025-2030 ($ million)
Data Table on Elementary school - Market size and forecast 2025-2030 ($ million)
Chart on Elementary school - Year-over-year growth 2025-2030 (%)
Data Table on Elementary school - Year-over-year growth 2025-2030 (%)

9.4 Middle school - Market size and forecast 2025-2030

Chart on Middle school - Market size and forecast 2025-2030 ($ million)
Data Table on Middle school - Market size and forecast 2025-2030 ($ million)
Chart on Middle school - Year-over-year growth 2025-2030 (%)
Data Table on Middle school - Year-over-year growth 2025-2030 (%)

9.5 High school - Market size and forecast 2025-2030

Chart on High school - Market size and forecast 2025-2030 ($ million)
Data Table on High school - Market size and forecast 2025-2030 ($ million)
Chart on High school - Year-over-year growth 2025-2030 (%)
Data Table on High school - Year-over-year growth 2025-2030 (%)

9.6 Market opportunity by Application

Market opportunity by Application ($ million)
Data Table on Market opportunity by Application ($ million)

10. Market Segmentation by End-user

10.1 Market segments

Chart on End-user - Market share 2025-2030 (%)
Data Table on End-user - Market share 2025-2030 (%)

10.2 Comparison by End-user

Chart on Comparison by End-user
Data Table on Comparison by End-user

10.3 Classroom - Market size and forecast 2025-2030

Chart on Classroom - Market size and forecast 2025-2030 ($ million)
Data Table on Classroom - Market size and forecast 2025-2030 ($ million)
Chart on Classroom - Year-over-year growth 2025-2030 (%)
Data Table on Classroom - Year-over-year growth 2025-2030 (%)

10.4 Library - Market size and forecast 2025-2030

Chart on Library - Market size and forecast 2025-2030 ($ million)
Data Table on Library - Market size and forecast 2025-2030 ($ million)
Chart on Library - Year-over-year growth 2025-2030 (%)
Data Table on Library - Year-over-year growth 2025-2030 (%)

10.5 Cafeteria - Market size and forecast 2025-2030

Chart on Cafeteria - Market size and forecast 2025-2030 ($ million)
Data Table on Cafeteria - Market size and forecast 2025-2030 ($ million)
Chart on Cafeteria - Year-over-year growth 2025-2030 (%)
Data Table on Cafeteria - Year-over-year growth 2025-2030 (%)

10.6 Office - Market size and forecast 2025-2030

Chart on Office - Market size and forecast 2025-2030 ($ million)
Data Table on Office - Market size and forecast 2025-2030 ($ million)
Chart on Office - Year-over-year growth 2025-2030 (%)
Data Table on Office - Year-over-year growth 2025-2030 (%)

10.7 Others - Market size and forecast 2025-2030

Chart on Others - Market size and forecast 2025-2030 ($ million)
Data Table on Others - Market size and forecast 2025-2030 ($ million)
Chart on Others - Year-over-year growth 2025-2030 (%)
Data Table on Others - Year-over-year growth 2025-2030 (%)

10.8 Market opportunity by End-user

Market opportunity by End-user ($ million)
Data Table on Market opportunity by End-user ($ million)

11. Customer Landscape

11.1 Customer landscape overview

Analysis of price sensitivity, lifecycle, customer purchase basket, adoption rates, and purchase criteria

12. Geographic Landscape

12.1 Geographic segmentation

Chart on Market share by geography 2025-2030 (%)
Data Table on Market share by geography 2025-2030 (%)

12.2 Geographic comparison

Chart on Geographic comparison
Data Table on Geographic comparison

12.3 APAC - Market size and forecast 2025-2030

Chart on APAC - Market size and forecast 2025-2030 ($ million)
Data Table on APAC - Market size and forecast 2025-2030 ($ million)
Chart on APAC - Year-over-year growth 2025-2030 (%)
Data Table on APAC - Year-over-year growth 2025-2030 (%)
Chart on Regional Comparison - APAC
Data Table on Regional Comparison - APAC

12.3.1 China - Market size and forecast 2025-2030

Chart on China - Market size and forecast 2025-2030 ($ million)
Data Table on China - Market size and forecast 2025-2030 ($ million)
Chart on China - Year-over-year growth 2025-2030 (%)
Data Table on China - Year-over-year growth 2025-2030 (%)

12.3.2 Japan - Market size and forecast 2025-2030

Chart on Japan - Market size and forecast 2025-2030 ($ million)
Data Table on Japan - Market size and forecast 2025-2030 ($ million)
Chart on Japan - Year-over-year growth 2025-2030 (%)
Data Table on Japan - Year-over-year growth 2025-2030 (%)

12.3.3 India - Market size and forecast 2025-2030

Chart on India - Market size and forecast 2025-2030 ($ million)
Data Table on India - Market size and forecast 2025-2030 ($ million)
Chart on India - Year-over-year growth 2025-2030 (%)
Data Table on India - Year-over-year growth 2025-2030 (%)

12.3.4 South Korea - Market size and forecast 2025-2030

Chart on South Korea - Market size and forecast 2025-2030 ($ million)
Data Table on South Korea - Market size and forecast 2025-2030 ($ million)
Chart on South Korea - Year-over-year growth 2025-2030 (%)
Data Table on South Korea - Year-over-year growth 2025-2030 (%)

12.3.5 Australia - Market size and forecast 2025-2030

Chart on Australia - Market size and forecast 2025-2030 ($ million)
Data Table on Australia - Market size and forecast 2025-2030 ($ million)
Chart on Australia - Year-over-year growth 2025-2030 (%)
Data Table on Australia - Year-over-year growth 2025-2030 (%)

12.3.6 Indonesia - Market size and forecast 2025-2030

Chart on Indonesia - Market size and forecast 2025-2030 ($ million)
Data Table on Indonesia - Market size and forecast 2025-2030 ($ million)
Chart on Indonesia - Year-over-year growth 2025-2030 (%)
Data Table on Indonesia - Year-over-year growth 2025-2030 (%)

12.4 Europe - Market size and forecast 2025-2030

Chart on Europe - Market size and forecast 2025-2030 ($ million)
Data Table on Europe - Market size and forecast 2025-2030 ($ million)
Chart on Europe - Year-over-year growth 2025-2030 (%)
Data Table on Europe - Year-over-year growth 2025-2030 (%)
Chart on Regional Comparison - Europe
Data Table on Regional Comparison - Europe

12.4.1 Germany - Market size and forecast 2025-2030

Chart on Germany - Market size and forecast 2025-2030 ($ million)
Data Table on Germany - Market size and forecast 2025-2030 ($ million)
Chart on Germany - Year-over-year growth 2025-2030 (%)
Data Table on Germany - Year-over-year growth 2025-2030 (%)

12.4.2 UK - Market size and forecast 2025-2030

Chart on UK - Market size and forecast 2025-2030 ($ million)
Data Table on UK - Market size and forecast 2025-2030 ($ million)
Chart on UK - Year-over-year growth 2025-2030 (%)
Data Table on UK - Year-over-year growth 2025-2030 (%)

12.4.3 France - Market size and forecast 2025-2030

Chart on France - Market size and forecast 2025-2030 ($ million)
Data Table on France - Market size and forecast 2025-2030 ($ million)
Chart on France - Year-over-year growth 2025-2030 (%)
Data Table on France - Year-over-year growth 2025-2030 (%)

12.4.4 Italy - Market size and forecast 2025-2030

Chart on Italy - Market size and forecast 2025-2030 ($ million)
Data Table on Italy - Market size and forecast 2025-2030 ($ million)
Chart on Italy - Year-over-year growth 2025-2030 (%)
Data Table on Italy - Year-over-year growth 2025-2030 (%)

12.4.5 Spain - Market size and forecast 2025-2030

Chart on Spain - Market size and forecast 2025-2030 ($ million)
Data Table on Spain - Market size and forecast 2025-2030 ($ million)
Chart on Spain - Year-over-year growth 2025-2030 (%)
Data Table on Spain - Year-over-year growth 2025-2030 (%)

12.4.6 The Netherlands - Market size and forecast 2025-2030

Chart on The Netherlands - Market size and forecast 2025-2030 ($ million)
Data Table on The Netherlands - Market size and forecast 2025-2030 ($ million)
Chart on The Netherlands - Year-over-year growth 2025-2030 (%)
Data Table on The Netherlands - Year-over-year growth 2025-2030 (%)

12.5 North America - Market size and forecast 2025-2030

Chart on North America - Market size and forecast 2025-2030 ($ million)
Data Table on North America - Market size and forecast 2025-2030 ($ million)
Chart on North America - Year-over-year growth 2025-2030 (%)
Data Table on North America - Year-over-year growth 2025-2030 (%)
Chart on Regional Comparison - North America
Data Table on Regional Comparison - North America

12.5.1 US - Market size and forecast 2025-2030

Chart on US - Market size and forecast 2025-2030 ($ million)
Data Table on US - Market size and forecast 2025-2030 ($ million)
Chart on US - Year-over-year growth 2025-2030 (%)
Data Table on US - Year-over-year growth 2025-2030 (%)

12.5.2 Canada - Market size and forecast 2025-2030

Chart on Canada - Market size and forecast 2025-2030 ($ million)
Data Table on Canada - Market size and forecast 2025-2030 ($ million)
Chart on Canada - Year-over-year growth 2025-2030 (%)
Data Table on Canada - Year-over-year growth 2025-2030 (%)

12.5.3 Mexico - Market size and forecast 2025-2030

Chart on Mexico - Market size and forecast 2025-2030 ($ million)
Data Table on Mexico - Market size and forecast 2025-2030 ($ million)
Chart on Mexico - Year-over-year growth 2025-2030 (%)
Data Table on Mexico - Year-over-year growth 2025-2030 (%)

12.6 Middle East and Africa - Market size and forecast 2025-2030

Chart on Middle East and Africa - Market size and forecast 2025-2030 ($ million)
Data Table on Middle East and Africa - Market size and forecast 2025-2030 ($ million)
Chart on Middle East and Africa - Year-over-year growth 2025-2030 (%)
Data Table on Middle East and Africa - Year-over-year growth 2025-2030 (%)
Chart on Regional Comparison - Middle East and Africa
Data Table on Regional Comparison - Middle East and Africa

12.6.1 Saudi Arabia - Market size and forecast 2025-2030

Chart on Saudi Arabia - Market size and forecast 2025-2030 ($ million)
Data Table on Saudi Arabia - Market size and forecast 2025-2030 ($ million)
Chart on Saudi Arabia - Year-over-year growth 2025-2030 (%)
Data Table on Saudi Arabia - Year-over-year growth 2025-2030 (%)

12.6.2 UAE - Market size and forecast 2025-2030

Chart on UAE - Market size and forecast 2025-2030 ($ million)
Data Table on UAE - Market size and forecast 2025-2030 ($ million)
Chart on UAE - Year-over-year growth 2025-2030 (%)
Data Table on UAE - Year-over-year growth 2025-2030 (%)

12.6.3 South Africa - Market size and forecast 2025-2030

Chart on South Africa - Market size and forecast 2025-2030 ($ million)
Data Table on South Africa - Market size and forecast 2025-2030 ($ million)
Chart on South Africa - Year-over-year growth 2025-2030 (%)
Data Table on South Africa - Year-over-year growth 2025-2030 (%)

12.6.4 Israel - Market size and forecast 2025-2030

Chart on Israel - Market size and forecast 2025-2030 ($ million)
Data Table on Israel - Market size and forecast 2025-2030 ($ million)
Chart on Israel - Year-over-year growth 2025-2030 (%)
Data Table on Israel - Year-over-year growth 2025-2030 (%)

12.6.5 Turkey - Market size and forecast 2025-2030

Chart on Turkey - Market size and forecast 2025-2030 ($ million)
Data Table on Turkey - Market size and forecast 2025-2030 ($ million)
Chart on Turkey - Year-over-year growth 2025-2030 (%)
Data Table on Turkey - Year-over-year growth 2025-2030 (%)

12.7 South America - Market size and forecast 2025-2030

Chart on South America - Market size and forecast 2025-2030 ($ million)
Data Table on South America - Market size and forecast 2025-2030 ($ million)
Chart on South America - Year-over-year growth 2025-2030 (%)
Data Table on South America - Year-over-year growth 2025-2030 (%)
Chart on Regional Comparison - South America
Data Table on Regional Comparison - South America

12.7.1 Brazil - Market size and forecast 2025-2030

Chart on Brazil - Market size and forecast 2025-2030 ($ million)
Data Table on Brazil - Market size and forecast 2025-2030 ($ million)
Chart on Brazil - Year-over-year growth 2025-2030 (%)
Data Table on Brazil - Year-over-year growth 2025-2030 (%)

12.7.2 Argentina - Market size and forecast 2025-2030

Chart on Argentina - Market size and forecast 2025-2030 ($ million)
Data Table on Argentina - Market size and forecast 2025-2030 ($ million)
Chart on Argentina - Year-over-year growth 2025-2030 (%)
Data Table on Argentina - Year-over-year growth 2025-2030 (%)

12.7.3 Chile - Market size and forecast 2025-2030

Chart on Chile - Market size and forecast 2025-2030 ($ million)
Data Table on Chile - Market size and forecast 2025-2030 ($ million)
Chart on Chile - Year-over-year growth 2025-2030 (%)
Data Table on Chile - Year-over-year growth 2025-2030 (%)

12.8 Market opportunity by geography

Market opportunity by geography ($ million)
Data Tables on Market opportunity by geography ($ million)

13. Drivers, Challenges, and Opportunity

13.1 Market drivers

Advent of advanced makerspace materials
Increasing emphasis on aligned curriculum
Increased funding from private organizations

13.2 Market challenges

Complexity in managing makerspaces is hampering market prosperity
Student safety and security issues is degrading market growth
Lack of sufficient infrastructure is hindering market prospects

13.3 Impact of drivers and challenges

Impact of drivers and challenges in 2025 and 2030

13.4 Market opportunities

Strong shift towards online makerspaces
Rising emphasis on mobile makerspaces
Introduction of drones in K-12 robotic learning programs

14. Competitive Landscape

14.1 Overview

14.2

Overview on criticality of inputs and factors of differentiation

14.3 Landscape disruption

Overview on factors of disruption

14.4 Industry risks

Impact of key risks on business

15. Competitive Analysis

15.1 Companies profiled

Companies covered

15.2 Company ranking index

15.3 Market positioning of companies

Matrix on companies position and classification

15.4 Arduino Srl

Arduino Srl - Overview
Arduino Srl - Product / Service
Arduino Srl - Key offerings
SWOT

15.5 Brown Dog Gadgets

Brown Dog Gadgets - Overview
Brown Dog Gadgets - Product / Service
Brown Dog Gadgets - Key offerings
SWOT

15.6 Dremel

Dremel - Overview
Dremel - Product / Service
Dremel - Key offerings
SWOT

15.7 Elenco Electronics Inc.

Elenco Electronics Inc. - Overview
Elenco Electronics Inc. - Product / Service
Elenco Electronics Inc. - Key offerings
SWOT

15.8 Flashforge

Flashforge - Overview
Flashforge - Product / Service
Flashforge - Key offerings
SWOT

15.9 Glowforge Inc.

Glowforge Inc. - Overview
Glowforge Inc. - Product / Service
Glowforge Inc. - Key offerings
SWOT

15.10 hand2mind Inc.

hand2mind Inc. - Overview
hand2mind Inc. - Product / Service
hand2mind Inc. - Key offerings
SWOT

15.11 Makeblock Co. Ltd.

Makeblock Co. Ltd. - Overview
Makeblock Co. Ltd. - Product / Service
Makeblock Co. Ltd. - Key offerings
SWOT

15.12 Makedo

Makedo - Overview
Makedo - Product / Service
Makedo - Key offerings
SWOT

15.13 Makey Makey LLC.

Makey Makey LLC. - Overview
Makey Makey LLC. - Product / Service
Makey Makey LLC. - Key offerings
SWOT

15.14 Modular Robotics Inc.

Modular Robotics Inc. - Overview
Modular Robotics Inc. - Product / Service
Modular Robotics Inc. - Key offerings
SWOT

15.15 Snapmaker

Snapmaker - Overview
Snapmaker - Product / Service
Snapmaker - Key offerings
SWOT

15.16 Sphero Inc.

Sphero Inc. - Overview
Sphero Inc. - Product / Service
Sphero Inc. - Key offerings
SWOT

15.17 Teknikio Inc.

Teknikio Inc. - Overview
Teknikio Inc. - Product / Service
Teknikio Inc. - Key offerings
SWOT

15.18 VEX Robotics Inc.

VEX Robotics Inc. - Overview
VEX Robotics Inc. - Product / Service
VEX Robotics Inc. - Key offerings
SWOT

16. Appendix

16.1 Scope of the report

Market definition
Objectives
Notes and caveats

16.2 Inclusions and exclusions checklist

Inclusions checklist
Exclusions checklist

16.3 Currency conversion rates for US$

16.4 Research methodology

16.5 Data procurement

Information sources

16.6 Data validation

16.7 Validation techniques employed for market sizing

16.8 Data synthesis

16.9 360 degree market analysis

16.10 List of abbreviations

Research Methodology

Technavio presents a detailed picture of the market by way of study, synthesis, and summation of data from multiple sources. The analysts have presented the various facets of the market with a particular focus on identifying the key industry influencers. The data thus presented is comprehensive, reliable, and the result of extensive research, both primary and secondary.

INFORMATION SOURCES

Primary sources

  • Manufacturers and suppliers
  • Channel partners
  • Industry experts
  • Strategic decision makers

Secondary sources

  • Industry journals and periodicals
  • Government data
  • Financial reports of key industry players
  • Historical data
  • Press releases

DATA ANALYSIS

Data Synthesis

  • Collation of data
  • Estimation of key figures
  • Analysis of derived insights

Data Validation

  • Triangulation with data models
  • Reference against proprietary databases
  • Corroboration with industry experts

REPORT WRITING

Qualitative

  • Market drivers
  • Market challenges
  • Market trends
  • Five forces analysis

Quantitative

  • Market size and forecast
  • Market segmentation
  • Geographical insights
  • Competitive landscape

Interested in this report?

Get your sample now to see our research methodology and insights!

Download Now

Frequently Asked Questions

K-12 Makerspace Materials market growth will increase by USD 3158.1 million during 2026-2030.

The K-12 Makerspace Materials market is expected to grow at a CAGR of 12.5% during 2026-2030.

K-12 Makerspace Materials market is segmented by Product (Robotic toolkit, Construction materials, Arts and crafts materials, Others) Application (Elementary school, Middle school, High school) End-user (Classroom, Library, Cafeteria, Office, Others)

Arduino Srl, Brown Dog Gadgets, Dremel, Elenco Electronics Inc., Flashforge, Glowforge Inc., hand2mind Inc., LEGO System AS, Makeblock Co. Ltd., Makedo, MakerBot Industries LLC, Makey Makey LLC., Modular Robotics Inc., Ozo EDU Inc., Prusa Research s.r.o., Snapmaker, Sphero Inc., Strawbees AB, Teknikio Inc., VEX Robotics Inc. are a few of the key vendors in the K-12 Makerspace Materials market.

APAC will register the highest growth rate of 35% among the other regions. Therefore, the K-12 Makerspace Materials market in APAC is expected to garner significant business opportunities for the vendors during the forecast period.

China, Japan, India, South Korea, Australia, Indonesia, Germany, UK, France, Italy, Spain, The Netherlands, US, Canada, Mexico, Saudi Arabia, UAE, South Africa, Israel, Turkey, Brazil, Argentina, Chile

  • Advent of advanced makerspace materials is the driving factor this market.

The K-12 Makerspace Materials market vendors should focus on grabbing business opportunities from the Product segment as it accounted for the largest market share in the base year.
RIA - Research AI Assistant
Ask RIA