Kombucha Market Analysis, Size, and Forecast 2026-2030: North America (US, Canada, and Mexico), Europe (Germany, UK, and France), APAC (China, Japan, and India), Middle East and Africa (South Africa, Saudi Arabia, and UAE), South America (Brazil, Argentina, and Colombia), and Rest of World (ROW)

Kombucha Market Analysis, Size, and Forecast 2026-2030:
North America (US, Canada, and Mexico), Europe (Germany, UK, and France), APAC (China, Japan, and India), Middle East and Africa (South Africa, Saudi Arabia, and UAE), South America (Brazil, Argentina, and Colombia), and Rest of World (ROW)

Published: Mar 2026 288 Pages SKU: IRTNTR41084

Market Overview at a Glance

$7.65 B
Market Opportunity
20%
CAGR 2025 - 2030
34.9%
North America Growth
$3.02 B
Organic segment 2024

Kombucha Market Size 2026-2030

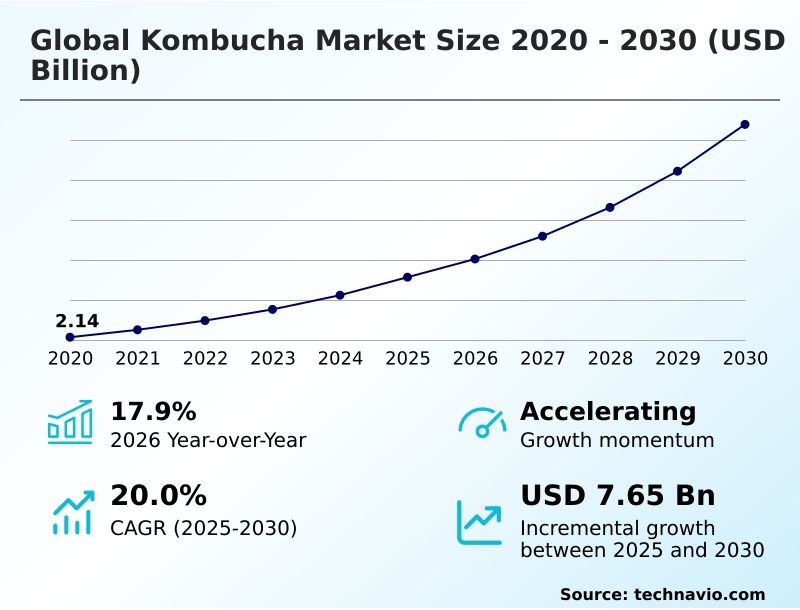
The kombucha market size is valued to increase by USD 7.65 billion, at a CAGR of 20% from 2025 to 2030. Rising awareness of gut health and probiotics will drive the kombucha market.

Major Market Trends & Insights

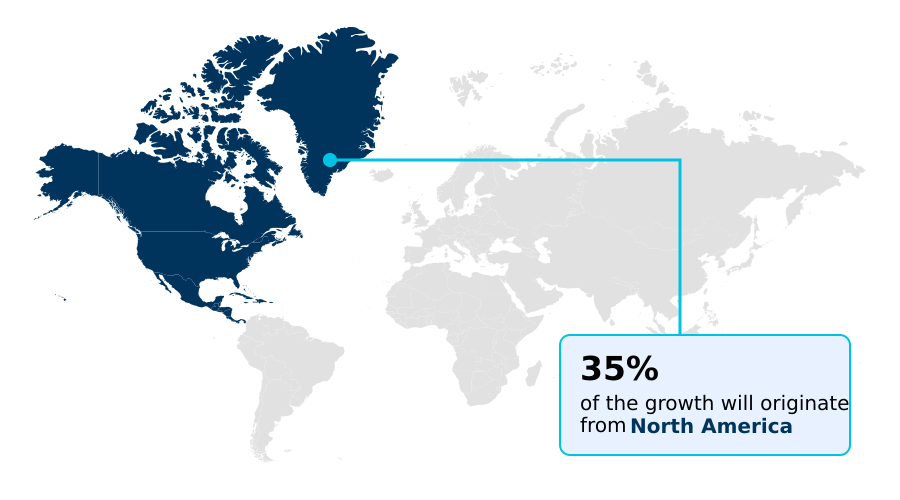
  • North America dominated the market and accounted for a 34.9% growth during the forecast period.
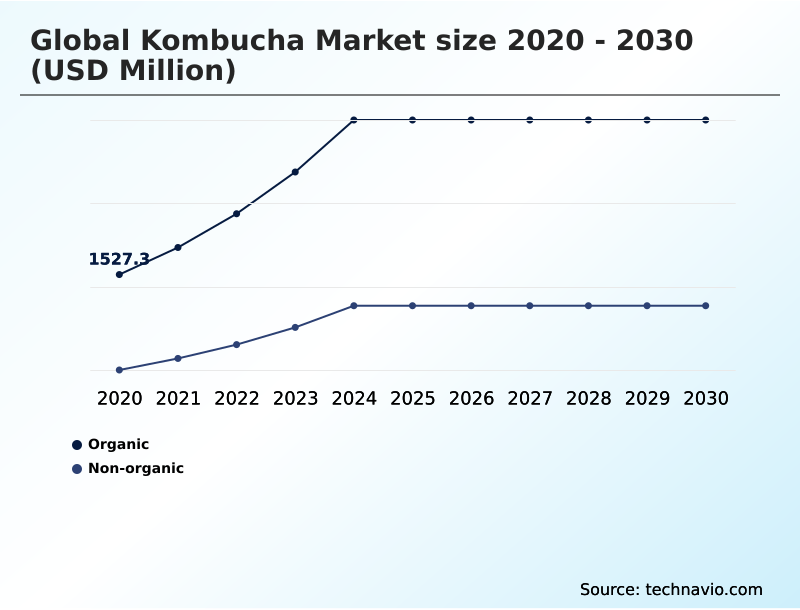
  • By Type - Organic segment was valued at USD 3.02 billion in 2024
  • By Distribution Channel - Offline segment accounted for the largest market revenue share in 2024

Market Size & Forecast

  • Market Opportunities: USD 10.65 billion
  • Market Future Opportunities: USD 7.65 billion
  • CAGR from 2025 to 2030 : 20%

Market Summary

  • The kombucha market is characterized by a rapid transition from a niche health product to a mainstream functional beverage. This shift is propelled by increasing consumer education on gut health, the microbiome, and the desire for low-sugar, non-alcoholic alternatives.
  • Key trends include the integration of adaptogens and superfoods for enhanced functionality, alongside a significant move toward sustainable packaging like aluminum cans and glass bottles. However, the industry grapples with challenges related to quality control, ensuring batch-to-batch consistency in taste and carbonation, and managing the complexities of cold chain logistics to preserve live cultures.
  • For instance, a beverage company aiming to scale operations must invest in sophisticated fermentation monitoring systems and refrigerated transport, which can increase operational costs but is crucial for maintaining product integrity and meeting regulatory standards for alcohol content. This dynamic environment necessitates a balance between artisanal appeal and the industrial efficiency required for broad market penetration.

What will be the Size of the Kombucha Market during the forecast period?

Get Key Insights on Market Forecast (PDF) Request Free Sample

How is the Kombucha Market Segmented?

The kombucha industry research report provides comprehensive data (region-wise segment analysis), with forecasts and estimates in "USD million" for the period 2026-2030, as well as historical data from 2020-2024 for the following segments.

  • Type
    • Organic
    • Non-organic
  • Distribution channel
    • Offline
    • Online
  • Packaging
    • Bottle
    • Cans
    • Others
  • Geography
    • North America
      • US
      • Canada
      • Mexico
    • Europe
      • Germany
      • UK
      • France
    • APAC
      • China
      • Japan
      • India
    • Middle East and Africa
      • South Africa
      • Saudi Arabia
      • UAE
    • South America
      • Brazil
      • Argentina
      • Colombia
    • Rest of World (ROW)

By Type Insights

The organic segment is estimated to witness significant growth during the forecast period.

The organic segment is defined by a commitment to premium probiotic beverage formulation, starting with certified organic tea leaf sourcing and precise cane sugar conversion.

This category emphasizes raw kombucha processing to deliver an unpasteurized functional beverage that maintains the integrity of the symbiotic culture of bacteria and yeast. Glass bottle fermentation remains a hallmark, reflecting artisanship and quality.

Demand is driven by calls for supply chain transparency and complete traceability in sourcing.

Leading producers leverage rigorous probiotic strain verification and guarantee a minimum colony forming unit (cfu) count, achieving over 95% consistency in the final organic acid profile analysis.

This focus on verifiable quality and a superior sensory profile evaluation solidifies the segment's premium positioning.

Request Free Sample

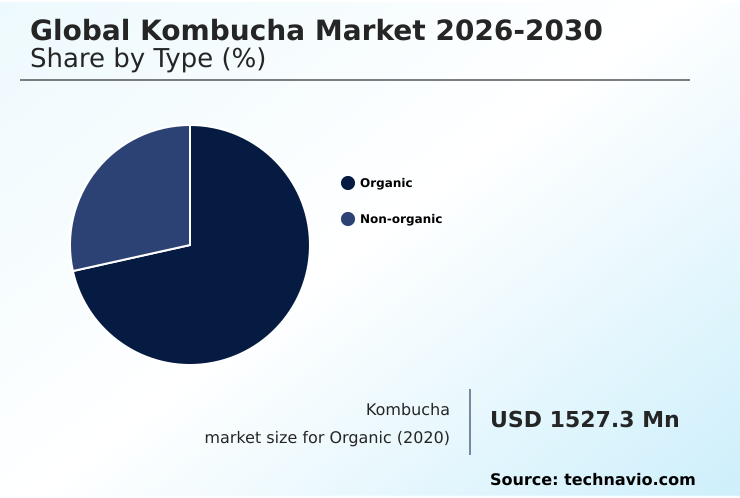
The Organic segment was valued at USD 3.02 billion in 2024 and showed a gradual increase during the forecast period.

Request Free Sample

Regional Analysis

North America is estimated to contribute 34.9% to the growth of the global market during the forecast period.Technavio’s analysts have elaborately explained the regional trends and drivers that shape the market during the forecast period.

See How Kombucha Market Demand is Rising in North America Request Free Sample

The geographic landscape is defined by regional disparities in market maturity. North America leads with widespread retail penetration and sophisticated cold chain logistics management, while APAC emerges as a high-growth frontier.

In these developing markets, the adoption of sterile filtration methods is enabling the launch of shelf-stable products, reducing reliance on refrigeration and expanding reach.

Across Europe, the demand for non-alcoholic fermented beverage options in hospitality is driving growth in kegged kombucha systems and draft kombucha dispensing. Brands are leveraging unique botanical extract flavoring to appeal to local palates.

Regardless of region, ensuring supply chain transparency and adhering to strict food safety standards and regulatory compliance for abv are critical for building consumer trust and achieving scalable success, with advanced fermentation vessel design and automated systems improving output by over 25%.

Market Dynamics

Our researchers analyzed the data with 2025 as the base year, along with the key drivers, trends, and challenges. A holistic analysis of drivers will help companies refine their marketing strategies to gain a competitive advantage.

  • A thorough review of the kombucha market competitive landscape reveals a dynamic interplay between large-scale producers and craft breweries, a key theme in any kombucha market regional analysis. Investors evaluating kombucha market investment opportunities must consider the industry's kombucha market future forecast, which is heavily influenced by functional drink market drivers like rising health consciousness.
  • A deep dive into kombucha market segmentation insights shows the organic kombucha market growth continues to outpace conventional offerings. Hard kombucha market trends are reshaping social drinking occasions, while kombucha packaging innovation trends focus on sustainability. Understanding the kombucha distribution channel analysis is crucial, as is a probiotic beverage market comparison to identify differentiation.
  • Navigating non-alcoholic beverage market challenges and specific kombucha regulatory hurdles explained in technical guides is vital for new entrants. Successful kombucha market entry strategies often depend on robust kombucha supply chain logistics and impeccable kombucha quality control standards. As for kombucha consumer purchasing behavior, authenticity and functional benefits are paramount.
  • Businesses are developing kombucha flavor diversification strategies to capture new demographics, while also committing to sustainable practices in kombucha production.
  • The impact of health trends on kombucha cannot be overstated; for example, brands that effectively communicate their products' health benefits through digital channels achieve customer engagement rates more than 30% higher than those that do not, underscoring the importance of marketing in this space.

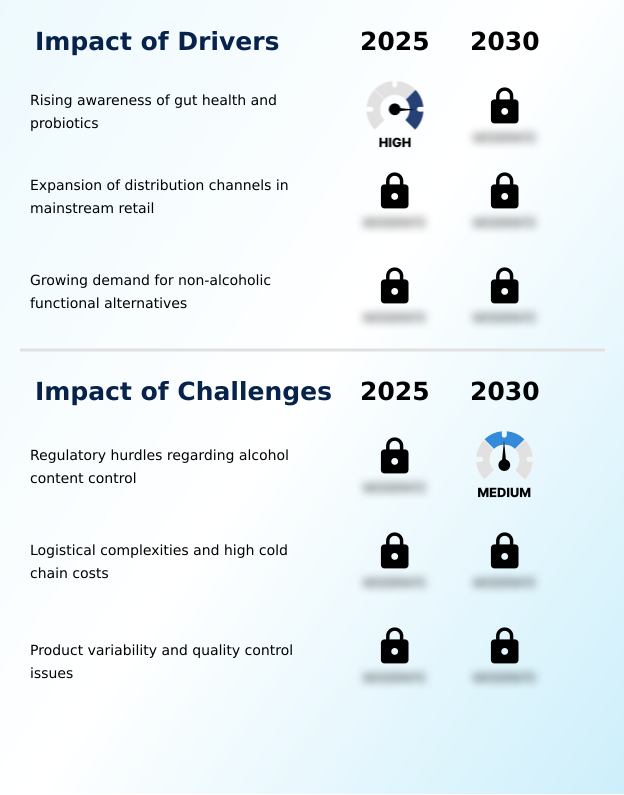
What are the key market drivers leading to the rise in the adoption of Kombucha Industry?

  • The primary market driver is the rising consumer awareness regarding the importance of gut health and the benefits of probiotics.

  • Market growth is fundamentally driven by a greater understanding of digestive wellness and the gut-brain axis support provided by probiotic microbial cultures.
  • The meticulous scoby fermentation process, including secondary fermentation techniques, results in beneficial gluconic acid production and acetic acid fermentation, creating an antioxidant rich beverage.
  • Consumers are now seeking products with probiotic strain verification, leading to a 40% higher retention rate for brands that provide this transparency.
  • The demand for sophisticated, healthy alternatives to traditional social drinks has positioned kombucha as a leading functional social tonic, particularly with low-sugar fermentation methods that appeal to health-conscious demographics.
  • Ensuring consistency and preventing flavor drift prevention are key to capitalizing on this trend, as the market for beverages offering immune system modulation and metabolic health benefits expands.

What are the market trends shaping the Kombucha Industry?

  • The market is witnessing a significant trend toward the diversification of hard kombucha flavors. This evolution is blurring the lines between the functional wellness and alcoholic beverage industries.

  • Key market trends are reshaping product development and consumer engagement. The rise of the sober curious beverage market has fueled innovation in hard kombucha brewing, with high-gravity fermentation techniques enabling producers to create better-for-you alcohol alternative options. These products now constitute over 15% of new launches in the category.
  • Concurrently, hyper-functional beverages are gaining traction, integrating adaptogen infusion techniques and superfood ingredient integration to offer targeted health benefits. Nano-emulsification of extracts ensures the stability and bioavailability of these compounds. On the packaging front, a major shift towards sustainable packaging solutions is evident.
  • The adoption of aluminum can packaging and biodegradable labeling materials has increased by 30%, driven by consumer demand for zero-waste brewing and environmentally responsible brands, with refillable growler systems emerging in urban retail.

What challenges does the Kombucha Industry face during its growth?

  • A key challenge affecting industry growth involves navigating the regulatory hurdles associated with controlling alcohol content in fermented beverages.

  • Navigating operational and regulatory complexities remains a primary challenge. Strict alcohol by volume (abv) control is critical, necessitating investment in fermented tea stabilization technologies to ensure compliance. While heat pasteurization process offers stability, it compromises the live culture preservation that core consumers demand, reducing the effective colony forming unit (cfu) count by up to 99%.
  • Consequently, maintaining the delicate yeast and bacteria balance without pasteurization is a key differentiator. Microbial drift management and scoby genetics mapping are becoming essential for batch consistency control. Furthermore, logistical hurdles, including the need for packaging with superior packaging light protection, contribute significantly to costs.
  • Producers are exploring ambient-stable formulation and advanced quality control protocols, including systems for spoilage microorganism detection, to mitigate these issues and ensure product integrity across the supply chain.

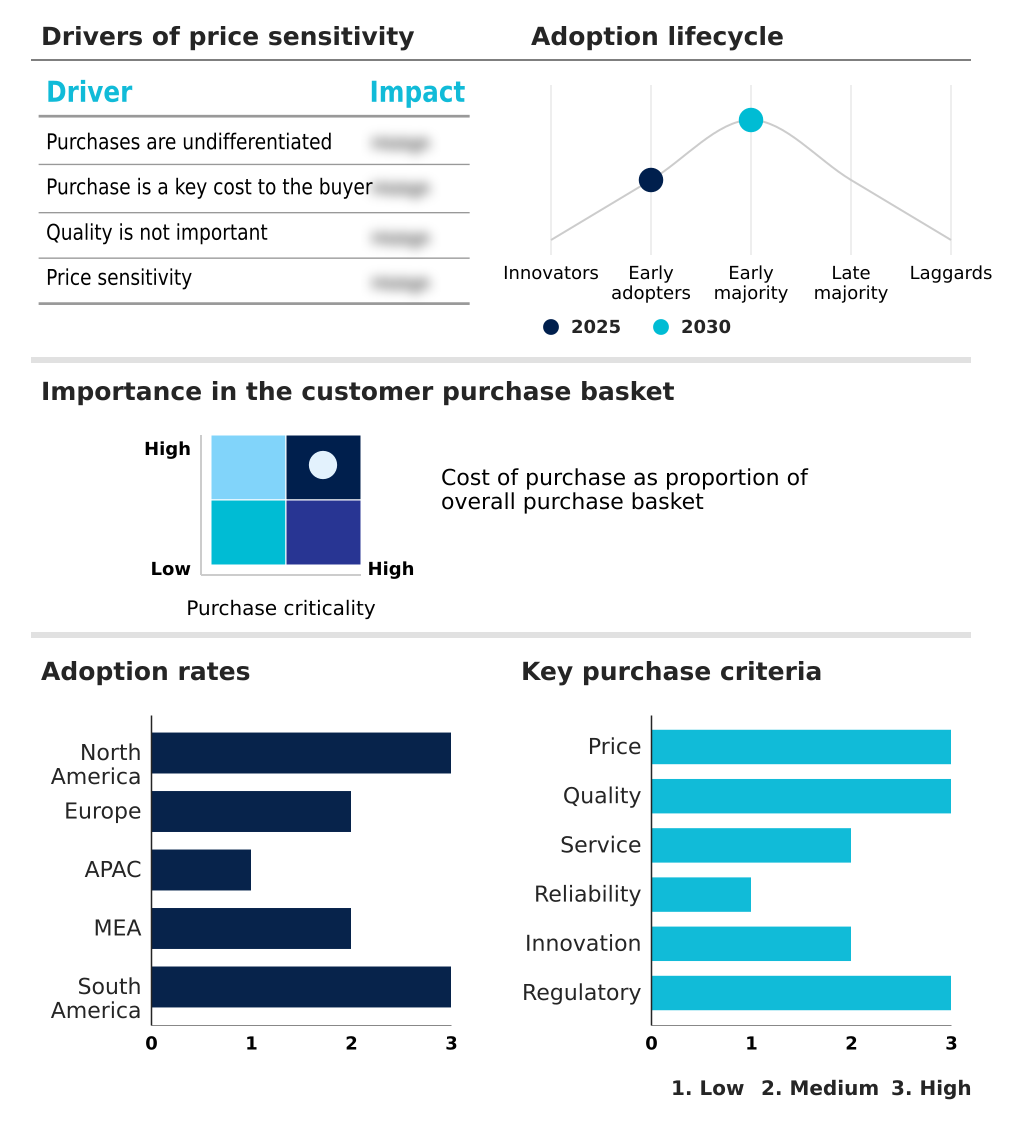
Exclusive Technavio Analysis on Customer Landscape

The kombucha market forecasting report includes the adoption lifecycle of the market, covering from the innovator’s stage to the laggard’s stage. It focuses on adoption rates in different regions based on penetration. Furthermore, the kombucha market report also includes key purchase criteria and drivers of price sensitivity to help companies evaluate and develop their market growth analysis strategies.

Customer Landscape of Kombucha Industry

Competitive Landscape

Companies are implementing various strategies, such as strategic alliances, kombucha market forecast, partnerships, mergers and acquisitions, geographical expansion, and product/service launches, to enhance their presence in the industry.

Better Booch - This entity pioneers fermented wellness beverages, specializing in raw, unpasteurized formulations designed to support digestive health through a diverse range of live and active probiotic cultures.

The industry research and growth report includes detailed analyses of the competitive landscape of the market and information about key companies, including:

  • Better Booch
  • Brew Dr Kombucha
  • Fermented Sciences Inc.
  • Flower of Life Ltd.
  • GTs Living Foods
  • Health Ade LLC
  • Holy Kombucha
  • Humm Kombucha LLC
  • Jarr Kombucha
  • JuneShine
  • Koe Kombucha
  • Lo Bros
  • PepsiCo Inc.
  • Remedy Drinks Pty Ltd.
  • RISE Kombucha
  • Tea Biotics Kombucha
  • The Gutsy Captain Co.
  • The Real Drinks Co.
  • Wild Bay Kombucha
  • World Kombucha

Qualitative and quantitative analysis of companies has been conducted to help clients understand the wider business environment as well as the strengths and weaknesses of key industry players. Data is qualitatively analyzed to categorize companies as pure play, category-focused, industry-focused, and diversified; it is quantitatively analyzed to categorize companies as dominant, leading, strong, tentative, and weak.

Recent Development and News in Kombucha market

  • In January 2025, Health Ade LLC released a clinical white paper substantiating the specific digestive benefits of its proprietary fermentation process, significantly boosting consumer trust and category validation.
  • In November 2024, PepsiCo Inc. launched a new line of its KeVita kombucha infused with adaptogens like ashwagandha, targeting the growing demand for beverages that support cognitive health and stress management.
  • In March 2025, a leading retail analytics firm reported that dedicated shelf space for fermented functional drinks in major North American and European supermarkets increased by 20% in the first quarter, indicating strong retailer confidence.
  • In May 2025, beverage industry publication BevNET released a strategic analysis highlighting the rise of functional social tonics, noting that nearly 30% of premium bar programs now feature kombucha on tap to meet evolving consumer demands.

Dive into Technavio’s robust research methodology, blending expert interviews, extensive data synthesis, and validated models for unparalleled Kombucha Market insights. See full methodology.

Market Scope
Page number 288
Base year 2025
Historic period 2020-2024
Forecast period 2026-2030
Growth momentum & CAGR Accelerate at a CAGR of 20%
Market growth 2026-2030 USD 7646.1 million
Market structure Fragmented
YoY growth 2025-2026(%) 17.9%
Key countries US, Canada, Mexico, Germany, UK, France, Italy, Spain, Sweden, China, Japan, India, South Korea, Australia, Singapore, South Africa, Saudi Arabia, UAE, Egypt, Nigeria, Brazil, Argentina and Colombia
Competitive landscape Leading Companies, Market Positioning of Companies, Competitive Strategies, and Industry Risks

Request Free Sample

Research Analyst Overview

  • The kombucha market's evolution hinges on mastering the core scoby fermentation process and the underlying symbiotic culture of bacteria and yeast. Success requires precise batch consistency control and real-time ph monitoring to manage gluconic acid production and acetic acid fermentation.
  • A key boardroom decision involves choosing between an unpasteurized functional beverage, which necessitates costly cold chain logistics management for live culture preservation, versus a shelf-stable product using sterile filtration methods or heat pasteurization process. This choice impacts the final probiotic microbial cultures and the ability to market a raw kombucha processing benefit.
  • Furthermore, alcohol by volume (abv) control is a critical compliance factor, leading to investment in fermented tea stabilization and microbial drift management, sometimes through scoby genetics mapping. Product innovation is centered on low-sugar fermentation methods, secondary fermentation techniques, and unique botanical extract flavoring. The growth of hard kombucha brewing relies on high-gravity fermentation to create a non-alcoholic fermented beverage alternative.
  • The supply chain demands excellence in organic tea leaf sourcing and cane sugar conversion, while packaging strategy weighs glass bottle fermentation against aluminum can packaging or kegged kombucha systems for draft kombucha dispensing.
  • Ultimately, sustainable packaging solutions and advanced probiotic beverage formulation, including adaptogen infusion techniques and superfood ingredient integration, are defining the competitive edge, with integrated producers achieving a 15% reduction in time-to-market.

What are the Key Data Covered in this Kombucha Market Research and Growth Report?

  • What is the expected growth of the Kombucha Market between 2026 and 2030?

    • USD 7.65 billion, at a CAGR of 20%

  • What segmentation does the market report cover?

    • The report is segmented by Type (Organic, and Non-organic), Distribution Channel (Offline, and Online), Packaging (Bottle, Cans, and Others) and Geography (North America, Europe, APAC, Middle East and Africa, South America)

  • Which regions are analyzed in the report?

    • North America, Europe, APAC, Middle East and Africa and South America

  • What are the key growth drivers and market challenges?

    • Rising awareness of gut health and probiotics, Regulatory hurdles regarding alcohol content control

  • Who are the major players in the Kombucha Market?

    • Better Booch, Brew Dr Kombucha, Fermented Sciences Inc., Flower of Life Ltd., GTs Living Foods, Health Ade LLC, Holy Kombucha, Humm Kombucha LLC, Jarr Kombucha, JuneShine, Koe Kombucha, Lo Bros, PepsiCo Inc., Remedy Drinks Pty Ltd., RISE Kombucha, Tea Biotics Kombucha, The Gutsy Captain Co., The Real Drinks Co., Wild Bay Kombucha and World Kombucha

Market Research Insights

  • Market dynamics are increasingly shaped by sophisticated quality control protocols and consumer demand for supply chain transparency. Brands leveraging detailed organic acid profile analysis and probiotic strain verification are experiencing customer loyalty rates up to 25% higher than competitors.
  • The move toward advanced brewing automation and improved fermentation vessel design has enabled producers to enhance consistency, reducing sensory profile evaluation failures by 18%. As the sober curious beverage market expands, a focus on beverage carbonation level and flavor drift prevention becomes critical.
  • Furthermore, adherence to regulatory compliance for abv and robust food safety standards are non-negotiable for market access, driving investment in technologies that ensure product integrity from production to consumption.

We can help! Our analysts can customize this kombucha market research report to meet your requirements.

Get in touch

1. Executive Summary

1.1 Market overview

Executive Summary - Chart on Market Overview
Executive Summary - Data Table on Market Overview
Executive Summary - Chart on Global Market Characteristics
Executive Summary - Chart on Market by Geography
Executive Summary - Chart on Market Segmentation by Type
Executive Summary - Chart on Market Segmentation by Distribution Channel
Executive Summary - Chart on Market Segmentation by Packaging
Executive Summary - Chart on Incremental Growth
Executive Summary - Data Table on Incremental Growth
Executive Summary - Chart on Company Market Positioning

2. Technavio Analysis

2.1 Analysis of price sensitivity, lifecycle, customer purchase basket, adoption rates, and purchase criteria

2.2 Criticality of inputs and Factors of differentiation

Chart on Overview on criticality of inputs and factors of differentiation

2.3 Factors of disruption

Chart on Overview on factors of disruption

2.4 Impact of drivers and challenges

Chart on Impact of drivers and challenges in 2025 and 2030

3. Market Landscape

3.1 Market ecosystem

Chart on Parent Market
Data Table on - Parent Market

3.2 Market characteristics

Chart on Market characteristics analysis

3.3 Value chain analysis

Chart on Value chain analysis

4. Market Sizing

4.1 Market definition

Data Table on Offerings of companies included in the market definition

4.2 Market segment analysis

Market segments

4.3 Market size 2025

4.4 Market outlook: Forecast for 2025-2030

Chart on Global - Market size and forecast 2025-2030 ($ million)
Data Table on Global - Market size and forecast 2025-2030 ($ million)
Chart on Global Market: Year-over-year growth 2025-2030 (%)
Data Table on Global Market: Year-over-year growth 2025-2030 (%)

5. Historic Market Size

5.1 Global Kombucha Market 2020 - 2024

Historic Market Size - Data Table on Global Kombucha Market 2020 - 2024 ($ million)

5.2 Type segment analysis 2020 - 2024

Historic Market Size - Type Segment 2020 - 2024 ($ million)

5.3 Distribution Channel segment analysis 2020 - 2024

Historic Market Size - Distribution Channel Segment 2020 - 2024 ($ million)

5.4 Packaging segment analysis 2020 - 2024

Historic Market Size - Packaging Segment 2020 - 2024 ($ million)

5.5 Geography segment analysis 2020 - 2024

Historic Market Size - Geography Segment 2020 - 2024 ($ million)

5.6 Country segment analysis 2020 - 2024

Historic Market Size - Country Segment 2020 - 2024 ($ million)

6. Qualitative Analysis

6.1 Impact of AI on Global Kombucha Market

7. Five Forces Analysis

7.1 Five forces summary

Five forces analysis - Comparison between 2025 and 2030

7.2 Bargaining power of buyers

Bargaining power of buyers - Impact of key factors 2025 and 2030

7.3 Bargaining power of suppliers

Bargaining power of suppliers - Impact of key factors in 2025 and 2030

7.4 Threat of new entrants

Threat of new entrants - Impact of key factors in 2025 and 2030

7.5 Threat of substitutes

Threat of substitutes - Impact of key factors in 2025 and 2030

7.6 Threat of rivalry

Threat of rivalry - Impact of key factors in 2025 and 2030

7.7 Market condition

Chart on Market condition - Five forces 2025 and 2030

8. Market Segmentation by Type

8.1 Market segments

Chart on Type - Market share 2025-2030 (%)
Data Table on Type - Market share 2025-2030 (%)

8.2 Comparison by Type

Chart on Comparison by Type
Data Table on Comparison by Type

8.3 Organic - Market size and forecast 2025-2030

Chart on Organic - Market size and forecast 2025-2030 ($ million)
Data Table on Organic - Market size and forecast 2025-2030 ($ million)
Chart on Organic - Year-over-year growth 2025-2030 (%)
Data Table on Organic - Year-over-year growth 2025-2030 (%)

8.4 Non-organic - Market size and forecast 2025-2030

Chart on Non-organic - Market size and forecast 2025-2030 ($ million)
Data Table on Non-organic - Market size and forecast 2025-2030 ($ million)
Chart on Non-organic - Year-over-year growth 2025-2030 (%)
Data Table on Non-organic - Year-over-year growth 2025-2030 (%)

8.5 Market opportunity by Type

Market opportunity by Type ($ million)
Data Table on Market opportunity by Type ($ million)

9. Market Segmentation by Distribution Channel

9.1 Market segments

Chart on Distribution Channel - Market share 2025-2030 (%)
Data Table on Distribution Channel - Market share 2025-2030 (%)

9.2 Comparison by Distribution Channel

Chart on Comparison by Distribution Channel
Data Table on Comparison by Distribution Channel

9.3 Offline - Market size and forecast 2025-2030

Chart on Offline - Market size and forecast 2025-2030 ($ million)
Data Table on Offline - Market size and forecast 2025-2030 ($ million)
Chart on Offline - Year-over-year growth 2025-2030 (%)
Data Table on Offline - Year-over-year growth 2025-2030 (%)

9.4 Online - Market size and forecast 2025-2030

Chart on Online - Market size and forecast 2025-2030 ($ million)
Data Table on Online - Market size and forecast 2025-2030 ($ million)
Chart on Online - Year-over-year growth 2025-2030 (%)
Data Table on Online - Year-over-year growth 2025-2030 (%)

9.5 Market opportunity by Distribution Channel

Market opportunity by Distribution Channel ($ million)
Data Table on Market opportunity by Distribution Channel ($ million)

10. Market Segmentation by Packaging

10.1 Market segments

Chart on Packaging - Market share 2025-2030 (%)
Data Table on Packaging - Market share 2025-2030 (%)

10.2 Comparison by Packaging

Chart on Comparison by Packaging
Data Table on Comparison by Packaging

10.3 Bottle - Market size and forecast 2025-2030

Chart on Bottle - Market size and forecast 2025-2030 ($ million)
Data Table on Bottle - Market size and forecast 2025-2030 ($ million)
Chart on Bottle - Year-over-year growth 2025-2030 (%)
Data Table on Bottle - Year-over-year growth 2025-2030 (%)

10.4 Cans - Market size and forecast 2025-2030

Chart on Cans - Market size and forecast 2025-2030 ($ million)
Data Table on Cans - Market size and forecast 2025-2030 ($ million)
Chart on Cans - Year-over-year growth 2025-2030 (%)
Data Table on Cans - Year-over-year growth 2025-2030 (%)

10.5 Others - Market size and forecast 2025-2030

Chart on Others - Market size and forecast 2025-2030 ($ million)
Data Table on Others - Market size and forecast 2025-2030 ($ million)
Chart on Others - Year-over-year growth 2025-2030 (%)
Data Table on Others - Year-over-year growth 2025-2030 (%)

10.6 Market opportunity by Packaging

Market opportunity by Packaging ($ million)
Data Table on Market opportunity by Packaging ($ million)

11. Customer Landscape

11.1 Customer landscape overview

Analysis of price sensitivity, lifecycle, customer purchase basket, adoption rates, and purchase criteria

12. Geographic Landscape

12.1 Geographic segmentation

Chart on Market share by geography 2025-2030 (%)
Data Table on Market share by geography 2025-2030 (%)

12.2 Geographic comparison

Chart on Geographic comparison
Data Table on Geographic comparison

12.3 North America - Market size and forecast 2025-2030

Chart on North America - Market size and forecast 2025-2030 ($ million)
Data Table on North America - Market size and forecast 2025-2030 ($ million)
Chart on North America - Year-over-year growth 2025-2030 (%)
Data Table on North America - Year-over-year growth 2025-2030 (%)
Chart on Regional Comparison - North America
Data Table on Regional Comparison - North America

12.3.1 US - Market size and forecast 2025-2030

Chart on US - Market size and forecast 2025-2030 ($ million)
Data Table on US - Market size and forecast 2025-2030 ($ million)
Chart on US - Year-over-year growth 2025-2030 (%)
Data Table on US - Year-over-year growth 2025-2030 (%)

12.3.2 Canada - Market size and forecast 2025-2030

Chart on Canada - Market size and forecast 2025-2030 ($ million)
Data Table on Canada - Market size and forecast 2025-2030 ($ million)
Chart on Canada - Year-over-year growth 2025-2030 (%)
Data Table on Canada - Year-over-year growth 2025-2030 (%)

12.3.3 Mexico - Market size and forecast 2025-2030

Chart on Mexico - Market size and forecast 2025-2030 ($ million)
Data Table on Mexico - Market size and forecast 2025-2030 ($ million)
Chart on Mexico - Year-over-year growth 2025-2030 (%)
Data Table on Mexico - Year-over-year growth 2025-2030 (%)

12.4 Europe - Market size and forecast 2025-2030

Chart on Europe - Market size and forecast 2025-2030 ($ million)
Data Table on Europe - Market size and forecast 2025-2030 ($ million)
Chart on Europe - Year-over-year growth 2025-2030 (%)
Data Table on Europe - Year-over-year growth 2025-2030 (%)
Chart on Regional Comparison - Europe
Data Table on Regional Comparison - Europe

12.4.1 Germany - Market size and forecast 2025-2030

Chart on Germany - Market size and forecast 2025-2030 ($ million)
Data Table on Germany - Market size and forecast 2025-2030 ($ million)
Chart on Germany - Year-over-year growth 2025-2030 (%)
Data Table on Germany - Year-over-year growth 2025-2030 (%)

12.4.2 UK - Market size and forecast 2025-2030

Chart on UK - Market size and forecast 2025-2030 ($ million)
Data Table on UK - Market size and forecast 2025-2030 ($ million)
Chart on UK - Year-over-year growth 2025-2030 (%)
Data Table on UK - Year-over-year growth 2025-2030 (%)

12.4.3 France - Market size and forecast 2025-2030

Chart on France - Market size and forecast 2025-2030 ($ million)
Data Table on France - Market size and forecast 2025-2030 ($ million)
Chart on France - Year-over-year growth 2025-2030 (%)
Data Table on France - Year-over-year growth 2025-2030 (%)

12.4.4 Italy - Market size and forecast 2025-2030

Chart on Italy - Market size and forecast 2025-2030 ($ million)
Data Table on Italy - Market size and forecast 2025-2030 ($ million)
Chart on Italy - Year-over-year growth 2025-2030 (%)
Data Table on Italy - Year-over-year growth 2025-2030 (%)

12.4.5 Spain - Market size and forecast 2025-2030

Chart on Spain - Market size and forecast 2025-2030 ($ million)
Data Table on Spain - Market size and forecast 2025-2030 ($ million)
Chart on Spain - Year-over-year growth 2025-2030 (%)
Data Table on Spain - Year-over-year growth 2025-2030 (%)

12.4.6 Sweden - Market size and forecast 2025-2030

Chart on Sweden - Market size and forecast 2025-2030 ($ million)
Data Table on Sweden - Market size and forecast 2025-2030 ($ million)
Chart on Sweden - Year-over-year growth 2025-2030 (%)
Data Table on Sweden - Year-over-year growth 2025-2030 (%)

12.5 APAC - Market size and forecast 2025-2030

Chart on APAC - Market size and forecast 2025-2030 ($ million)
Data Table on APAC - Market size and forecast 2025-2030 ($ million)
Chart on APAC - Year-over-year growth 2025-2030 (%)
Data Table on APAC - Year-over-year growth 2025-2030 (%)
Chart on Regional Comparison - APAC
Data Table on Regional Comparison - APAC

12.5.1 China - Market size and forecast 2025-2030

Chart on China - Market size and forecast 2025-2030 ($ million)
Data Table on China - Market size and forecast 2025-2030 ($ million)
Chart on China - Year-over-year growth 2025-2030 (%)
Data Table on China - Year-over-year growth 2025-2030 (%)

12.5.2 Japan - Market size and forecast 2025-2030

Chart on Japan - Market size and forecast 2025-2030 ($ million)
Data Table on Japan - Market size and forecast 2025-2030 ($ million)
Chart on Japan - Year-over-year growth 2025-2030 (%)
Data Table on Japan - Year-over-year growth 2025-2030 (%)

12.5.3 India - Market size and forecast 2025-2030

Chart on India - Market size and forecast 2025-2030 ($ million)
Data Table on India - Market size and forecast 2025-2030 ($ million)
Chart on India - Year-over-year growth 2025-2030 (%)
Data Table on India - Year-over-year growth 2025-2030 (%)

12.5.4 South Korea - Market size and forecast 2025-2030

Chart on South Korea - Market size and forecast 2025-2030 ($ million)
Data Table on South Korea - Market size and forecast 2025-2030 ($ million)
Chart on South Korea - Year-over-year growth 2025-2030 (%)
Data Table on South Korea - Year-over-year growth 2025-2030 (%)

12.5.5 Australia - Market size and forecast 2025-2030

Chart on Australia - Market size and forecast 2025-2030 ($ million)
Data Table on Australia - Market size and forecast 2025-2030 ($ million)
Chart on Australia - Year-over-year growth 2025-2030 (%)
Data Table on Australia - Year-over-year growth 2025-2030 (%)

12.5.6 Singapore - Market size and forecast 2025-2030

Chart on Singapore - Market size and forecast 2025-2030 ($ million)
Data Table on Singapore - Market size and forecast 2025-2030 ($ million)
Chart on Singapore - Year-over-year growth 2025-2030 (%)
Data Table on Singapore - Year-over-year growth 2025-2030 (%)

12.6 Middle East and Africa - Market size and forecast 2025-2030

Chart on Middle East and Africa - Market size and forecast 2025-2030 ($ million)
Data Table on Middle East and Africa - Market size and forecast 2025-2030 ($ million)
Chart on Middle East and Africa - Year-over-year growth 2025-2030 (%)
Data Table on Middle East and Africa - Year-over-year growth 2025-2030 (%)
Chart on Regional Comparison - Middle East and Africa
Data Table on Regional Comparison - Middle East and Africa

12.6.1 South Africa - Market size and forecast 2025-2030

Chart on South Africa - Market size and forecast 2025-2030 ($ million)
Data Table on South Africa - Market size and forecast 2025-2030 ($ million)
Chart on South Africa - Year-over-year growth 2025-2030 (%)
Data Table on South Africa - Year-over-year growth 2025-2030 (%)

12.6.2 Saudi Arabia - Market size and forecast 2025-2030

Chart on Saudi Arabia - Market size and forecast 2025-2030 ($ million)
Data Table on Saudi Arabia - Market size and forecast 2025-2030 ($ million)
Chart on Saudi Arabia - Year-over-year growth 2025-2030 (%)
Data Table on Saudi Arabia - Year-over-year growth 2025-2030 (%)

12.6.3 UAE - Market size and forecast 2025-2030

Chart on UAE - Market size and forecast 2025-2030 ($ million)
Data Table on UAE - Market size and forecast 2025-2030 ($ million)
Chart on UAE - Year-over-year growth 2025-2030 (%)
Data Table on UAE - Year-over-year growth 2025-2030 (%)

12.6.4 Egypt - Market size and forecast 2025-2030

Chart on Egypt - Market size and forecast 2025-2030 ($ million)
Data Table on Egypt - Market size and forecast 2025-2030 ($ million)
Chart on Egypt - Year-over-year growth 2025-2030 (%)
Data Table on Egypt - Year-over-year growth 2025-2030 (%)

12.6.5 Nigeria - Market size and forecast 2025-2030

Chart on Nigeria - Market size and forecast 2025-2030 ($ million)
Data Table on Nigeria - Market size and forecast 2025-2030 ($ million)
Chart on Nigeria - Year-over-year growth 2025-2030 (%)
Data Table on Nigeria - Year-over-year growth 2025-2030 (%)

12.7 South America - Market size and forecast 2025-2030

Chart on South America - Market size and forecast 2025-2030 ($ million)
Data Table on South America - Market size and forecast 2025-2030 ($ million)
Chart on South America - Year-over-year growth 2025-2030 (%)
Data Table on South America - Year-over-year growth 2025-2030 (%)
Chart on Regional Comparison - South America
Data Table on Regional Comparison - South America

12.7.1 Brazil - Market size and forecast 2025-2030

Chart on Brazil - Market size and forecast 2025-2030 ($ million)
Data Table on Brazil - Market size and forecast 2025-2030 ($ million)
Chart on Brazil - Year-over-year growth 2025-2030 (%)
Data Table on Brazil - Year-over-year growth 2025-2030 (%)

12.7.2 Argentina - Market size and forecast 2025-2030

Chart on Argentina - Market size and forecast 2025-2030 ($ million)
Data Table on Argentina - Market size and forecast 2025-2030 ($ million)
Chart on Argentina - Year-over-year growth 2025-2030 (%)
Data Table on Argentina - Year-over-year growth 2025-2030 (%)

12.7.3 Colombia - Market size and forecast 2025-2030

Chart on Colombia - Market size and forecast 2025-2030 ($ million)
Data Table on Colombia - Market size and forecast 2025-2030 ($ million)
Chart on Colombia - Year-over-year growth 2025-2030 (%)
Data Table on Colombia - Year-over-year growth 2025-2030 (%)

12.8 Market opportunity by geography

Market opportunity by geography ($ million)
Data Tables on Market opportunity by geography ($ million)

13. Drivers, Challenges, and Opportunity

13.1 Market drivers

Rising awareness of gut health and probiotics
Expansion of distribution channels in mainstream retail
Growing demand for non-alcoholic functional alternatives

13.2 Market challenges

Regulatory hurdles regarding alcohol content control
Logistical complexities and high cold chain costs
Product variability and quality control issues

13.3 Impact of drivers and challenges

Impact of drivers and challenges in 2025 and 2030

13.4 Market opportunities

Diversification of hard kombucha flavours
Integration of adaptogens and superfoods for enhanced functionality
Shift toward sustainable and plastic free packaging solutions

14. Competitive Landscape

14.1 Overview

14.2

Overview on criticality of inputs and factors of differentiation

14.3 Landscape disruption

Overview on factors of disruption

14.4 Industry risks

Impact of key risks on business

15. Competitive Analysis

15.1 Companies profiled

Companies covered

15.2 Company ranking index

15.3 Market positioning of companies

Matrix on companies position and classification

15.4 Better Booch

Better Booch - Overview
Better Booch - Product / Service
Better Booch - Key offerings
SWOT

15.5 Brew Dr Kombucha

Brew Dr Kombucha - Overview
Brew Dr Kombucha - Product / Service
Brew Dr Kombucha - Key offerings
SWOT

15.6 Fermented Sciences Inc.

Fermented Sciences Inc. - Overview
Fermented Sciences Inc. - Product / Service
Fermented Sciences Inc. - Key offerings
SWOT

15.7 Flower of Life Ltd.

Flower of Life Ltd. - Overview
Flower of Life Ltd. - Product / Service
Flower of Life Ltd. - Key offerings
SWOT

15.8 GTs Living Foods

GTs Living Foods - Overview
GTs Living Foods - Product / Service
GTs Living Foods - Key offerings
SWOT

15.9 Health Ade LLC

Health Ade LLC - Overview
Health Ade LLC - Product / Service
Health Ade LLC - Key offerings
SWOT

15.10 Humm Kombucha LLC

Humm Kombucha LLC - Overview
Humm Kombucha LLC - Product / Service
Humm Kombucha LLC - Key offerings
SWOT

15.11 JuneShine

JuneShine - Overview
JuneShine - Product / Service
JuneShine - Key offerings
SWOT

15.12 Koe Kombucha

Koe Kombucha - Overview
Koe Kombucha - Product / Service
Koe Kombucha - Key offerings
SWOT

15.13 Lo Bros

Lo Bros - Overview
Lo Bros - Product / Service
Lo Bros - Key offerings
SWOT

15.14 PepsiCo Inc.

PepsiCo Inc. - Overview
PepsiCo Inc. - Business segments
PepsiCo Inc. - Key news
PepsiCo Inc. - Key offerings
PepsiCo Inc. - Segment focus
SWOT

15.15 Remedy Drinks Pty Ltd.

Remedy Drinks Pty Ltd. - Overview
Remedy Drinks Pty Ltd. - Product / Service
Remedy Drinks Pty Ltd. - Key offerings
SWOT

15.16 RISE Kombucha

RISE Kombucha - Overview
RISE Kombucha - Product / Service
RISE Kombucha - Key offerings
SWOT

15.17 The Gutsy Captain Co.

The Gutsy Captain Co. - Overview
The Gutsy Captain Co. - Product / Service
The Gutsy Captain Co. - Key offerings
SWOT

15.18 The Real Drinks Co.

The Real Drinks Co. - Overview
The Real Drinks Co. - Product / Service
The Real Drinks Co. - Key offerings
SWOT

16. Appendix

16.1 Scope of the report

Market definition
Objectives
Notes and caveats

16.2 Inclusions and exclusions checklist

Inclusions checklist
Exclusions checklist

16.3 Currency conversion rates for US$

16.4 Research methodology

16.5 Data procurement

Information sources

16.6 Data validation

16.7 Validation techniques employed for market sizing

16.8 Data synthesis

16.9 360 degree market analysis

16.10 List of abbreviations

Research Methodology

Technavio presents a detailed picture of the market by way of study, synthesis, and summation of data from multiple sources. The analysts have presented the various facets of the market with a particular focus on identifying the key industry influencers. The data thus presented is comprehensive, reliable, and the result of extensive research, both primary and secondary.

INFORMATION SOURCES

Primary sources

  • Manufacturers and suppliers
  • Channel partners
  • Industry experts
  • Strategic decision makers

Secondary sources

  • Industry journals and periodicals
  • Government data
  • Financial reports of key industry players
  • Historical data
  • Press releases

DATA ANALYSIS

Data Synthesis

  • Collation of data
  • Estimation of key figures
  • Analysis of derived insights

Data Validation

  • Triangulation with data models
  • Reference against proprietary databases
  • Corroboration with industry experts

REPORT WRITING

Qualitative

  • Market drivers
  • Market challenges
  • Market trends
  • Five forces analysis

Quantitative

  • Market size and forecast
  • Market segmentation
  • Geographical insights
  • Competitive landscape

Interested in this report?

Get your sample now to see our research methodology and insights!

Download Now

Frequently Asked Questions

Kombucha market growth will increase by USD 7646.1 million during 2026-2030.

The Kombucha market is expected to grow at a CAGR of 20% during 2026-2030.

Kombucha market is segmented by Type (Organic, Non-organic) Distribution channel (Offline, Online) Packaging (Bottle, Cans, Others)

Better Booch, Brew Dr Kombucha, Fermented Sciences Inc., Flower of Life Ltd., GTs Living Foods, Health Ade LLC, Holy Kombucha, Humm Kombucha LLC, Jarr Kombucha, JuneShine, Koe Kombucha, Lo Bros, PepsiCo Inc., Remedy Drinks Pty Ltd., RISE Kombucha, Tea Biotics Kombucha, The Gutsy Captain Co., The Real Drinks Co., Wild Bay Kombucha, World Kombucha are a few of the key vendors in the Kombucha market.

North America will register the highest growth rate of 34.9% among the other regions. Therefore, the Kombucha market in North America is expected to garner significant business opportunities for the vendors during the forecast period.

US, Canada, Mexico, Germany, UK, France, Italy, Spain, Sweden, China, Japan, India, South Korea, Australia, Singapore, South Africa, Saudi Arabia, UAE, Egypt, Nigeria, Brazil, Argentina, Colombia

  • Rising awareness of gut health and probiotics is the driving factor this market.

The Kombucha market vendors should focus on grabbing business opportunities from the Type segment as it accounted for the largest market share in the base year.
RIA - Research AI Assistant
Ask RIA