Kosher Foods Market Analysis, Size, and Forecast 2026-2030: North America (US, Canada, and Mexico), Europe (UK, Germany, and France), Middle East and Africa (Israel, South Africa, and UAE), South America (Brazil and Argentina), APAC (Australia, Japan, and India), and Rest of World (ROW)

Kosher Foods Market Analysis, Size, and Forecast 2026-2030:
North America (US, Canada, and Mexico), Europe (UK, Germany, and France), Middle East and Africa (Israel, South Africa, and UAE), South America (Brazil and Argentina), APAC (Australia, Japan, and India), and Rest of World (ROW)

Published: Apr 2026 304 Pages SKU: IRTNTR44708

Market Overview at a Glance

$17.54 B
Market Opportunity
7.2%
CAGR 2025 - 2030
51.9%
North America Growth
$16.81 B
Kosher pareve segment 2024

Kosher Foods Market Size 2026-2030

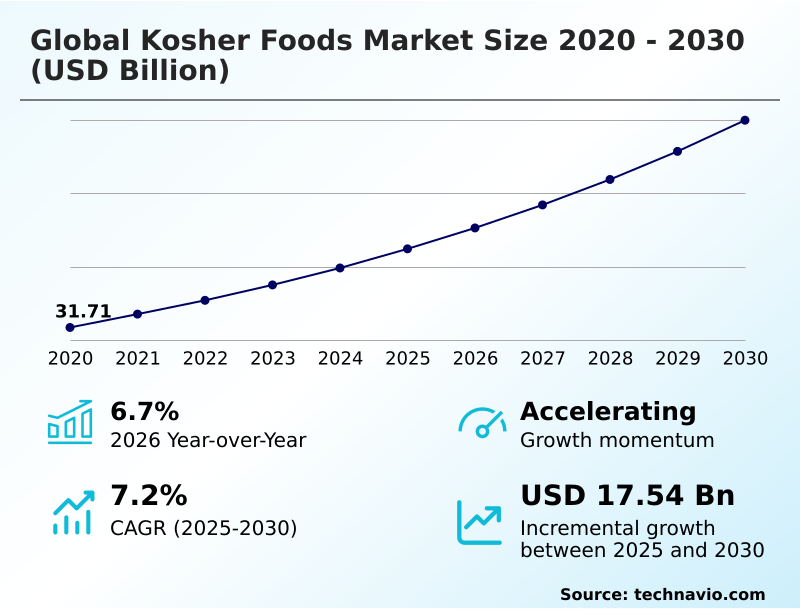
The kosher foods market size is valued to increase by USD 17.54 billion, at a CAGR of 7.2% from 2025 to 2030. Expanding health consciousness and quality assurance will drive the kosher foods market.

Major Market Trends & Insights

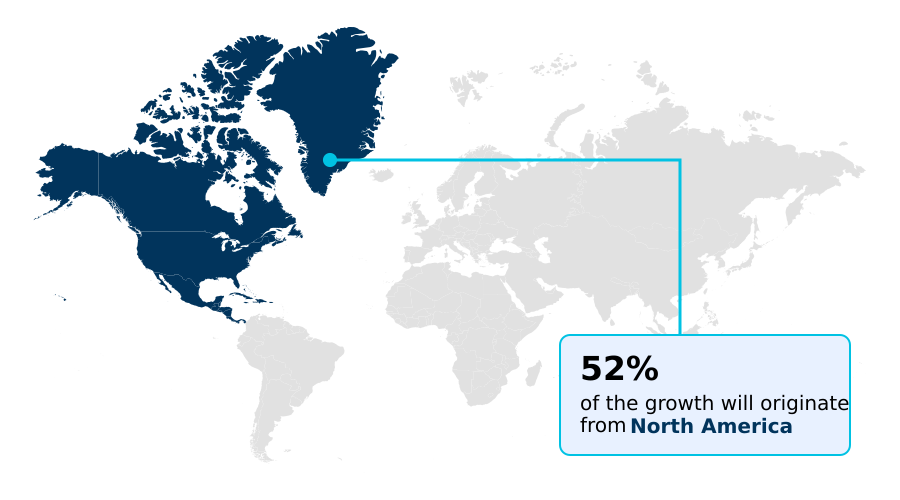
  • North America dominated the market and accounted for a 51.9% growth during the forecast period.
  • By Product - Kosher pareve segment was valued at USD 16.81 billion in 2024
  • By Distribution Channel - Supermarkets and hypermarkets segment accounted for the largest market revenue share in 2024

Market Size & Forecast

  • Market Opportunities: USD 28.26 billion
  • Market Future Opportunities: USD 17.54 billion
  • CAGR from 2025 to 2030 : 7.2%

Market Summary

  • The kosher foods market is undergoing a significant transformation, moving beyond its traditional religious demographic to appeal to a wider audience seeking verified quality and safety. This expansion is driven by a growing perception of the hechsher symbol as a hallmark of rigorous food safety assurance and clean label verification.
  • Adherence to kashrut dietary laws, overseen by stringent mashgiach supervision, provides a level of transparency that resonates with health-conscious consumers, including those following vegan and allergen-free diets. Consequently, manufacturers are increasingly pursuing kosher certification standards for a diverse range of products, from everyday snacks to gourmet items.
  • For instance, a food processor aiming to capture the specialty market for pas yisroel baked goods might implement blockchain technology to ensure complete supply chain traceability, from certified ingredient sourcing to final packaging. This not only guarantees compliance with kosher for passover foods regulations but also reinforces consumer trust.
  • However, the industry faces challenges related to the higher costs of certified production and competition from other food certifications. The market’s trajectory is shaped by its ability to balance tradition with innovation, leveraging its reputation for quality while adapting to modern consumer values and technological advancements.

What will be the Size of the Kosher Foods Market during the forecast period?

Get Key Insights on Market Forecast (PDF) Get Free Sample

How is the Kosher Foods Market Segmented?

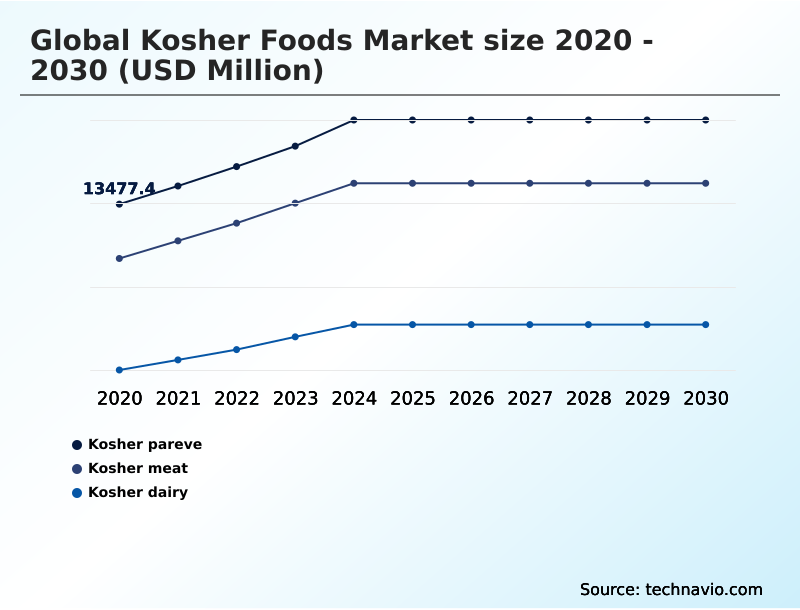
The kosher foods industry research report provides comprehensive data (region-wise segment analysis), with forecasts and estimates in "USD million" for the period 2026-2030, as well as historical data from 2020-2024 for the following segments.

  • Product
    • Kosher pareve
    • Kosher meat
    • Kosher dairy
  • Distribution channel
    • Supermarkets and hypermarkets
    • Grocery stores
    • Online stores
  • End-user
    • Household consumers
    • Food service industry
    • Food processing industry
  • Geography
    • North America
      • US
      • Canada
      • Mexico
    • Europe
      • UK
      • Germany
      • France
    • Middle East and Africa
      • Israel
      • South Africa
      • UAE
    • South America
      • Brazil
      • Argentina
    • APAC
      • Australia
      • Japan
      • India
    • Rest of World (ROW)

By Product Insights

The kosher pareve segment is estimated to witness significant growth during the forecast period.

The kosher pareve segment is expanding beyond its traditional consumer base, increasingly serving as a reliable indicator for vegan and allergen-free diets. This category, which stringently enforces meat and dairy separation, undergoes rigorous mashgiach supervision to ensure religious dietary compliance.

Manufacturers are leveraging this classification, which mandates scrutiny of all food processing additives and requires intense quality control inspection, to appeal to a broader health-conscious demographic.

Adherence to rabbinical oversight in production facilities dedicated to pareve products has led to a 20% reduction in cross-contamination incidents compared to mixed-use lines.

The growing alignment with non-GMO food verification and the demand for enhanced food purity standards are positioning this segment as a significant driver of innovation.

Get Free Sample

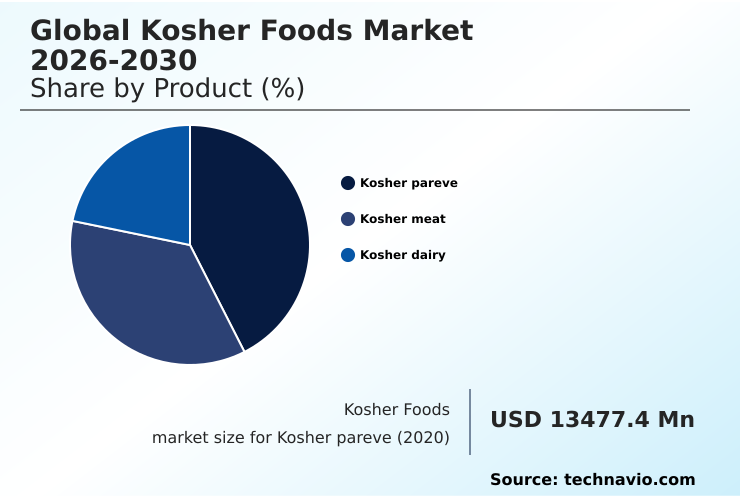
The Kosher pareve segment was valued at USD 16.81 billion in 2024 and showed a gradual increase during the forecast period.

Get Free Sample

Regional Analysis

North America is estimated to contribute 51.9% to the growth of the global market during the forecast period.Technavio’s analysts have elaborately explained the regional trends and drivers that shape the market during the forecast period.

See How Kosher Foods Market Demand is Rising in North America Get Free Sample

The geographic landscape of the market is led by North America, which accounts for 51.9% of incremental growth, driven by a mature consumer base that values transparent food labeling.

This region is a major importer of glatt kosher meat, where every stage of the kosher slaughtering method, including bedikah internal inspection and nikur deveining process, is scrutinized.

In contrast, APAC is the fastest-growing region, with a 9% CAGR, as it becomes a critical hub for certified ingredient sourcing.

The demand here is not just for finished goods like chalav yisrael products but for raw materials that meet global standards.

The integrity of the international supply chain relies on technologies that ensure food fraud prevention and complete supply chain traceability, validating ethical food production claims across continents.

Market Dynamics

Our researchers analyzed the data with 2025 as the base year, along with the key drivers, trends, and challenges. A holistic analysis of drivers will help companies refine their marketing strategies to gain a competitive advantage.

  • The evolution of the kosher foods market is increasingly influenced by specific consumer needs and technological advancements. The synergy between kosher pareve for vegan consumers and the broader trend of plant-based diets is a significant growth area, with kosher certification for plant-based foods becoming a key differentiator.
  • This has led to a focus on kosher pareve as a dairy-free indicator, reinforcing consumer trust in kosher certification. However, challenges in kosher ingredient sourcing and complex supply chain logistics for kosher meat persist. In response, firms are adopting blockchain for kosher supply chain management and other kosher food traceability technology, which helps address kosher meat export regulations.
  • The market is also seeing a growth of artisanal kosher products and innovation in kosher for passover products. As producers navigate the kosher certification cost for manufacturers and the nuances of kosher dairy production standards, they are also exploring integrating kosher and organic certifications.
  • Companies that successfully achieve this dual status have demonstrated market penetration rates in specialty health stores nearly twice those of singly certified brands. This shift underscores the importance of effective marketing strategies for kosher foods to non-jewish consumers, leveraging the appeal of rabbinical supervision in food processing and the perceived high standards of the shechita process and animal welfare.
  • The expansion of online retail for kosher products is further widening market access, changing the competitive landscape.

What are the key market drivers leading to the rise in the adoption of Kosher Foods Industry?

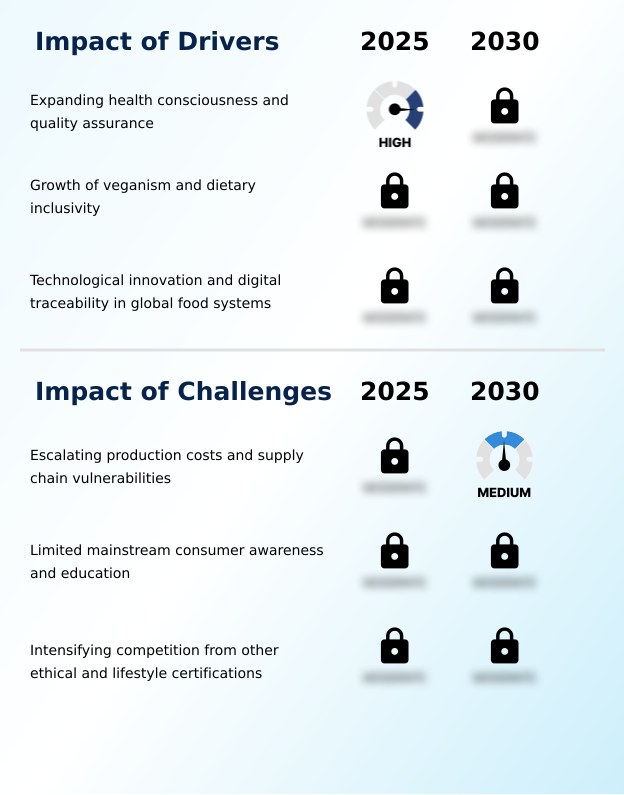
  • Expanding health consciousness among consumers and a growing demand for quality assurance are key drivers propelling market growth.

  • The market's expansion is fundamentally driven by the growing perception of the hechsher symbol as a benchmark for food safety assurance and quality.
  • The stringent kashrut dietary laws and the detailed shechita process provide a level of clean label verification that resonates beyond religious observers.
  • The pareve designation is increasingly used by consumers as a reliable proxy for plant-based diet compatibility, a crossover that has broadened the consumer base by over 30% in some categories.
  • This is reinforced by the rigorous nature of the third-party food audit inherent in obtaining kosher certification standards.
  • As a result, the certification serves as one of the most powerful consumer trust indicators in the food industry, driving both loyalty and new customer acquisition.
  • Firms that highlight their compliance in marketing materials see an average 10% uplift in engagement.

What are the market trends shaping the Kosher Foods Industry?

  • The kosher sector is experiencing a notable trend toward premiumization, marked by a surge in artisanal product offerings that cater to evolving consumer preferences for high-quality, specialized goods.

  • The market is witnessing a significant trend toward premiumization, with a notable rise in artisanal food production. This shift is driven by consumer demand for gourmet food certification and products with high-quality attributes, expanding the specialty food market. Companies focusing on this niche report that achieving premium food certification can increase profit margins by up to 15%.
  • This trend is particularly evident in categories like pas yisroel baked goods and specialty kosher for passover foods. Innovation in ingredients, such as the development of a kosher gelatin alternative and the careful sourcing of animal-derived enzymes, is enabling this growth. Furthermore, the alignment with other certifications, particularly organic food alignment and dairy-free certification, is creating new opportunities.
  • Retailers have noted a 20% increase in sales velocity for products that carry both kosher and organic labels.

What challenges does the Kosher Foods Industry face during its growth?

  • Escalating production costs, coupled with inherent supply chain vulnerabilities, present a key challenge to the industry's growth trajectory.

  • Key challenges in the market stem from the operational complexities and costs associated with strict manufacturing protocol adherence. The kashering process and the bishul yisrael requirement add significant overhead, impacting price competitiveness. For instance, maintaining separate production lines for treif contamination prevention can increase capital expenditures by up to 25%.
  • The need for specific tools like a shechita knife specifications and ingredients like kosher salt properties also constrains the supply chain. Moreover, the market faces intense competition from other labels, where the dual-certification benefits of kosher are not always clearly communicated.
  • While the certification provides clear allergen-free labeling advantages, its value proposition in a crowded market that includes a strong halal food comparison requires constant reinforcement to prevent cross-contamination avoidance from becoming the sole perceived benefit.

Exclusive Technavio Analysis on Customer Landscape

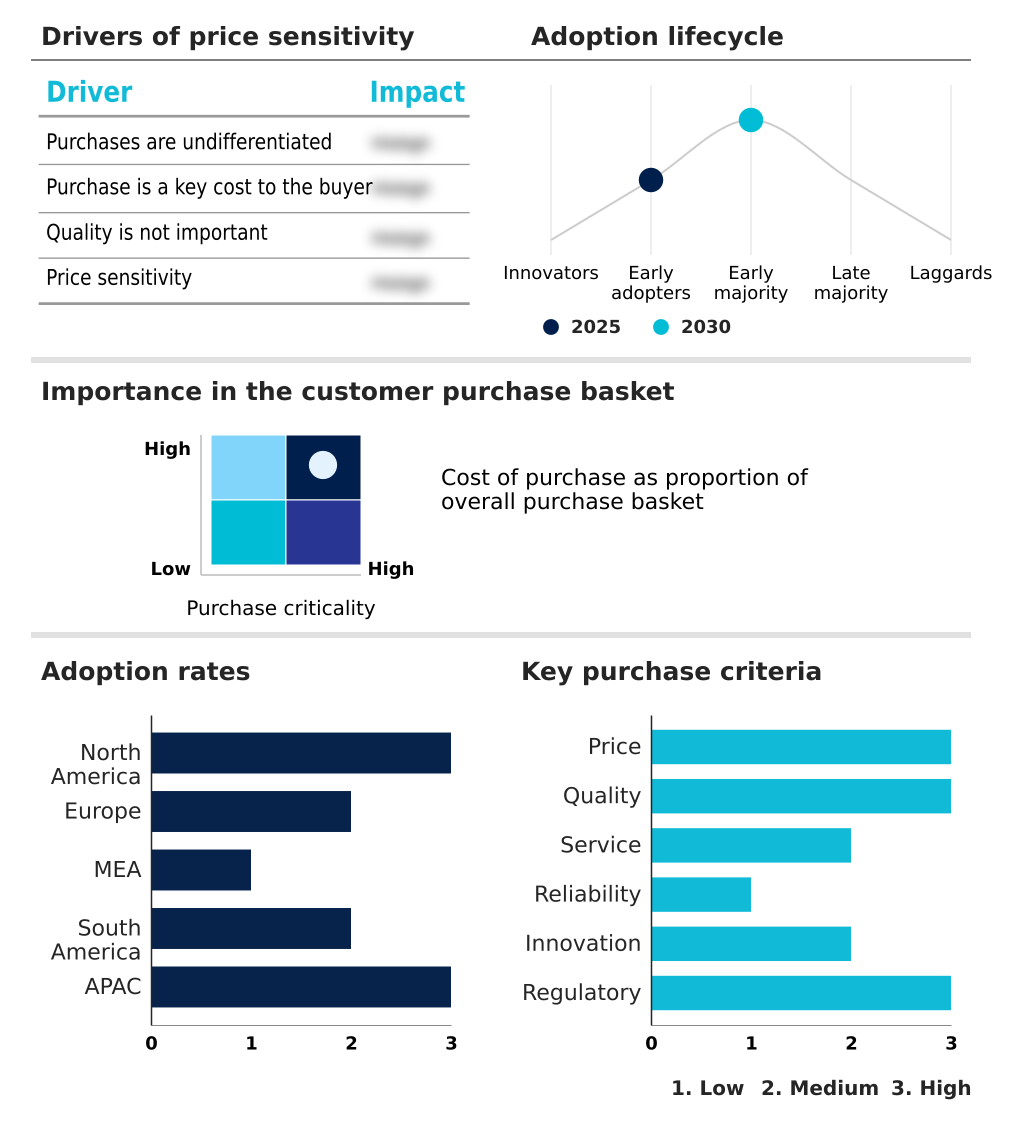
The kosher foods market forecasting report includes the adoption lifecycle of the market, covering from the innovator’s stage to the laggard’s stage. It focuses on adoption rates in different regions based on penetration. Furthermore, the kosher foods market report also includes key purchase criteria and drivers of price sensitivity to help companies evaluate and develop their market growth analysis strategies.

Customer Landscape of Kosher Foods Industry

Competitive Landscape

Companies are implementing various strategies, such as strategic alliances, kosher foods market forecast, partnerships, mergers and acquisitions, geographical expansion, and product/service launches, to enhance their presence in the industry.

AGRANA Beteiligungs AG - Analysis indicates a focus on providing specialized kosher-certified ingredients, including fruit preparations and starches, for the bakery and dairy food processing sectors.

The industry research and growth report includes detailed analyses of the competitive landscape of the market and information about key companies, including:

  • AGRANA Beteiligungs AG
  • Archer Daniels Midland Co.
  • Aron Streit Inc.
  • BASF SE
  • Bobs Red Mill Natural Foods
  • Cargill Inc.
  • Conagra Brands Inc.
  • Dairy Farmers of America Inc.
  • Eden Foods Inc.
  • Empire Kosher Poultry LLC
  • General Mills Inc.
  • Kayco Co.
  • Kellanova
  • Nestle SA
  • PepsiCo Inc.
  • Taja Beverages
  • The Kraft Heinz Co.
  • Unilever PLC

Qualitative and quantitative analysis of companies has been conducted to help clients understand the wider business environment as well as the strengths and weaknesses of key industry players. Data is qualitatively analyzed to categorize companies as pure play, category-focused, industry-focused, and diversified; it is quantitatively analyzed to categorize companies as dominant, leading, strong, tentative, and weak.

Recent Development and News in Kosher foods market

  • In August 2025, IBM Food Trust entered into a landmark partnership with the Orthodox Union to implement blockchain technology across several major kosher meat processing facilities in Europe and South America.
  • In May 2025, Vitasoy International Holdings Limited achieved a significant milestone by obtaining kosher certification for its entire premium beverage line throughout its operations in the Asia Pacific.
  • In March 2025, the popular Asia Pacific food technology startup ZENB, known for its innovative plant based snacks, achieved Certified B Corporation status, creating new competitive pressure for kosher brands.
  • In February 2025, Whole Foods Market introduced an exclusive partnership with several boutique kosher bakeries in the North American region to stock high end seasonal pastries.

Dive into Technavio’s robust research methodology, blending expert interviews, extensive data synthesis, and validated models for unparalleled Kosher Foods Market insights. See full methodology.

Market Scope
Page number 304
Base year 2025
Historic period 2020-2024
Forecast period 2026-2030
Growth momentum & CAGR Accelerate at a CAGR of 7.2%
Market growth 2026-2030 USD 17539.3 million
Market structure Fragmented
YoY growth 2025-2026(%) 6.7%
Key countries US, Canada, Mexico, UK, Germany, France, Italy, Spain, The Netherlands, Israel, South Africa, UAE, Turkey, Saudi Arabia, Brazil, Argentina, Chile, Australia, Japan, India, China, Singapore and South Korea
Competitive landscape Leading Companies, Market Positioning of Companies, Competitive Strategies, and Industry Risks

Request Free Sample

Research Analyst Overview

  • The operational framework of the kosher foods market is built upon strict adherence to kashrut dietary laws, a complex system governed by rigorous kosher certification standards. Central to this is the shechita process, a specific kosher slaughtering method requiring a specialized shechita knife and subsequent bedikah internal inspection to ensure compliance.
  • The integrity of products like glatt kosher meat depends on meticulous procedures such as the nikur deveining process. Constant rabbinical oversight and on-site mashgiach supervision are non-negotiable for validating the hechsher symbol, which signifies compliance. This extends to specialized categories, including chalav yisrael products, pas yisroel baked goods, and foods prepared under the bishul yisrael requirement.
  • The industry invests heavily in treif contamination prevention, employing a thorough kashering process and specific kosher salt properties for sanitation. Facilities implementing rigorous protocols for meat and dairy separation have achieved a 40% reduction in cross-contamination incidents.
  • Furthermore, innovation is evident in the development of kosher gelatin alternatives and the careful screening of animal-derived enzymes and food processing additives to maintain the pareve designation and dairy-free certification, ensuring products like kosher for passover foods meet all requirements for ritual slaughter compliance.

What are the Key Data Covered in this Kosher Foods Market Research and Growth Report?

  • What is the expected growth of the Kosher Foods Market between 2026 and 2030?

    • USD 17.54 billion, at a CAGR of 7.2%

  • What segmentation does the market report cover?

    • The report is segmented by Product (Kosher pareve, Kosher meat, and Kosher dairy), Distribution Channel (Supermarkets and hypermarkets, Grocery stores, and Online stores), End-user (Household consumers, Food service industry, and Food processing industry) and Geography (North America, Europe, Middle East and Africa, South America, APAC)

  • Which regions are analyzed in the report?

    • North America, Europe, Middle East and Africa, South America and APAC

  • What are the key growth drivers and market challenges?

    • Expanding health consciousness and quality assurance, Escalating production costs and supply chain vulnerabilities

  • Who are the major players in the Kosher Foods Market?

    • AGRANA Beteiligungs AG, Archer Daniels Midland Co., Aron Streit Inc., BASF SE, Bobs Red Mill Natural Foods, Cargill Inc., Conagra Brands Inc., Dairy Farmers of America Inc., Eden Foods Inc., Empire Kosher Poultry LLC, General Mills Inc., Kayco Co., Kellanova, Nestle SA, PepsiCo Inc., Taja Beverages, The Kraft Heinz Co. and Unilever PLC

Market Research Insights

  • The market dynamics are increasingly shaped by consumer demand for transparency, where third-party food audit results and clear consumer trust indicators directly influence purchasing decisions. The pursuit of premium food certification is driving growth in the artisanal food production segment, with some brands achieving a 15% price premium over non-certified counterparts.
  • Strategic alignment with other lifestyle diets, highlighting dual-certification benefits, has become a key differentiator, particularly when compared to the halal food comparison. Businesses that successfully integrate robust protocols for food fraud prevention into their supply chains report a 25% higher consumer retention rate.
  • This shift underscores a move from niche compliance to a broad-based strategy centered on verifiable quality and ethical production standards.

We can help! Our analysts can customize this kosher foods market research report to meet your requirements.

Get in touch

1. Executive Summary

1.1 Market overview

Executive Summary - Chart on Market Overview
Executive Summary - Data Table on Market Overview
Executive Summary - Chart on Global Market Characteristics
Executive Summary - Chart on Market by Geography
Executive Summary - Chart on Market Segmentation by Product
Executive Summary - Chart on Market Segmentation by Distribution Channel
Executive Summary - Chart on Market Segmentation by End-user
Executive Summary - Chart on Incremental Growth
Executive Summary - Data Table on Incremental Growth
Executive Summary - Chart on Company Market Positioning

2. Technavio Analysis

2.1 Analysis of price sensitivity, lifecycle, customer purchase basket, adoption rates, and purchase criteria

2.2 Criticality of inputs and Factors of differentiation

Chart on Overview on criticality of inputs and factors of differentiation

2.3 Factors of disruption

Chart on Overview on factors of disruption

2.4 Impact of drivers and challenges

Chart on Impact of drivers and challenges in 2025 and 2030

3. Market Landscape

3.1 Market ecosystem

Chart on Parent Market
Data Table on - Parent Market

3.2 Market characteristics

Chart on Market characteristics analysis

3.3 Value chain analysis

Chart on Value chain analysis

4. Market Sizing

4.1 Market definition

Data Table on Offerings of companies included in the market definition

4.2 Market segment analysis

Market segments

4.3 Market size 2025

4.4 Market outlook: Forecast for 2025-2030

Chart on Global - Market size and forecast 2025-2030 ($ million)
Data Table on Global - Market size and forecast 2025-2030 ($ million)
Chart on Global Market: Year-over-year growth 2025-2030 (%)
Data Table on Global Market: Year-over-year growth 2025-2030 (%)

5. Historic Market Size

5.1 Global Kosher Foods Market 2020 - 2024

Historic Market Size - Data Table on Global Kosher Foods Market 2020 - 2024 ($ million)

5.2 Product segment analysis 2020 - 2024

Historic Market Size - Product Segment 2020 - 2024 ($ million)

5.3 Distribution Channel segment analysis 2020 - 2024

Historic Market Size - Distribution Channel Segment 2020 - 2024 ($ million)

5.4 End-user segment analysis 2020 - 2024

Historic Market Size - End-user Segment 2020 - 2024 ($ million)

5.5 Geography segment analysis 2020 - 2024

Historic Market Size - Geography Segment 2020 - 2024 ($ million)

5.6 Country segment analysis 2020 - 2024

Historic Market Size - Country Segment 2020 - 2024 ($ million)

6. Qualitative Analysis

6.1 Impact of AI on Global Kosher Foods Market

6.2 Impact of Geopolitical Conflict on Global Kosher Foods Market

7. Five Forces Analysis

7.1 Five forces summary

Five forces analysis - Comparison between 2025 and 2030

7.2 Bargaining power of buyers

Bargaining power of buyers - Impact of key factors 2025 and 2030

7.3 Bargaining power of suppliers

Bargaining power of suppliers - Impact of key factors in 2025 and 2030

7.4 Threat of new entrants

Threat of new entrants - Impact of key factors in 2025 and 2030

7.5 Threat of substitutes

Threat of substitutes - Impact of key factors in 2025 and 2030

7.6 Threat of rivalry

Threat of rivalry - Impact of key factors in 2025 and 2030

7.7 Market condition

Chart on Market condition - Five forces 2025 and 2030

8. Market Segmentation by Product

8.1 Market segments

Chart on Product - Market share 2025-2030 (%)
Data Table on Product - Market share 2025-2030 (%)

8.2 Comparison by Product

Chart on Comparison by Product
Data Table on Comparison by Product

8.3 Kosher pareve - Market size and forecast 2025-2030

Chart on Kosher pareve - Market size and forecast 2025-2030 ($ million)
Data Table on Kosher pareve - Market size and forecast 2025-2030 ($ million)
Chart on Kosher pareve - Year-over-year growth 2025-2030 (%)
Data Table on Kosher pareve - Year-over-year growth 2025-2030 (%)

8.4 Kosher meat - Market size and forecast 2025-2030

Chart on Kosher meat - Market size and forecast 2025-2030 ($ million)
Data Table on Kosher meat - Market size and forecast 2025-2030 ($ million)
Chart on Kosher meat - Year-over-year growth 2025-2030 (%)
Data Table on Kosher meat - Year-over-year growth 2025-2030 (%)

8.5 Kosher dairy - Market size and forecast 2025-2030

Chart on Kosher dairy - Market size and forecast 2025-2030 ($ million)
Data Table on Kosher dairy - Market size and forecast 2025-2030 ($ million)
Chart on Kosher dairy - Year-over-year growth 2025-2030 (%)
Data Table on Kosher dairy - Year-over-year growth 2025-2030 (%)

8.6 Market opportunity by Product

Market opportunity by Product ($ million)
Data Table on Market opportunity by Product ($ million)

9. Market Segmentation by Distribution Channel

9.1 Market segments

Chart on Distribution Channel - Market share 2025-2030 (%)
Data Table on Distribution Channel - Market share 2025-2030 (%)

9.2 Comparison by Distribution Channel

Chart on Comparison by Distribution Channel
Data Table on Comparison by Distribution Channel

9.3 Supermarkets and hypermarkets - Market size and forecast 2025-2030

Chart on Supermarkets and hypermarkets - Market size and forecast 2025-2030 ($ million)
Data Table on Supermarkets and hypermarkets - Market size and forecast 2025-2030 ($ million)
Chart on Supermarkets and hypermarkets - Year-over-year growth 2025-2030 (%)
Data Table on Supermarkets and hypermarkets - Year-over-year growth 2025-2030 (%)

9.4 Grocery stores - Market size and forecast 2025-2030

Chart on Grocery stores - Market size and forecast 2025-2030 ($ million)
Data Table on Grocery stores - Market size and forecast 2025-2030 ($ million)
Chart on Grocery stores - Year-over-year growth 2025-2030 (%)
Data Table on Grocery stores - Year-over-year growth 2025-2030 (%)

9.5 Online stores - Market size and forecast 2025-2030

Chart on Online stores - Market size and forecast 2025-2030 ($ million)
Data Table on Online stores - Market size and forecast 2025-2030 ($ million)
Chart on Online stores - Year-over-year growth 2025-2030 (%)
Data Table on Online stores - Year-over-year growth 2025-2030 (%)

9.6 Market opportunity by Distribution Channel

Market opportunity by Distribution Channel ($ million)
Data Table on Market opportunity by Distribution Channel ($ million)

10. Market Segmentation by End-user

10.1 Market segments

Chart on End-user - Market share 2025-2030 (%)
Data Table on End-user - Market share 2025-2030 (%)

10.2 Comparison by End-user

Chart on Comparison by End-user
Data Table on Comparison by End-user

10.3 Household consumers - Market size and forecast 2025-2030

Chart on Household consumers - Market size and forecast 2025-2030 ($ million)
Data Table on Household consumers - Market size and forecast 2025-2030 ($ million)
Chart on Household consumers - Year-over-year growth 2025-2030 (%)
Data Table on Household consumers - Year-over-year growth 2025-2030 (%)

10.4 Food service industry - Market size and forecast 2025-2030

Chart on Food service industry - Market size and forecast 2025-2030 ($ million)
Data Table on Food service industry - Market size and forecast 2025-2030 ($ million)
Chart on Food service industry - Year-over-year growth 2025-2030 (%)
Data Table on Food service industry - Year-over-year growth 2025-2030 (%)

10.5 Food processing industry - Market size and forecast 2025-2030

Chart on Food processing industry - Market size and forecast 2025-2030 ($ million)
Data Table on Food processing industry - Market size and forecast 2025-2030 ($ million)
Chart on Food processing industry - Year-over-year growth 2025-2030 (%)
Data Table on Food processing industry - Year-over-year growth 2025-2030 (%)

10.6 Market opportunity by End-user

Market opportunity by End-user ($ million)
Data Table on Market opportunity by End-user ($ million)

11. Customer Landscape

11.1 Customer landscape overview

Analysis of price sensitivity, lifecycle, customer purchase basket, adoption rates, and purchase criteria

12. Geographic Landscape

12.1 Geographic segmentation

Chart on Market share by geography 2025-2030 (%)
Data Table on Market share by geography 2025-2030 (%)

12.2 Geographic comparison

Chart on Geographic comparison
Data Table on Geographic comparison

12.3 North America - Market size and forecast 2025-2030

Chart on North America - Market size and forecast 2025-2030 ($ million)
Data Table on North America - Market size and forecast 2025-2030 ($ million)
Chart on North America - Year-over-year growth 2025-2030 (%)
Data Table on North America - Year-over-year growth 2025-2030 (%)
Chart on Regional Comparison - North America
Data Table on Regional Comparison - North America

12.3.1 US - Market size and forecast 2025-2030

Chart on US - Market size and forecast 2025-2030 ($ million)
Data Table on US - Market size and forecast 2025-2030 ($ million)
Chart on US - Year-over-year growth 2025-2030 (%)
Data Table on US - Year-over-year growth 2025-2030 (%)

12.3.2 Canada - Market size and forecast 2025-2030

Chart on Canada - Market size and forecast 2025-2030 ($ million)
Data Table on Canada - Market size and forecast 2025-2030 ($ million)
Chart on Canada - Year-over-year growth 2025-2030 (%)
Data Table on Canada - Year-over-year growth 2025-2030 (%)

12.3.3 Mexico - Market size and forecast 2025-2030

Chart on Mexico - Market size and forecast 2025-2030 ($ million)
Data Table on Mexico - Market size and forecast 2025-2030 ($ million)
Chart on Mexico - Year-over-year growth 2025-2030 (%)
Data Table on Mexico - Year-over-year growth 2025-2030 (%)

12.4 Europe - Market size and forecast 2025-2030

Chart on Europe - Market size and forecast 2025-2030 ($ million)
Data Table on Europe - Market size and forecast 2025-2030 ($ million)
Chart on Europe - Year-over-year growth 2025-2030 (%)
Data Table on Europe - Year-over-year growth 2025-2030 (%)
Chart on Regional Comparison - Europe
Data Table on Regional Comparison - Europe

12.4.1 UK - Market size and forecast 2025-2030

Chart on UK - Market size and forecast 2025-2030 ($ million)
Data Table on UK - Market size and forecast 2025-2030 ($ million)
Chart on UK - Year-over-year growth 2025-2030 (%)
Data Table on UK - Year-over-year growth 2025-2030 (%)

12.4.2 Germany - Market size and forecast 2025-2030

Chart on Germany - Market size and forecast 2025-2030 ($ million)
Data Table on Germany - Market size and forecast 2025-2030 ($ million)
Chart on Germany - Year-over-year growth 2025-2030 (%)
Data Table on Germany - Year-over-year growth 2025-2030 (%)

12.4.3 France - Market size and forecast 2025-2030

Chart on France - Market size and forecast 2025-2030 ($ million)
Data Table on France - Market size and forecast 2025-2030 ($ million)
Chart on France - Year-over-year growth 2025-2030 (%)
Data Table on France - Year-over-year growth 2025-2030 (%)

12.4.4 Italy - Market size and forecast 2025-2030

Chart on Italy - Market size and forecast 2025-2030 ($ million)
Data Table on Italy - Market size and forecast 2025-2030 ($ million)
Chart on Italy - Year-over-year growth 2025-2030 (%)
Data Table on Italy - Year-over-year growth 2025-2030 (%)

12.4.5 Spain - Market size and forecast 2025-2030

Chart on Spain - Market size and forecast 2025-2030 ($ million)
Data Table on Spain - Market size and forecast 2025-2030 ($ million)
Chart on Spain - Year-over-year growth 2025-2030 (%)
Data Table on Spain - Year-over-year growth 2025-2030 (%)

12.4.6 The Netherlands - Market size and forecast 2025-2030

Chart on The Netherlands - Market size and forecast 2025-2030 ($ million)
Data Table on The Netherlands - Market size and forecast 2025-2030 ($ million)
Chart on The Netherlands - Year-over-year growth 2025-2030 (%)
Data Table on The Netherlands - Year-over-year growth 2025-2030 (%)

12.5 Middle East and Africa - Market size and forecast 2025-2030

Chart on Middle East and Africa - Market size and forecast 2025-2030 ($ million)
Data Table on Middle East and Africa - Market size and forecast 2025-2030 ($ million)
Chart on Middle East and Africa - Year-over-year growth 2025-2030 (%)
Data Table on Middle East and Africa - Year-over-year growth 2025-2030 (%)
Chart on Regional Comparison - Middle East and Africa
Data Table on Regional Comparison - Middle East and Africa

12.5.1 Israel - Market size and forecast 2025-2030

Chart on Israel - Market size and forecast 2025-2030 ($ million)
Data Table on Israel - Market size and forecast 2025-2030 ($ million)
Chart on Israel - Year-over-year growth 2025-2030 (%)
Data Table on Israel - Year-over-year growth 2025-2030 (%)

12.5.2 South Africa - Market size and forecast 2025-2030

Chart on South Africa - Market size and forecast 2025-2030 ($ million)
Data Table on South Africa - Market size and forecast 2025-2030 ($ million)
Chart on South Africa - Year-over-year growth 2025-2030 (%)
Data Table on South Africa - Year-over-year growth 2025-2030 (%)

12.5.3 UAE - Market size and forecast 2025-2030

Chart on UAE - Market size and forecast 2025-2030 ($ million)
Data Table on UAE - Market size and forecast 2025-2030 ($ million)
Chart on UAE - Year-over-year growth 2025-2030 (%)
Data Table on UAE - Year-over-year growth 2025-2030 (%)

12.5.4 Turkey - Market size and forecast 2025-2030

Chart on Turkey - Market size and forecast 2025-2030 ($ million)
Data Table on Turkey - Market size and forecast 2025-2030 ($ million)
Chart on Turkey - Year-over-year growth 2025-2030 (%)
Data Table on Turkey - Year-over-year growth 2025-2030 (%)

12.5.5 Saudi Arabia - Market size and forecast 2025-2030

Chart on Saudi Arabia - Market size and forecast 2025-2030 ($ million)
Data Table on Saudi Arabia - Market size and forecast 2025-2030 ($ million)
Chart on Saudi Arabia - Year-over-year growth 2025-2030 (%)
Data Table on Saudi Arabia - Year-over-year growth 2025-2030 (%)

12.6 South America - Market size and forecast 2025-2030

Chart on South America - Market size and forecast 2025-2030 ($ million)
Data Table on South America - Market size and forecast 2025-2030 ($ million)
Chart on South America - Year-over-year growth 2025-2030 (%)
Data Table on South America - Year-over-year growth 2025-2030 (%)
Chart on Regional Comparison - South America
Data Table on Regional Comparison - South America

12.6.1 Brazil - Market size and forecast 2025-2030

Chart on Brazil - Market size and forecast 2025-2030 ($ million)
Data Table on Brazil - Market size and forecast 2025-2030 ($ million)
Chart on Brazil - Year-over-year growth 2025-2030 (%)
Data Table on Brazil - Year-over-year growth 2025-2030 (%)

12.6.2 Argentina - Market size and forecast 2025-2030

Chart on Argentina - Market size and forecast 2025-2030 ($ million)
Data Table on Argentina - Market size and forecast 2025-2030 ($ million)
Chart on Argentina - Year-over-year growth 2025-2030 (%)
Data Table on Argentina - Year-over-year growth 2025-2030 (%)

12.6.3 Chile - Market size and forecast 2025-2030

Chart on Chile - Market size and forecast 2025-2030 ($ million)
Data Table on Chile - Market size and forecast 2025-2030 ($ million)
Chart on Chile - Year-over-year growth 2025-2030 (%)
Data Table on Chile - Year-over-year growth 2025-2030 (%)

12.7 APAC - Market size and forecast 2025-2030

Chart on APAC - Market size and forecast 2025-2030 ($ million)
Data Table on APAC - Market size and forecast 2025-2030 ($ million)
Chart on APAC - Year-over-year growth 2025-2030 (%)
Data Table on APAC - Year-over-year growth 2025-2030 (%)
Chart on Regional Comparison - APAC
Data Table on Regional Comparison - APAC

12.7.1 Australia - Market size and forecast 2025-2030

Chart on Australia - Market size and forecast 2025-2030 ($ million)
Data Table on Australia - Market size and forecast 2025-2030 ($ million)
Chart on Australia - Year-over-year growth 2025-2030 (%)
Data Table on Australia - Year-over-year growth 2025-2030 (%)

12.7.2 Japan - Market size and forecast 2025-2030

Chart on Japan - Market size and forecast 2025-2030 ($ million)
Data Table on Japan - Market size and forecast 2025-2030 ($ million)
Chart on Japan - Year-over-year growth 2025-2030 (%)
Data Table on Japan - Year-over-year growth 2025-2030 (%)

12.7.3 India - Market size and forecast 2025-2030

Chart on India - Market size and forecast 2025-2030 ($ million)
Data Table on India - Market size and forecast 2025-2030 ($ million)
Chart on India - Year-over-year growth 2025-2030 (%)
Data Table on India - Year-over-year growth 2025-2030 (%)

12.7.4 China - Market size and forecast 2025-2030

Chart on China - Market size and forecast 2025-2030 ($ million)
Data Table on China - Market size and forecast 2025-2030 ($ million)
Chart on China - Year-over-year growth 2025-2030 (%)
Data Table on China - Year-over-year growth 2025-2030 (%)

12.7.5 Singapore - Market size and forecast 2025-2030

Chart on Singapore - Market size and forecast 2025-2030 ($ million)
Data Table on Singapore - Market size and forecast 2025-2030 ($ million)
Chart on Singapore - Year-over-year growth 2025-2030 (%)
Data Table on Singapore - Year-over-year growth 2025-2030 (%)

12.7.6 South Korea - Market size and forecast 2025-2030

Chart on South Korea - Market size and forecast 2025-2030 ($ million)
Data Table on South Korea - Market size and forecast 2025-2030 ($ million)
Chart on South Korea - Year-over-year growth 2025-2030 (%)
Data Table on South Korea - Year-over-year growth 2025-2030 (%)

12.8 Market opportunity by geography

Market opportunity by geography ($ million)
Data Tables on Market opportunity by geography ($ million)

13. Drivers, Challenges, and Opportunity

13.1 Market drivers

Expanding health consciousness and quality assurance
Growth of veganism and dietary inclusivity
Technological innovation and digital traceability in global food systems

13.2 Market challenges

Escalating production costs and supply chain vulnerabilities
Limited mainstream consumer awareness and education
Intensifying competition from other ethical and lifestyle certifications

13.3 Impact of drivers and challenges

Impact of drivers and challenges in 2025 and 2030

13.4 Market opportunities

Surge of premiumization and artisanal offerings in kosher sector
Convergence of plant-based diets and kosher pareve certification
Integration of advanced traceability and food safety standards

14. Competitive Landscape

14.1 Overview

14.2

Overview on criticality of inputs and factors of differentiation

14.3 Landscape disruption

Overview on factors of disruption

14.4 Industry risks

Impact of key risks on business

15. Competitive Analysis

15.1 Companies profiled

Companies covered

15.2 Company ranking index

15.3 Market positioning of companies

Matrix on companies position and classification

15.4 AGRANA Beteiligungs AG

AGRANA Beteiligungs AG - Overview
AGRANA Beteiligungs AG - Business segments
AGRANA Beteiligungs AG - Key offerings
AGRANA Beteiligungs AG - Segment focus
SWOT

15.5 Archer Daniels Midland Co.

Archer Daniels Midland Co. - Overview
Archer Daniels Midland Co. - Business segments
Archer Daniels Midland Co. - Key news
Archer Daniels Midland Co. - Key offerings
Archer Daniels Midland Co. - Segment focus
SWOT

15.6 Aron Streit Inc.

Aron Streit Inc. - Overview
Aron Streit Inc. - Product / Service
Aron Streit Inc. - Key offerings
SWOT

15.7 BASF SE

BASF SE - Overview
BASF SE - Business segments
BASF SE - Key news
BASF SE - Key offerings
BASF SE - Segment focus
SWOT

15.8 Cargill Inc.

Cargill Inc. - Overview
Cargill Inc. - Product / Service
Cargill Inc. - Key news
Cargill Inc. - Key offerings
SWOT

15.9 Conagra Brands Inc.

Conagra Brands Inc. - Overview
Conagra Brands Inc. - Business segments
Conagra Brands Inc. - Key offerings
Conagra Brands Inc. - Segment focus
SWOT

15.10 Dairy Farmers of America Inc.

Dairy Farmers of America Inc. - Overview
Dairy Farmers of America Inc. - Product / Service
Dairy Farmers of America Inc. - Key offerings
SWOT

15.11 Empire Kosher Poultry LLC

Empire Kosher Poultry LLC - Overview
Empire Kosher Poultry LLC - Product / Service
Empire Kosher Poultry LLC - Key offerings
SWOT

15.12 General Mills Inc.

General Mills Inc. - Overview
General Mills Inc. - Business segments
General Mills Inc. - Key offerings
General Mills Inc. - Segment focus
SWOT

15.13 Kayco Co.

Kayco Co. - Overview
Kayco Co. - Product / Service
Kayco Co. - Key offerings
SWOT

15.14 Kellanova

Kellanova - Overview
Kellanova - Business segments
Kellanova - Key offerings
Kellanova - Segment focus
SWOT

15.15 Nestle SA

Nestle SA - Overview
Nestle SA - Business segments
Nestle SA - Key news
Nestle SA - Key offerings
Nestle SA - Segment focus
SWOT

15.16 PepsiCo Inc.

PepsiCo Inc. - Overview
PepsiCo Inc. - Business segments
PepsiCo Inc. - Key news
PepsiCo Inc. - Key offerings
PepsiCo Inc. - Segment focus
SWOT

15.17 The Kraft Heinz Co.

The Kraft Heinz Co. - Overview
The Kraft Heinz Co. - Business segments
The Kraft Heinz Co. - Key news
The Kraft Heinz Co. - Key offerings
The Kraft Heinz Co. - Segment focus
SWOT

15.18 Unilever PLC

Unilever PLC - Overview
Unilever PLC - Business segments
Unilever PLC - Key news
Unilever PLC - Key offerings
Unilever PLC - Segment focus
SWOT

16. Appendix

16.1 Scope of the report

Market definition
Objectives
Notes and caveats

16.2 Inclusions and exclusions checklist

Inclusions checklist
Exclusions checklist

16.3 Currency conversion rates for US$

16.4 Research methodology

16.5 Data procurement

Information sources

16.6 Data validation

16.7 Validation techniques employed for market sizing

16.8 Data synthesis

16.9 360 degree market analysis

16.10 List of abbreviations

Research Methodology

Technavio presents a detailed picture of the market by way of study, synthesis, and summation of data from multiple sources. The analysts have presented the various facets of the market with a particular focus on identifying the key industry influencers. The data thus presented is comprehensive, reliable, and the result of extensive research, both primary and secondary.

INFORMATION SOURCES

Primary sources

  • Manufacturers and suppliers
  • Channel partners
  • Industry experts
  • Strategic decision makers

Secondary sources

  • Industry journals and periodicals
  • Government data
  • Financial reports of key industry players
  • Historical data
  • Press releases

DATA ANALYSIS

Data Synthesis

  • Collation of data
  • Estimation of key figures
  • Analysis of derived insights

Data Validation

  • Triangulation with data models
  • Reference against proprietary databases
  • Corroboration with industry experts

REPORT WRITING

Qualitative

  • Market drivers
  • Market challenges
  • Market trends
  • Five forces analysis

Quantitative

  • Market size and forecast
  • Market segmentation
  • Geographical insights
  • Competitive landscape

Interested in this report?

Get your sample now to see our research methodology and insights!

Download Now

Frequently Asked Questions

Kosher Foods market growth will increase by USD 17539.3 million during 2026-2030.

The Kosher Foods market is expected to grow at a CAGR of 7.2% during 2026-2030.

Kosher Foods market is segmented by Product (Kosher pareve, Kosher meat, Kosher dairy) Distribution channel (Supermarkets and hypermarkets, Grocery stores, Online stores) End-user (Household consumers, Food service industry, Food processing industry)

AGRANA Beteiligungs AG, Archer Daniels Midland Co., Aron Streit Inc., BASF SE, Bobs Red Mill Natural Foods, Cargill Inc., Conagra Brands Inc., Dairy Farmers of America Inc., Eden Foods Inc., Empire Kosher Poultry LLC, General Mills Inc., Kayco Co., Kellanova, Nestle SA, PepsiCo Inc., Taja Beverages, The Kraft Heinz Co., Unilever PLC are a few of the key vendors in the Kosher Foods market.

North America will register the highest growth rate of 51.9% among the other regions. Therefore, the Kosher Foods market in North America is expected to garner significant business opportunities for the vendors during the forecast period.

US, Canada, Mexico, UK, Germany, France, Italy, Spain, The Netherlands, Israel, South Africa, UAE, Turkey, Saudi Arabia, Brazil, Argentina, Chile, Australia, Japan, India, China, Singapore, South Korea

  • Expanding health consciousness and quality assurance is the driving factor this market.

The Kosher Foods market vendors should focus on grabbing business opportunities from the Product segment as it accounted for the largest market share in the base year.
RIA - Research AI Assistant
Ask RIA