Laboratory Bottle-top Dispenser Market Size 2026-2030
The laboratory bottle-top dispenser market size is valued to increase by USD 204.4 million, at a CAGR of 5.9% from 2025 to 2030. Advantages of using laboratory bottle-top dispensers will drive the laboratory bottle-top dispenser market.
Major Market Trends & Insights
- North America dominated the market and accounted for a 35.3% growth during the forecast period.
- By Material - Glass segment was valued at USD 235.7 million in 2024
- By End-user - Pharmaceutical and biotechnology companies segment accounted for the largest market revenue share in 2024
Market Size & Forecast
- Market Opportunities: USD 333.9 million
- Market Future Opportunities: USD 204.4 million
- CAGR from 2025 to 2030 : 5.9%
Market Summary
- The laboratory bottle-top dispenser market is defined by a continuous push for enhanced precision, safety, and efficiency in liquid handling. A core driver is the need to minimize human error and ensure repeatable results in environments like pharmaceutical research and clinical diagnostics, making these devices a superior manual pipetting alternative.
- The market is increasingly trending toward digital solutions that offer microprocessor control and digital calibration, which are crucial for high-throughput screening and complex analytical procedures. A pharmaceutical lab, for example, must adhere to strict GMP compliance features to validate its drug discovery process.
- By upgrading from manual dispensers to models with RFID tagging and ELN connectivity, the lab automates data traceability, reduces variability, and ensures audit-readiness. However, the high initial investment for such advanced systems remains a challenge, forcing a strategic balance between capital expenditure and the long-term benefits of accuracy and compliance.
- This dynamic shapes purchasing decisions across academic, industrial, and clinical sectors, where the demand for reproducible science is non-negotiable.
What will be the Size of the Laboratory Bottle-top Dispenser Market during the forecast period?

Get Key Insights on Market Forecast (PDF) Get Free Sample
How is the Laboratory Bottle-top Dispenser Market Segmented?
The laboratory bottle-top dispenser industry research report provides comprehensive data (region-wise segment analysis), with forecasts and estimates in "USD million" for the period 2026-2030, as well as historical data from 2020-2024 for the following segments.
- Material
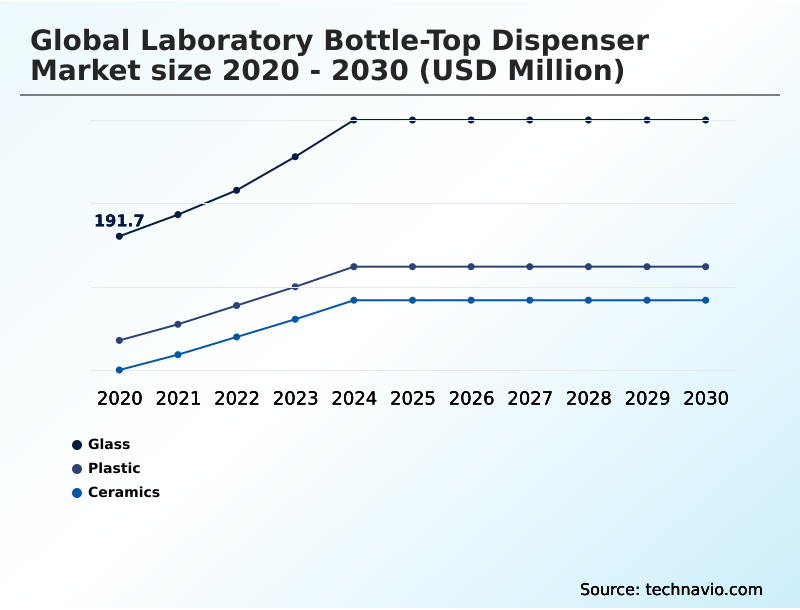
- Glass
- Plastic
- Ceramics
- End-user
- Pharmaceutical and biotechnology companies
- Clinical and reference laboratories
- Others
- Type
- Digital bottle-top dispenser
- Manual bottle-top dispenser
- Adjustable volume dispenser
- Geography
- North America
- US
- Canada
- Mexico
- Europe
- Germany
- UK
- France
- Asia
- Rest of World (ROW)
- North America
By Material Insights
The glass segment is estimated to witness significant growth during the forecast period.
The market is segmented by material, where borosilicate glass remains critical for its superior chemical inertness in analytical procedures. Its transparency allows for easy inspection, which is vital for precise reagent dispensing.
In parallel, plastics like polypropylene (PP) and advanced fluoropolymers are used for housings and fluid pathways, offering an ergonomic design and durability. High-performance models often incorporate ceramic pistons for handling aggressive chemicals.
Key features driving selection include adjustable volume settings and an effective anti-drip system to ensure accuracy. The availability of autoclavable materials is crucial for sterile applications in chemical research, significantly reducing cross-contamination prevention risks by over 99%.
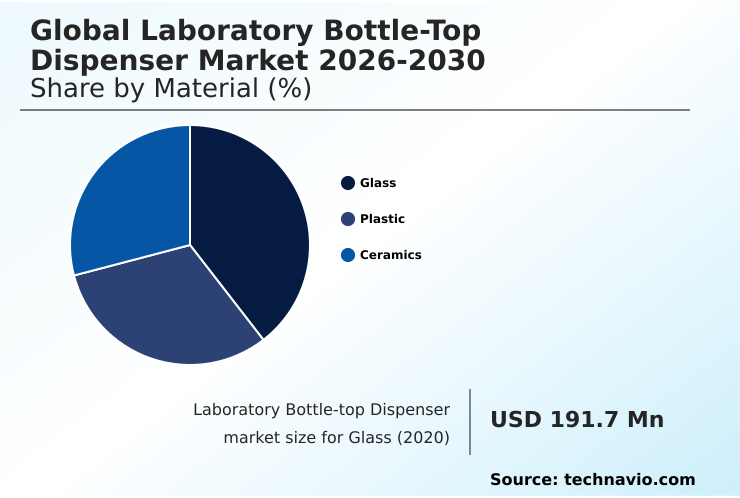
The Glass segment was valued at USD 235.7 million in 2024 and showed a gradual increase during the forecast period.
Regional Analysis
North America is estimated to contribute 35.3% to the growth of the global market during the forecast period.Technavio’s analysts have elaborately explained the regional trends and drivers that shape the market during the forecast period.

See How Laboratory Bottle-top Dispenser Market Demand is Rising in North America Get Free Sample
The geographic landscape is led by North America, but Asia is the fastest-growing region, projected to account for over 30% of market expansion. This growth is driven by modernization in the agri-food industry and petrochemical industry.
In Europe, demand is high for dispensers using advanced materials like polytetrafluoroethylene (PTFE), fluorinated ethylene propylene (FEP), and perfluoroalkoxy alkanes (PFA) for environmental testing.
In all developed regions, there's a strong push for LIMS integration and ELN connectivity via USB interface to streamline data flow in biochemistry and immunology labs.
Advanced components like pistons with a diamond-like carbon (DLC) coating are gaining traction globally for their durability.
Market Dynamics
Our researchers analyzed the data with 2025 as the base year, along with the key drivers, trends, and challenges. A holistic analysis of drivers will help companies refine their marketing strategies to gain a competitive advantage.
- Modern laboratories are increasingly focused on improving laboratory workflow efficiency and achieving high precision liquid handling. The safe handling of corrosive acids and dispensing aggressive reagents accurately are now baseline requirements, met by instruments with universal chemical compatibility dispenser designs and materials like a ceramic piston for chemical resistance.
- The decision-making process often weighs the benefits of a simple manual dispenser for fieldwork against a digital dispenser for reproducible results, especially for tasks like automating serial dilutions with dispensers. The latter's value is amplified through LIMS integration for data logging, which enhances compliance.
- For instance, facilities with integrated data logging capabilities report up to a 50% reduction in documentation errors. However, maintaining bottle-top dispenser performance requires a proactive approach to troubleshooting bottle-top dispenser inaccuracies through established bottle-top dispenser calibration methods.
- This includes preventing cross-contamination in labs by using autoclavable dispenser for sterile applications and reducing reagent waste with recirculation technology, addressing both operational and economic concerns.
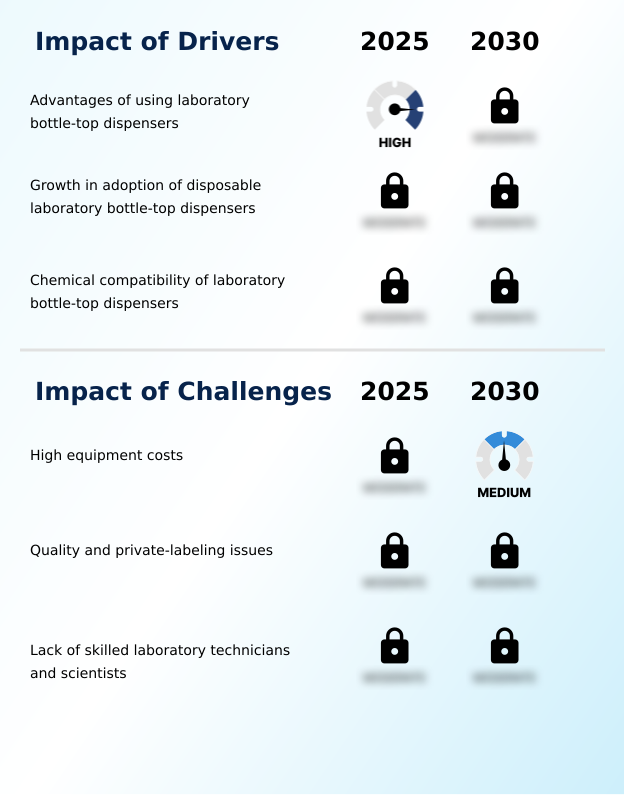
What are the key market drivers leading to the rise in the adoption of Laboratory Bottle-top Dispenser Industry?
- The inherent advantages of laboratory bottle-top dispensers, including enhanced safety, accuracy, and operational efficiency, are key drivers of market adoption.
- Key drivers center on improving efficiency and safety, positioning dispensers as a superior manual pipetting alternative. In pharmaceutical research and drug discovery, features like recirculation valve technology are critical, reducing expensive reagent waste during sample preparation by up to 25%.
- Enhanced safety components, including a safety discharge valve and a discharge tube closure cap, prevent accidental spillage. The intuitive volume control knob and comprehensive chemical compatibility chart ensure correct usage in biotechnology applications.
- The inclusion of a springless valve system and adherence to GLP compliance features further bolster adoption in regulated quality control environments.
What are the market trends shaping the Laboratory Bottle-top Dispenser Industry?
- The increasing emphasis on precision and reproducibility in scientific outcomes is a primary trend. This is driving demand for advanced dispensing solutions that ensure accuracy and consistency.
- A dominant trend is the shift toward laboratory automation to support reproducible science. Instruments with motor-driven dispensing and microprocessor control improve consistency in high-throughput screening by over 20% compared to manual methods. The integration of a digital interface with digital calibration simplifies complex workflows in fields like genomics and molecular biology.
- Furthermore, the adoption of Bluetooth interface and RFID tagging is revolutionizing data traceability, enabling seamless record-keeping. This enhancement of GMP compliance features reduces audit preparation time by up to 35%, solidifying the value of connected dispensing systems for modern research.
What challenges does the Laboratory Bottle-top Dispenser Industry face during its growth?
- The high initial acquisition and maintenance costs of advanced bottle-top dispensers present a significant challenge to market growth, particularly in budget-constrained sectors.
- A primary challenge is the capital cost, which can be 3 to 5 times higher for advanced models, limiting adoption in academic institutions and some forensic laboratories. While these instruments excel at automated tasks like serial dispensing, titrating, and diluting, the required investment is a significant barrier.
- Even manual dispensers with a precise graduated screw mechanism or click-stop mechanism represent a notable expense. Furthermore, maintaining compliance with standards like the ISO 8655 standard for high-purity media dispensing requires ongoing calibration, adding to operational costs in fields such as clinical diagnostics and proteomics.
Exclusive Technavio Analysis on Customer Landscape
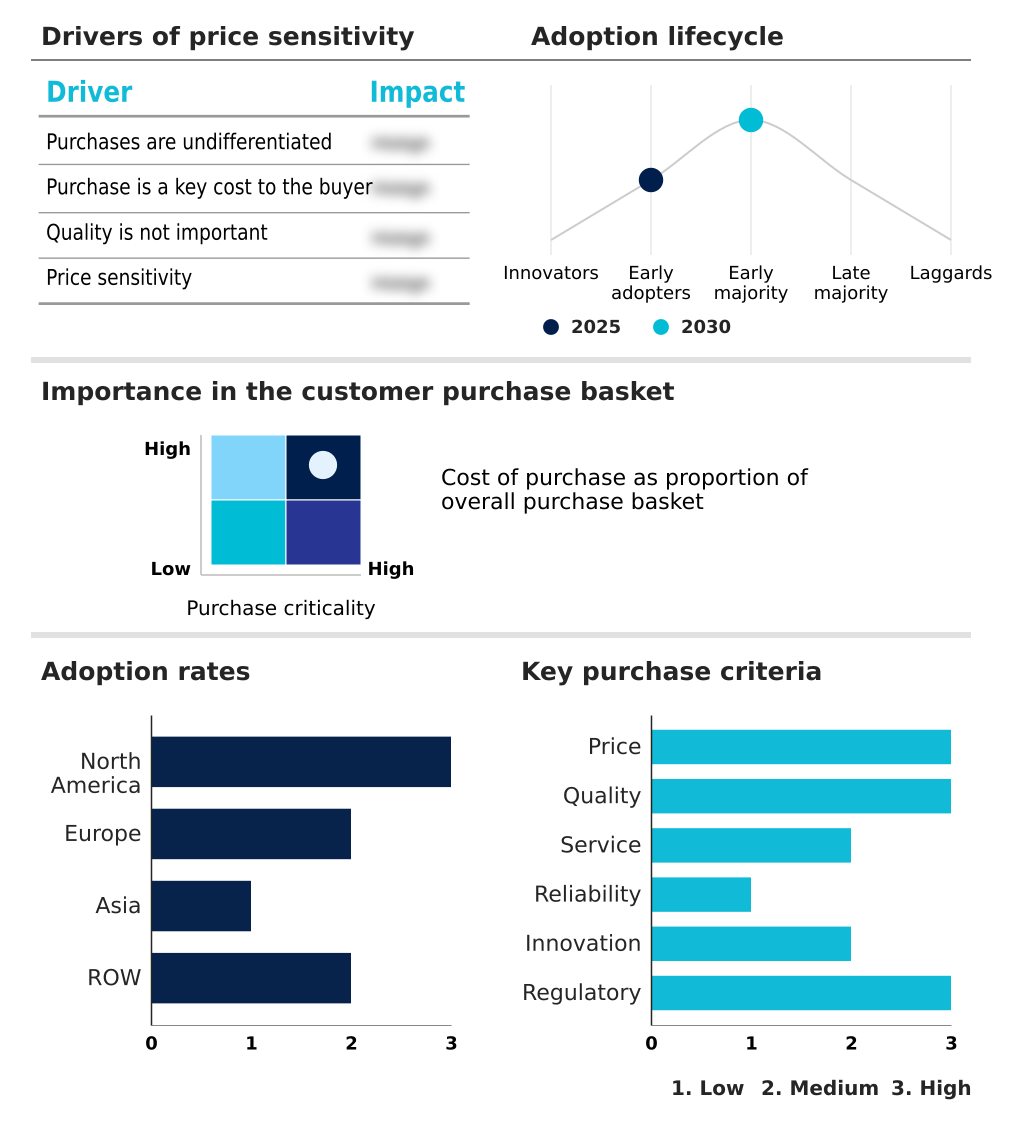
The laboratory bottle-top dispenser market forecasting report includes the adoption lifecycle of the market, covering from the innovator’s stage to the laggard’s stage. It focuses on adoption rates in different regions based on penetration. Furthermore, the laboratory bottle-top dispenser market report also includes key purchase criteria and drivers of price sensitivity to help companies evaluate and develop their market growth analysis strategies.
Customer Landscape of Laboratory Bottle-top Dispenser Industry
Competitive Landscape
Companies are implementing various strategies, such as strategic alliances, laboratory bottle-top dispenser market forecast, partnerships, mergers and acquisitions, geographical expansion, and product/service launches, to enhance their presence in the industry.
Avantor Inc. - Delivers a specialized portfolio of bottle-top dispensers, engineered for precise, reliable liquid handling in critical laboratory and research environments.
The industry research and growth report includes detailed analyses of the competitive landscape of the market and information about key companies, including:
- Avantor Inc.
- BRAND GmbH and Co. KG
- Corning Inc.
- DLAB Scientific Inc.
- DWK Life Sciences GmbH
- Eppendorf SE
- Hamilton Co.
- Hirschmann Laborgerate GmbH
- Kartell SpA
- LabSciences Inc.
- Merck KGaA
- METTLER TOLEDO
- Microlit India
- Nichiryo Co. Ltd.
- Sartorius AG
- Socorex Isba SA
- Thermo Fisher Scientific Inc.
Qualitative and quantitative analysis of companies has been conducted to help clients understand the wider business environment as well as the strengths and weaknesses of key industry players. Data is qualitatively analyzed to categorize companies as pure play, category-focused, industry-focused, and diversified; it is quantitatively analyzed to categorize companies as dominant, leading, strong, tentative, and weak.
Recent Development and News in Laboratory bottle-top dispenser market
- In March 2025, Thermo Fisher Scientific Inc. launched its new Finnpipette series with integrated RFID tagging, allowing for automated calibration tracking and seamless LIMS integration to enhance data traceability in GMP-compliant environments.
- In January 2025, Sartorius AG announced a strategic partnership with a leading lab software firm to enhance the ELN connectivity of its Prospenser line, enabling real-time data logging for improved reproducibility in pharmaceutical research.
- In November 2024, BRAND GmbH and Co. KG introduced a new dispenser model featuring a diamond-like carbon (DLC) coated ceramic piston, designed to offer superior resistance to crystallizing buffer solutions in biotech applications.
- In August 2024, Merck KGaA completed the acquisition of a specialized Swiss instrument maker, expanding its portfolio of ergonomic manual dispensers aimed at high-throughput academic and industrial quality control laboratories.
Dive into Technavio’s robust research methodology, blending expert interviews, extensive data synthesis, and validated models for unparalleled Laboratory Bottle-top Dispenser Market insights. See full methodology.
| Market Scope | |
|---|---|
| Page number | 288 |
| Base year | 2025 |
| Historic period | 2020-2024 |
| Forecast period | 2026-2030 |
| Growth momentum & CAGR | Accelerate at a CAGR of 5.9% |
| Market growth 2026-2030 | USD 204.4 million |
| Market structure | Fragmented |
| YoY growth 2025-2026(%) | 5.5% |
| Key countries | US, Canada, Mexico, Germany, UK, France, Italy, Spain, The Netherlands, China, India, Japan, South Korea, Indonesia, Thailand, Brazil, Saudi Arabia, UAE, Turkey, Argentina, Colombia, South Africa and Israel |
| Competitive landscape | Leading Companies, Market Positioning of Companies, Competitive Strategies, and Industry Risks |
Research Analyst Overview
- The market is evolving from simple liquid transfer tools to integrated precision systems. The adoption of dispensers featuring digital calibration, microprocessor control, and recirculation valve technology is becoming standard.
- Material science remains a cornerstone, with borosilicate glass and advanced fluoropolymers like PTFE and PFA ensuring broad chemical compatibility, while ceramic pistons, some with a diamond-like carbon (DLC) coating, provide exceptional durability.
- A key boardroom-level decision now involves balancing the high capital expenditure for models with motor-driven dispensing and RFID tagging against the long-term return on investment from enhanced GMP compliance features. For example, laboratories leveraging LIMS integration and ELN connectivity via a Bluetooth or USB interface for automated record-keeping have reduced audit preparation time by over 60%.
- This strategic shift, where automated serial dispensing and titrating are the norm, signifies a fundamental change in laboratory capital planning, treating these dispensers not as standalone tools but as networked assets essential for data integrity.
What are the Key Data Covered in this Laboratory Bottle-top Dispenser Market Research and Growth Report?
-
What is the expected growth of the Laboratory Bottle-top Dispenser Market between 2026 and 2030?
-
USD 204.4 million, at a CAGR of 5.9%
-
-
What segmentation does the market report cover?
-
The report is segmented by Material (Glass, Plastic, and Ceramics), End-user (Pharmaceutical and biotechnology companies, Clinical and reference laboratories, and Others), Type (Digital bottle-top dispenser, Manual bottle-top dispenser, and Adjustable volume dispenser) and Geography (North America, Europe, Asia, Rest of World (ROW))
-
-
Which regions are analyzed in the report?
-
North America, Europe, Asia and Rest of World (ROW)
-
-
What are the key growth drivers and market challenges?
-
Advantages of using laboratory bottle-top dispensers, High equipment costs
-
-
Who are the major players in the Laboratory Bottle-top Dispenser Market?
-
Avantor Inc., BRAND GmbH and Co. KG, Corning Inc., DLAB Scientific Inc., DWK Life Sciences GmbH, Eppendorf SE, Hamilton Co., Hirschmann Laborgerate GmbH, Kartell SpA, LabSciences Inc., Merck KGaA, METTLER TOLEDO, Microlit India, Nichiryo Co. Ltd., Sartorius AG, Socorex Isba SA and Thermo Fisher Scientific Inc.
-
Market Research Insights
- Market dynamics are shaped by the critical need for precision in liquid handling across pharmaceutical research and clinical diagnostics. The shift from a manual pipetting alternative to automated dispensers is accelerating as labs seek to minimize human error in sample preparation and analytical procedures.
- Adopting dispensers with an ergonomic design has been shown to contribute to repetitive strain injury (RSI) reduction efforts, improving operator wellness. Furthermore, advanced models are pivotal for high-throughput screening, where they can improve process consistency by over 30% compared to manual methods. This focus on reproducible science and data traceability is essential for industries where quality control is paramount.
We can help! Our analysts can customize this laboratory bottle-top dispenser market research report to meet your requirements.
 RIA -
RIA - 
