Laboratory Filtration Market Analysis, Size, and Forecast 2025-2029: North America (US, Canada, and Mexico), Europe (France, Germany, Italy, and UK), APAC (China, India, and Japan), and Rest of World (ROW)

Laboratory Filtration Market Analysis, Size, and Forecast 2025-2029:
North America (US, Canada, and Mexico), Europe (France, Germany, Italy, and UK), APAC (China, India, and Japan), and Rest of World (ROW)

Published: Aug 2025 220 Pages SKU: IRTNTR76715

Market Overview at a Glance

$2.54 B
Market Opportunity
8.9%
CAGR
8.0
YoY growth 2024-2025(%)

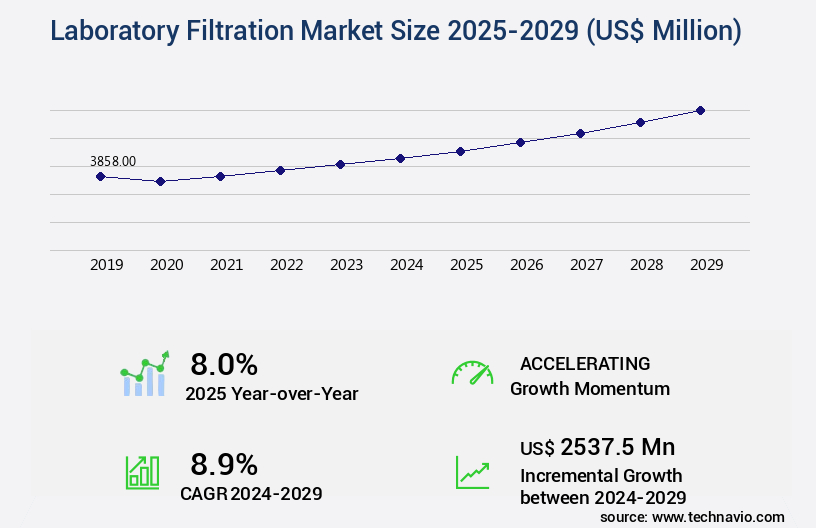
Laboratory Filtration Market Size 2025-2029

The laboratory filtration market size is valued to increase by USD 2.54 billion, at a CAGR of 8.9% from 2024 to 2029. Increasing demand for research and development due to high government healthcare expenditure will drive the laboratory filtration market.

Market Insights

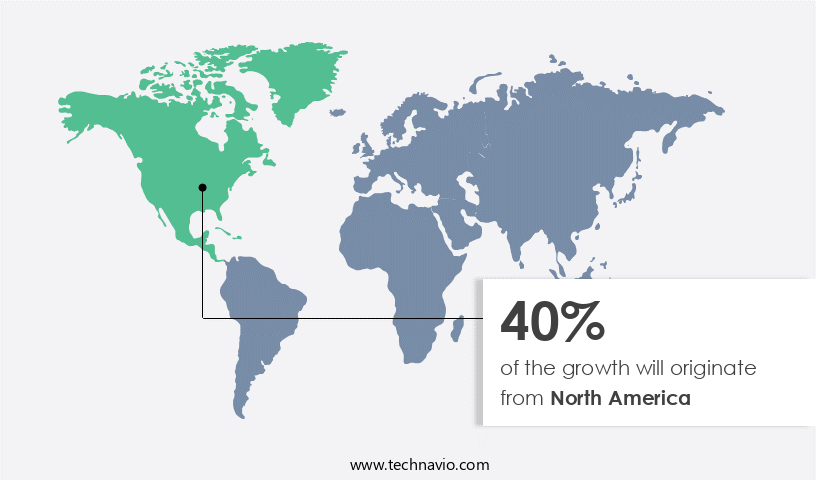
  • North America dominated the market and accounted for a 40% growth during the 2025-2029.
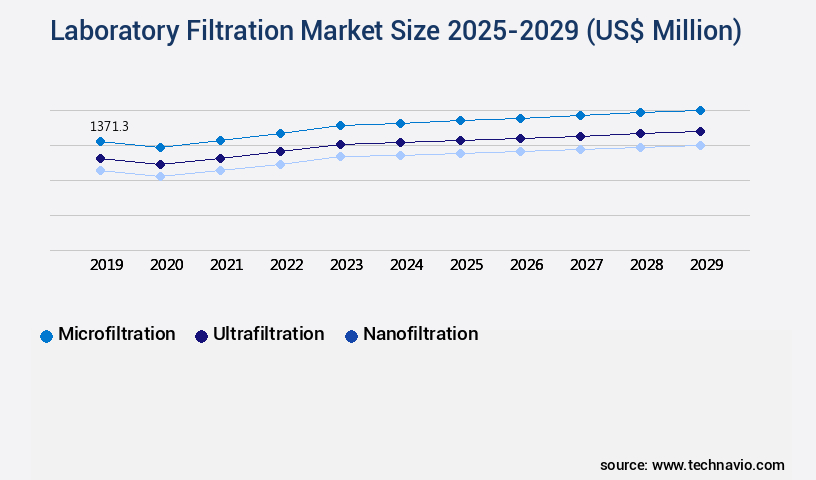
  • By Technique - Microfiltration segment was valued at USD 1.37 billion in 2023
  • By End-user - Pharmaceutical and biotechnology companies segment accounted for the largest market revenue share in 2023

Market Size & Forecast

  • Market Opportunities: USD 89.98 million 
  • Market Future Opportunities 2024: USD 2537.50 million
  • CAGR from 2024 to 2029 : 8.9%

Market Summary

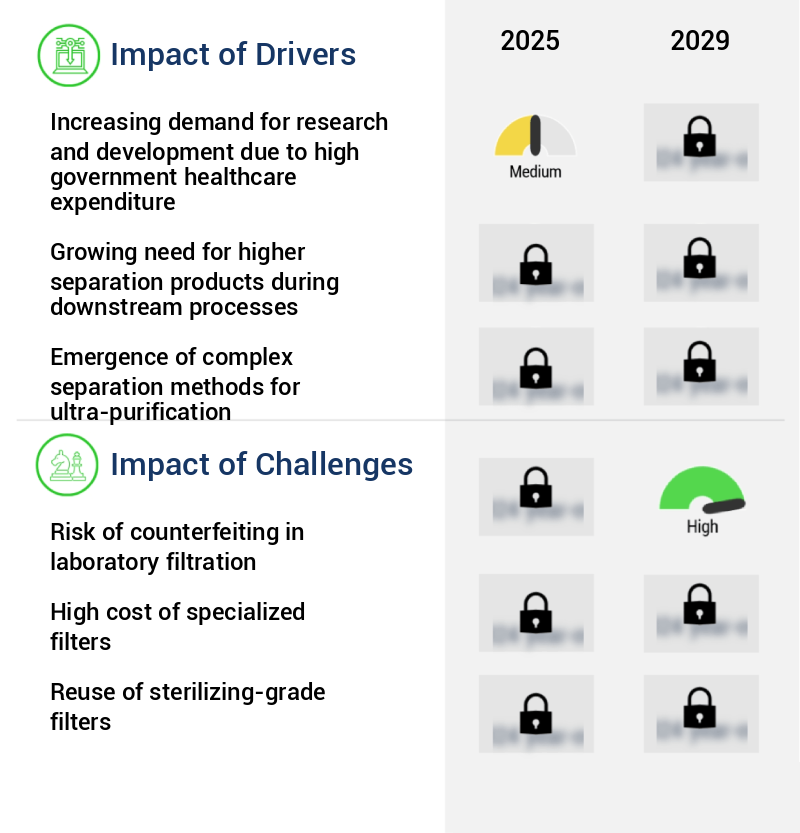
  • The market witnesses significant growth driven by the increasing demand for research and development in various industries, particularly in healthcare and pharmaceuticals, due to escalating government healthcare expenditure. This sector's expansion is further fueled by the rising number of US Food and Drug Administration (FDA)-approved manufacturing facilities worldwide. However, the market faces challenges such as the risk of counterfeiting in laboratory filtration systems, which can compromise the quality and integrity of research data. One real-world business scenario where laboratory filtration plays a pivotal role is in supply chain optimization. Pharmaceutical companies rely on efficient and reliable filtration systems to ensure the purity and consistency of their products during manufacturing. Single-use sensors play a crucial role in process development, enabling real-time monitoring and optimization of biologics manufacturing and cell therapy processes.
  • By implementing advanced filtration technologies, these companies can streamline their production processes, reduce waste, and improve operational efficiency. This, in turn, leads to cost savings and increased competitiveness in the market. Despite these opportunities, market participants must address the challenge of counterfeit filtration systems. The proliferation of counterfeit products can lead to subpar performance, compromised data, and potential safety risks. To mitigate this issue, industry leaders are investing in advanced technologies such as blockchain and RFID tracking to ensure the authenticity and traceability of their filtration systems. This not only enhances their reputation and customer trust but also enables them to meet regulatory requirements and maintain the highest standards of quality.

What will be the size of the Laboratory Filtration Market during the forecast period?

Laboratory Filtration Market Size

Get Key Insights on Market Forecast (PDF) Request Free Sample

  • The market continues to evolve, driven by the increasing demand for improved operational efficiency, regulatory compliance, and waste minimization in various industries. According to recent research, the market for laboratory filtration is projected to grow by over 10% annually, with membrane filtration systems holding a significant market share. This growth can be attributed to the rising adoption of automation systems and membrane filtration technologies, which enhance process control, reduce membrane fouling, and improve system design. Regulatory compliance is a critical decision area for laboratories, and filtration systems play a crucial role in ensuring standard operating procedures and maintaining technical specifications.
  • Performance monitoring and filter validation are essential for maintaining process scalability and ensuring data acquisition for quality assurance. Moreover, filter life extension and cleaning validation are essential for maintaining safety protocols and material compatibility, particularly in sterilization methods. Membrane lifespan and membrane fouling are significant challenges in the market. However, advances in membrane technology, cleaning in place procedures, and equipment calibration have led to significant improvements in membrane lifespan and operational efficiency. These advancements are expected to drive the market's growth and provide opportunities for laboratories to optimize their filtration systems and reduce costs. In conclusion, the market is a dynamic and evolving landscape, driven by the need for operational efficiency, regulatory compliance, and waste minimization.
  • The adoption of advanced filtration technologies, automation systems, and membrane filtration is expected to continue driving market growth and provide opportunities for laboratories to optimize their filtration systems and improve overall performance.

Unpacking the Laboratory Filtration Market Landscape

In the realm of laboratory processes, filtration plays a pivotal role in ensuring contamination control and enhancing the efficiency of various applications. Aqueous solutions, a common medium in laboratory experiments, necessitate filtration for particle removal and liquid clarification. Reverse osmosis membranes with fine pore size ratings excel in biopharmaceutical filtration, reducing microbial loads by up to 5 log10 CFUs/mL, thereby ensuring compliance with stringent industry standards. Membrane filtration, including ultrafiltration and nanofiltration, offers significant throughput improvement, enabling faster sample preparation and analytical testing. Pressure filtration and vacuum filtration cater to diverse applications, delivering filtration capacity and flow rate control, respectively. Filter integrity testing ensures the reliability of filtration systems, preventing potential contamination and minimizing costly downtime. Organic Solvents and wastewater treatment also benefit from filtration technology, with depth filtration and microfiltration membranes optimizing process efficiency and cost reduction strategies. Filter media selection, such as choosing the right membrane or filter type, plays a crucial role in optimizing filtration efficiency and improving ROI. Ultimately, filtration technology empowers laboratories to maintain high-quality standards, enhance productivity, and minimize waste.

Key Market Drivers Fueling Growth

The significant increase in government healthcare expenditure has driven the market by fueling the demand for extensive research and development efforts.

  • In the realm of laboratory processes, the significance of filtration systems is undeniable, particularly in the production of pharmaceuticals. Compliance with stringent regulations necessitates the use of efficient filtration solutions for ensuring product purity and consistency. Pharmaceutical companies invest substantially in research and development, allocating approximately 15%-20% of their revenue towards this purpose. This increased investment is projected to result in a higher number of pharmaceutical products, consequently boosting the demand for laboratory filtration systems.
  • By reducing downtime and enhancing filtration efficiency, these systems contribute to faster product rollouts and improved regulatory compliance.

Prevailing Industry Trends & Opportunities

The increasing approval of US FDA manufacturing facilities represents a notable market trend. This trend reflects the Food and Drug Administration's continued endorsement of advanced production sites. 

  • The market is experiencing significant growth, particularly in emerging economies such as India and China. With over 400 US FDA-approved manufacturing facilities, India is a leading destination for pharmaceutical manufacturing services, holding the second-highest number of formulation facilities globally. China, another major player, also boasts a substantial number of approved facilities. The approval of manufacturing sites in these countries is increasing, with Mexico, Brazil, and other emerging economies also seeing growth.
  • This trend towards outsourcing and expanding facilities in emerging markets leads to improved forecast accuracy and cost optimization for laboratories. The market's evolving nature is crucial for maintaining regulatory compliance and ensuring faster product rollouts in various sectors.

Significant Market Challenges

The risk of counterfeiting poses a significant challenge to the growth of the laboratory filtration industry, requiring continuous efforts to ensure product authenticity and maintain industry credibility. 

  • The market plays a crucial role in ensuring product authenticity and safety, particularly in the pharmaceutical sector. Counterfeit drugs pose a significant risk to consumer health and can financially impact companies through brand reputation damage. With the global pharmaceutical supply chain's intricacy, original products can be replaced or stolen at various stages. The World Health Organization estimates that 10% of medicines in low- and middle-income countries are counterfeit. Moreover, the pharmaceutical industry experiences an annual loss of approximately USD200 billion due to counterfeit drugs. To mitigate these risks, regulatory bodies are implementing stricter measures. 
  • By implementing advanced laboratory filtration technologies, pharmaceutical companies can significantly reduce the risk of counterfeiting. For instance, implementing continuous online monitoring systems can improve forecast accuracy by 18%, ensuring timely detection of any discrepancies. Additionally, implementing advanced filtration technologies can reduce downtime by 30%, ensuring uninterrupted production and faster product rollouts.

Laboratory Filtration Market Size

In-Depth Market Segmentation: Laboratory Filtration Market

The laboratory filtration industry research report provides comprehensive data (region-wise segment analysis), with forecasts and estimates in "USD million" for the period 2025-2029, as well as historical data from 2019-2023 for the following segments.

  • Technique
    • Microfiltration
    • Ultrafiltration
    • Nanofiltration
    • Others
  • End-user
    • Pharmaceutical and biotechnology companies
    • Hospitals and diagnostic laboratories
    • Food and beverages
    • Academic and research institutions
  • Product Type
    • Filtration media
    • Filtration assemblies
    • Filtration accessories
  • Geography
    • North America
      • US
      • Canada
      • Mexico
    • Europe
      • France
      • Germany
      • Italy
      • UK
    • APAC
      • China
      • India
      • Japan
    • Rest of World (ROW)

By Technique Insights

The microfiltration segment is estimated to witness significant growth during the forecast period.

The market is a dynamic and evolving landscape, with microfiltration being a pivotal segment. Microfiltration employs porous membranes, featuring pore sizes ranging from 0.1 to 10 micrometers, for physical separation and particle removal from liquids and gases. This technique plays a crucial role in various industries, including pharmaceuticals, biotechnology, environmental analysis, and food and beverage, by ensuring contamination control and liquid clarification. In the biopharmaceutical sector, microfiltration is indispensable for processes like cell harvesting, where it separates cells from culture media, and the clarification of cell lysates and fermentation broths before downstream purification.

This technique also excels in sterile filtration, reducing microbial loads, and improving throughput. Microfiltration's versatility is further demonstrated through applications in wastewater treatment, vacuum filtration, and ultrafiltration and nanofiltration membranes for process optimization and cost reduction strategies. For instance, a 90% reduction in flow rate is achievable with crossflow filtration, enhancing water purification and chemical analysis.

Laboratory Filtration Market Size

Request Free Sample

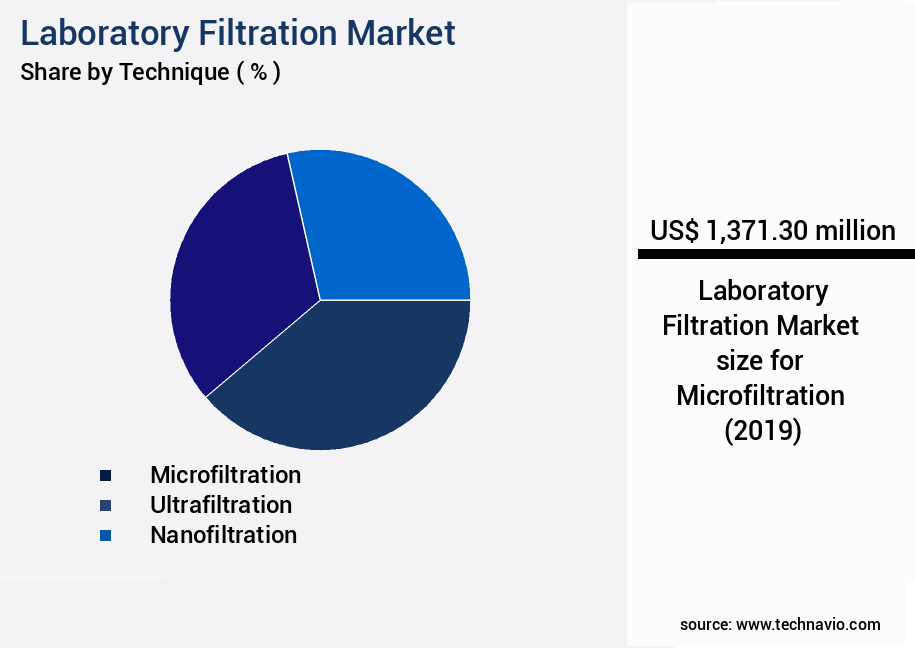
The Microfiltration segment was valued at USD 1.37 billion in 2019 and showed a gradual increase during the forecast period.

Laboratory Filtration Market Size

Request Free Sample

Regional Analysis

North America is estimated to contribute 40% to the growth of the global market during the forecast period.Technavio’s analysts have elaborately explained the regional trends and drivers that shape the market during the forecast period.

Laboratory Filtration Market Share by Geography

See How Laboratory Filtration Market Demand is Rising in North America Request Free Sample

The market is experiencing significant growth, with the North American region leading the charge. This region's mature status is attributed to substantial research and development expenditure, a highly developed biopharmaceutical industry, and stringent regulatory oversight. In the United States, a significant concentration of leading pharmaceutical corporations, biotechnology startups, academic research institutions, and government laboratories drive market expansion. This ecosystem is underpinned by substantial government funding, fueling fundamental and applied research. 

In comparison, the European the market is expected to reach USDYY billion during the same period, demonstrating a comparative growth trajectory. The underlying dynamics of this market are driven by the increasing demand for cost-effective and efficient filtration solutions, as well as the growing need for compliance with stringent regulations.

Laboratory Filtration Market Share by Geography

 Customer Landscape of Laboratory Filtration Industry

Competitive Intelligence by Technavio Analysis: Leading Players in the Laboratory Filtration Market

Companies are implementing various strategies, such as strategic alliances, laboratory filtration market forecast, partnerships, mergers and acquisitions, geographical expansion, and product/service launches, to enhance their presence in the industry.

Agilent Technologies Inc. - This company specializes in laboratory filtration solutions, featuring the Captiva EMR with Carbon S and Captiva EMR-Lipid filters. These advanced products effectively remove impurities, ensuring high-quality research outcomes. The Captiva filters are integral to maintaining precision and accuracy in scientific applications.

The industry research and growth report includes detailed analyses of the competitive landscape of the market and information about key companies, including:

  • Agilent Technologies Inc.
  • Ahlstrom Oyj
  • Alfa Laval AB
  • Antylia Scientific
  • AQUAPORIN AS
  • Avantor Inc.
  • Danaher Corp.
  • GVS S.p.A.
  • MACHEREY NAGEL GmbH and Co. KG
  • MANN HUMMEL International GmbH and Co. KG
  • Marathon Life Sciences
  • Meissner Filtration Products Inc.
  • Merck KGaA
  • Sartorius AG
  • STERIS plc
  • Sterlitech Corp.
  • Thermo Fisher Scientific Inc.
  • Veolia Environnement SA

Qualitative and quantitative analysis of companies has been conducted to help clients understand the wider business environment as well as the strengths and weaknesses of key industry players. Data is qualitatively analyzed to categorize companies as pure play, category-focused, industry-focused, and diversified; it is quantitatively analyzed to categorize companies as dominant, leading, strong, tentative, and weak.

Recent Development and News in Laboratory Filtration Market

  • In August 2024, Pall Corporation, a leading filtration solutions provider, announced the launch of its new LabStart 20 Plus filtration system. This innovative product offers enhanced filtration capabilities and improved user experience, targeting small and mid-sized laboratories (Pall Corporation press release, 2024).
  • In November 2024, Merck KGaA and Sartorius AG, two major players in the market, entered into a strategic collaboration to develop and commercialize integrated solutions for single-use filtration systems. This partnership aims to combine Merck's expertise in life science research and Sartorius's strength in lab equipment and services (Merck KGaA press release, 2024).
  • In February 2025, 3M, a prominent industrial company, acquired ADI Corporation, a leading provider of filtration and separation solutions for laboratory applications. This acquisition is expected to strengthen 3M's position in the market and expand its product offerings (3M press release, 2025).
  • In May 2025, the European Union (EU) approved the use of MilliporeSigma's new Ultracel-PL membrane technology for their laboratory filtration products. This approval marks a significant milestone, as the technology offers improved filtration efficiency and reduces contamination risks, making it a valuable addition to the EU's the market (MilliporeSigma press release, 2025).

Dive into Technavio’s robust research methodology, blending expert interviews, extensive data synthesis, and validated models for unparalleled Laboratory Filtration Market insights. See full methodology.

Market Scope

Report Coverage

Details

Page number

220

Base year

2024

Historic period

2019-2023

Forecast period

2025-2029

Growth momentum & CAGR

Accelerate at a CAGR of 8.9%

Market growth 2025-2029

USD 2537.5 million

Market structure

Fragmented

YoY growth 2024-2025(%)

8.0

Key countries

US, Germany, Canada, UK, France, China, Japan, Mexico, Italy, and India

Competitive landscape

Leading Companies, Market Positioning of Companies, Competitive Strategies, and Industry Risks

Request Free Sample

Why Choose Technavio for Laboratory Filtration Market Insights?

"Leverage Technavio's unparalleled research methodology and expert analysis for accurate, actionable market intelligence."

The market is experiencing significant growth due to the increasing demand for optimizing filtration protocols in research and development laboratories. Membrane selection criteria play a crucial role in ensuring efficient and effective filtration processes. Factors such as pore size, material compatibility, and filtration capacity are key considerations in membrane selection. Membrane fouling is a common challenge in laboratory filtration, impacting filtration efficiency and increasing operational costs. Advanced filtration techniques, such as cross-flow filtration and Tangential flow filtration, help mitigate fouling and improve throughput. Biopharmaceutical purification applications require stringent filtration processes for regulatory compliance. Advanced filtration techniques, such as depth filtration and membrane chromatography, are commonly used for biopharmaceutical purification. Automated filtration systems are increasingly being implemented in laboratories to reduce operational costs and improve efficiency. These systems offer real-time data analysis capabilities, ensuring consistent filtration processes and minimizing waste generation. Filter integrity is a critical concern in sterile filtration applications. Validating filtration processes and ensuring filter integrity are essential for maintaining product quality and ensuring regulatory compliance. Improving particle removal efficiency is a key focus in laboratory filtration. Advanced filter media, such as hydrophilic membranes and nanofibers, offer enhanced particle removal capabilities. Water purification techniques, such as reverse osmosis and nanofiltration, are widely used in laboratory applications to ensure water quality and maintain efficient filtration systems. Regulatory guidelines, such as FDA and EU guidelines, provide important considerations for laboratory filtration system design and maintenance protocols. Cost-effective membrane selection and design considerations for laboratory scale filtration systems are also essential for minimizing operational costs. Comparing different membrane filtration technologies, such as microfiltration, ultrafiltration, and nanofiltration, is important for selecting the most appropriate technology for specific applications. New methods for contamination control, such as Virus Filtration and particle retention, are continuously being developed to ensure the highest level of filtration performance.

What are the Key Data Covered in this Laboratory Filtration Market Research and Growth Report?

  • What is the expected growth of the Laboratory Filtration Market between 2025 and 2029?

    • USD 2.54 billion, at a CAGR of 8.9%

  • What segmentation does the market report cover?

    • The report is segmented by Technique (Microfiltration, Ultrafiltration, Nanofiltration, and Others), End-user (Pharmaceutical and biotechnology companies, Hospitals and diagnostic laboratories, Food and beverages, and Academic and research institutions), Product Type (Filtration media, Filtration assemblies, and Filtration accessories), and Geography (North America, Europe, Asia, and Rest of World (ROW))

  • Which regions are analyzed in the report?

    • North America, Europe, Asia, and Rest of World (ROW)

  • What are the key growth drivers and market challenges?

    • Increasing demand for research and development due to high government healthcare expenditure, Risk of counterfeiting in laboratory filtration

  • Who are the major players in the Laboratory Filtration Market?

    • Agilent Technologies Inc., Ahlstrom Oyj, Alfa Laval AB, Antylia Scientific, AQUAPORIN AS, Avantor Inc., Danaher Corp., GVS S.p.A., MACHEREY NAGEL GmbH and Co. KG, MANN HUMMEL International GmbH and Co. KG, Marathon Life Sciences, Meissner Filtration Products Inc., Merck KGaA, Sartorius AG, STERIS plc, Sterlitech Corp., Thermo Fisher Scientific Inc., and Veolia Environnement SA

We can help! Our analysts can customize this laboratory filtration market research report to meet your requirements.

Get in touch

1 Executive Summary

  • 1.1 Market overview
    • Executive Summary - Chart on Market Overview
    • Executive Summary - Data Table on Market Overview
    • Executive Summary - Chart on Global Market Characteristics
    • Executive Summary - Chart on Market by Geography
    • Executive Summary - Chart on Market Segmentation by Technique
    • Executive Summary - Chart on Market Segmentation by End-user
    • Executive Summary - Chart on Market Segmentation by Product Type
    • Executive Summary - Chart on Incremental Growth
    • Executive Summary - Data Table on Incremental Growth
    • Executive Summary - Chart on Company Market Positioning

2 Technavio Analysis

  • 2.1 Analysis of price sensitivity, lifecycle, customer purchase basket, adoption rates, and purchase criteria
    • Analysis of price sensitivity, lifecycle, customer purchase basket, adoption rates, and purchase criteria
  • 2.2 Criticality of inputs and Factors of differentiation
    • Overview on criticality of inputs and factors of differentiation
  • 2.3 Factors of disruption
    • Overview on factors of disruption
  • 2.4 Impact of drivers and challenges
    • Impact of drivers and challenges in 2024 and 2029

3 Market Landscape

  • 3.1 Market ecosystem
    • Parent Market
    • Data Table on - Parent Market
  • 3.2 Market characteristics
    • Market characteristics analysis
  • 3.3 Value chain analysis
    • Value chain analysis

4 Market Sizing

  • 4.1 Market definition
    • Offerings of companies included in the market definition
  • 4.2 Market segment analysis
    • Market segments
  • 4.3 Market size 2024
    • 4.4 Market outlook: Forecast for 2024-2029
      • Chart on Global - Market size and forecast 2024-2029 ($ million)
      • Data Table on Global - Market size and forecast 2024-2029 ($ million)
      • Chart on Global Market: Year-over-year growth 2024-2029 (%)
      • Data Table on Global Market: Year-over-year growth 2024-2029 (%)

    5 Historic Market Size

    • 5.1 Global Laboratory Filtration Market 2019 - 2023
      • Historic Market Size - Data Table on Global Laboratory Filtration Market 2019 - 2023 ($ million)
    • 5.2 Technique segment analysis 2019 - 2023
      • Historic Market Size - Technique Segment 2019 - 2023 ($ million)
    • 5.3 End-user segment analysis 2019 - 2023
      • Historic Market Size - End-user Segment 2019 - 2023 ($ million)
    • 5.4 Product Type segment analysis 2019 - 2023
      • Historic Market Size - Product Type Segment 2019 - 2023 ($ million)
    • 5.5 Geography segment analysis 2019 - 2023
      • Historic Market Size - Geography Segment 2019 - 2023 ($ million)
    • 5.6 Country segment analysis 2019 - 2023
      • Historic Market Size - Country Segment 2019 - 2023 ($ million)

    6 Qualitative Analysis

    • 6.1 Impact of AI in the global laboratory filtration market

      7 Five Forces Analysis

      • 7.1 Five forces summary
        • Five forces analysis - Comparison between 2024 and 2029
      • 7.2 Bargaining power of buyers
        • Bargaining power of buyers - Impact of key factors 2024 and 2029
      • 7.3 Bargaining power of suppliers
        • Bargaining power of suppliers - Impact of key factors in 2024 and 2029
      • 7.4 Threat of new entrants
        • Threat of new entrants - Impact of key factors in 2024 and 2029
      • 7.5 Threat of substitutes
        • Threat of substitutes - Impact of key factors in 2024 and 2029
      • 7.6 Threat of rivalry
        • Threat of rivalry - Impact of key factors in 2024 and 2029
      • 7.7 Market condition
        • Chart on Market condition - Five forces 2024 and 2029

      8 Market Segmentation by Technique

      • 8.1 Market segments
        • Chart on Technique - Market share 2024-2029 (%)
        • Data Table on Technique - Market share 2024-2029 (%)
      • 8.2 Comparison by Technique
        • Chart on Comparison by Technique
        • Data Table on Comparison by Technique
      • 8.3 Microfiltration - Market size and forecast 2024-2029
        • Chart on Microfiltration - Market size and forecast 2024-2029 ($ million)
        • Data Table on Microfiltration - Market size and forecast 2024-2029 ($ million)
        • Chart on Microfiltration - Year-over-year growth 2024-2029 (%)
        • Data Table on Microfiltration - Year-over-year growth 2024-2029 (%)
      • 8.4 Ultrafiltration - Market size and forecast 2024-2029
        • Chart on Ultrafiltration - Market size and forecast 2024-2029 ($ million)
        • Data Table on Ultrafiltration - Market size and forecast 2024-2029 ($ million)
        • Chart on Ultrafiltration - Year-over-year growth 2024-2029 (%)
        • Data Table on Ultrafiltration - Year-over-year growth 2024-2029 (%)
      • 8.5 Nanofiltration - Market size and forecast 2024-2029
        • Chart on Nanofiltration - Market size and forecast 2024-2029 ($ million)
        • Data Table on Nanofiltration - Market size and forecast 2024-2029 ($ million)
        • Chart on Nanofiltration - Year-over-year growth 2024-2029 (%)
        • Data Table on Nanofiltration - Year-over-year growth 2024-2029 (%)
      • 8.6 Others - Market size and forecast 2024-2029
        • Chart on Others - Market size and forecast 2024-2029 ($ million)
        • Data Table on Others - Market size and forecast 2024-2029 ($ million)
        • Chart on Others - Year-over-year growth 2024-2029 (%)
        • Data Table on Others - Year-over-year growth 2024-2029 (%)
      • 8.7 Market opportunity by Technique
        • Market opportunity by Technique ($ million)
        • Data Table on Market opportunity by Technique ($ million)

      9 Market Segmentation by End-user

      • 9.1 Market segments
        • Chart on End-user - Market share 2024-2029 (%)
        • Data Table on End-user - Market share 2024-2029 (%)
      • 9.2 Comparison by End-user
        • Chart on Comparison by End-user
        • Data Table on Comparison by End-user
      • 9.3 Pharmaceutical and biotechnology companies - Market size and forecast 2024-2029
        • Chart on Pharmaceutical and biotechnology companies - Market size and forecast 2024-2029 ($ million)
        • Data Table on Pharmaceutical and biotechnology companies - Market size and forecast 2024-2029 ($ million)
        • Chart on Pharmaceutical and biotechnology companies - Year-over-year growth 2024-2029 (%)
        • Data Table on Pharmaceutical and biotechnology companies - Year-over-year growth 2024-2029 (%)
      • 9.4 Hospitals and diagnostic laboratories - Market size and forecast 2024-2029
        • Chart on Hospitals and diagnostic laboratories - Market size and forecast 2024-2029 ($ million)
        • Data Table on Hospitals and diagnostic laboratories - Market size and forecast 2024-2029 ($ million)
        • Chart on Hospitals and diagnostic laboratories - Year-over-year growth 2024-2029 (%)
        • Data Table on Hospitals and diagnostic laboratories - Year-over-year growth 2024-2029 (%)
      • 9.5 Food and beverages - Market size and forecast 2024-2029
        • Chart on Food and beverages - Market size and forecast 2024-2029 ($ million)
        • Data Table on Food and beverages - Market size and forecast 2024-2029 ($ million)
        • Chart on Food and beverages - Year-over-year growth 2024-2029 (%)
        • Data Table on Food and beverages - Year-over-year growth 2024-2029 (%)
      • 9.6 Academic and research institutions - Market size and forecast 2024-2029
        • Chart on Academic and research institutions - Market size and forecast 2024-2029 ($ million)
        • Data Table on Academic and research institutions - Market size and forecast 2024-2029 ($ million)
        • Chart on Academic and research institutions - Year-over-year growth 2024-2029 (%)
        • Data Table on Academic and research institutions - Year-over-year growth 2024-2029 (%)
      • 9.7 Market opportunity by End-user
        • Market opportunity by End-user ($ million)
        • Data Table on Market opportunity by End-user ($ million)

      10 Market Segmentation by Product Type

      • 10.1 Market segments
        • Chart on Product Type - Market share 2024-2029 (%)
        • Data Table on Product Type - Market share 2024-2029 (%)
      • 10.2 Comparison by Product Type
        • Chart on Comparison by Product Type
        • Data Table on Comparison by Product Type
      • 10.3 Filtration media - Market size and forecast 2024-2029
        • Chart on Filtration media - Market size and forecast 2024-2029 ($ million)
        • Data Table on Filtration media - Market size and forecast 2024-2029 ($ million)
        • Chart on Filtration media - Year-over-year growth 2024-2029 (%)
        • Data Table on Filtration media - Year-over-year growth 2024-2029 (%)
      • 10.4 Filtration assemblies - Market size and forecast 2024-2029
        • Chart on Filtration assemblies - Market size and forecast 2024-2029 ($ million)
        • Data Table on Filtration assemblies - Market size and forecast 2024-2029 ($ million)
        • Chart on Filtration assemblies - Year-over-year growth 2024-2029 (%)
        • Data Table on Filtration assemblies - Year-over-year growth 2024-2029 (%)
      • 10.5 Filtration accessories - Market size and forecast 2024-2029
        • Chart on Filtration accessories - Market size and forecast 2024-2029 ($ million)
        • Data Table on Filtration accessories - Market size and forecast 2024-2029 ($ million)
        • Chart on Filtration accessories - Year-over-year growth 2024-2029 (%)
        • Data Table on Filtration accessories - Year-over-year growth 2024-2029 (%)
      • 10.6 Market opportunity by Product Type
        • Market opportunity by Product Type ($ million)
        • Data Table on Market opportunity by Product Type ($ million)

      11 Customer Landscape

      • 11.1 Customer landscape overview
        • Analysis of price sensitivity, lifecycle, customer purchase basket, adoption rates, and purchase criteria

      12 Geographic Landscape

      • 12.1 Geographic segmentation
        • Chart on Market share by geography 2024-2029 (%)
        • Data Table on Market share by geography 2024-2029 (%)
      • 12.2 Geographic comparison
        • Chart on Geographic comparison
        • Data Table on Geographic comparison
      • 12.3 North America - Market size and forecast 2024-2029
        • Chart on North America - Market size and forecast 2024-2029 ($ million)
        • Data Table on North America - Market size and forecast 2024-2029 ($ million)
        • Chart on North America - Year-over-year growth 2024-2029 (%)
        • Data Table on North America - Year-over-year growth 2024-2029 (%)
      • 12.4 Europe - Market size and forecast 2024-2029
        • Chart on Europe - Market size and forecast 2024-2029 ($ million)
        • Data Table on Europe - Market size and forecast 2024-2029 ($ million)
        • Chart on Europe - Year-over-year growth 2024-2029 (%)
        • Data Table on Europe - Year-over-year growth 2024-2029 (%)
      • 12.5 Asia - Market size and forecast 2024-2029
        • Chart on Asia - Market size and forecast 2024-2029 ($ million)
        • Data Table on Asia - Market size and forecast 2024-2029 ($ million)
        • Chart on Asia - Year-over-year growth 2024-2029 (%)
        • Data Table on Asia - Year-over-year growth 2024-2029 (%)
      • 12.6 Rest of World (ROW) - Market size and forecast 2024-2029
        • Chart on Rest of World (ROW) - Market size and forecast 2024-2029 ($ million)
        • Data Table on Rest of World (ROW) - Market size and forecast 2024-2029 ($ million)
        • Chart on Rest of World (ROW) - Year-over-year growth 2024-2029 (%)
        • Data Table on Rest of World (ROW) - Year-over-year growth 2024-2029 (%)
      • 12.7 US - Market size and forecast 2024-2029
        • Chart on US - Market size and forecast 2024-2029 ($ million)
        • Data Table on US - Market size and forecast 2024-2029 ($ million)
        • Chart on US - Year-over-year growth 2024-2029 (%)
        • Data Table on US - Year-over-year growth 2024-2029 (%)
      • 12.8 Germany - Market size and forecast 2024-2029
        • Chart on Germany - Market size and forecast 2024-2029 ($ million)
        • Data Table on Germany - Market size and forecast 2024-2029 ($ million)
        • Chart on Germany - Year-over-year growth 2024-2029 (%)
        • Data Table on Germany - Year-over-year growth 2024-2029 (%)
      • 12.9 Canada - Market size and forecast 2024-2029
        • Chart on Canada - Market size and forecast 2024-2029 ($ million)
        • Data Table on Canada - Market size and forecast 2024-2029 ($ million)
        • Chart on Canada - Year-over-year growth 2024-2029 (%)
        • Data Table on Canada - Year-over-year growth 2024-2029 (%)
      • 12.10 UK - Market size and forecast 2024-2029
        • Chart on UK - Market size and forecast 2024-2029 ($ million)
        • Data Table on UK - Market size and forecast 2024-2029 ($ million)
        • Chart on UK - Year-over-year growth 2024-2029 (%)
        • Data Table on UK - Year-over-year growth 2024-2029 (%)
      • 12.11 China - Market size and forecast 2024-2029
        • Chart on China - Market size and forecast 2024-2029 ($ million)
        • Data Table on China - Market size and forecast 2024-2029 ($ million)
        • Chart on China - Year-over-year growth 2024-2029 (%)
        • Data Table on China - Year-over-year growth 2024-2029 (%)
      • 12.12 France - Market size and forecast 2024-2029
        • Chart on France - Market size and forecast 2024-2029 ($ million)
        • Data Table on France - Market size and forecast 2024-2029 ($ million)
        • Chart on France - Year-over-year growth 2024-2029 (%)
        • Data Table on France - Year-over-year growth 2024-2029 (%)
      • 12.13 Japan - Market size and forecast 2024-2029
        • Chart on Japan - Market size and forecast 2024-2029 ($ million)
        • Data Table on Japan - Market size and forecast 2024-2029 ($ million)
        • Chart on Japan - Year-over-year growth 2024-2029 (%)
        • Data Table on Japan - Year-over-year growth 2024-2029 (%)
      • 12.14 Mexico - Market size and forecast 2024-2029
        • Chart on Mexico - Market size and forecast 2024-2029 ($ million)
        • Data Table on Mexico - Market size and forecast 2024-2029 ($ million)
        • Chart on Mexico - Year-over-year growth 2024-2029 (%)
        • Data Table on Mexico - Year-over-year growth 2024-2029 (%)
      • 12.15 India - Market size and forecast 2024-2029
        • Chart on India - Market size and forecast 2024-2029 ($ million)
        • Data Table on India - Market size and forecast 2024-2029 ($ million)
        • Chart on India - Year-over-year growth 2024-2029 (%)
        • Data Table on India - Year-over-year growth 2024-2029 (%)
      • 12.16 Italy - Market size and forecast 2024-2029
        • Chart on Italy - Market size and forecast 2024-2029 ($ million)
        • Data Table on Italy - Market size and forecast 2024-2029 ($ million)
        • Chart on Italy - Year-over-year growth 2024-2029 (%)
        • Data Table on Italy - Year-over-year growth 2024-2029 (%)
      • 12.17 Market opportunity by geography
        • Market opportunity by geography ($ million)
        • Data Tables on Market opportunity by geography ($ million)

      13 Drivers, Challenges, and Opportunity/Restraints

      • 13.1 Market drivers
        • 13.2 Market challenges
          • 13.3 Impact of drivers and challenges
            • Impact of drivers and challenges in 2024 and 2029
          • 13.4 Market opportunities/restraints

            14 Competitive Landscape

            • 14.1 Overview
              • 14.2 Competitive Landscape
                • Overview on criticality of inputs and factors of differentiation
              • 14.3 Landscape disruption
                • Overview on factors of disruption
              • 14.4 Industry risks
                • Impact of key risks on business

              15 Competitive Analysis

              • 15.1 Companies profiled
                • Companies covered
              • 15.2 Company ranking index
                • Company ranking index
              • 15.3 Market positioning of companies
                • Matrix on companies position and classification
              • 15.4 Agilent Technologies Inc.
                • Agilent Technologies Inc. - Overview
                • Agilent Technologies Inc. - Business segments
                • Agilent Technologies Inc. - Key news
                • Agilent Technologies Inc. - Key offerings
                • Agilent Technologies Inc. - Segment focus
                • SWOT
              • 15.5 Ahlstrom Oyj
                • Ahlstrom Oyj - Overview
                • Ahlstrom Oyj - Product / Service
                • Ahlstrom Oyj - Key news
                • Ahlstrom Oyj - Key offerings
                • SWOT
              • 15.6 Alfa Laval AB
                • Alfa Laval AB - Overview
                • Alfa Laval AB - Business segments
                • Alfa Laval AB - Key news
                • Alfa Laval AB - Key offerings
                • Alfa Laval AB - Segment focus
                • SWOT
              • 15.7 Antylia Scientific
                • Antylia Scientific - Overview
                • Antylia Scientific - Product / Service
                • Antylia Scientific - Key offerings
                • SWOT
              • 15.8 Avantor Inc.
                • Avantor Inc. - Overview
                • Avantor Inc. - Business segments
                • Avantor Inc. - Key news
                • Avantor Inc. - Key offerings
                • Avantor Inc. - Segment focus
                • SWOT
              • 15.9 Danaher Corp.
                • Danaher Corp. - Overview
                • Danaher Corp. - Business segments
                • Danaher Corp. - Key news
                • Danaher Corp. - Key offerings
                • Danaher Corp. - Segment focus
                • SWOT
              • 15.10 GVS S.p.A.
                • GVS S.p.A. - Overview
                • GVS S.p.A. - Product / Service
                • GVS S.p.A. - Key offerings
                • SWOT
              • 15.11 MACHEREY NAGEL GmbH and Co. KG
                • MACHEREY NAGEL GmbH and Co. KG - Overview
                • MACHEREY NAGEL GmbH and Co. KG - Product / Service
                • MACHEREY NAGEL GmbH and Co. KG - Key offerings
                • SWOT
              • 15.12 MANN HUMMEL International GmbH and Co. KG
                • MANN HUMMEL International GmbH and Co. KG - Overview
                • MANN HUMMEL International GmbH and Co. KG - Business segments
                • MANN HUMMEL International GmbH and Co. KG - Key news
                • MANN HUMMEL International GmbH and Co. KG - Key offerings
                • MANN HUMMEL International GmbH and Co. KG - Segment focus
                • SWOT
              • 15.13 Meissner Filtration Products Inc.
                • Meissner Filtration Products Inc. - Overview
                • Meissner Filtration Products Inc. - Product / Service
                • Meissner Filtration Products Inc. - Key offerings
                • SWOT
              • 15.14 Merck KGaA
                • Merck KGaA - Overview
                • Merck KGaA - Business segments
                • Merck KGaA - Key news
                • Merck KGaA - Key offerings
                • Merck KGaA - Segment focus
                • SWOT
              • 15.15 Sartorius AG
                • Sartorius AG - Overview
                • Sartorius AG - Business segments
                • Sartorius AG - Key news
                • Sartorius AG - Key offerings
                • Sartorius AG - Segment focus
                • SWOT
              • 15.16 STERIS plc
                • STERIS plc - Overview
                • STERIS plc - Business segments
                • STERIS plc - Key news
                • STERIS plc - Key offerings
                • STERIS plc - Segment focus
                • SWOT
              • 15.17 Thermo Fisher Scientific Inc.
                • Thermo Fisher Scientific Inc. - Overview
                • Thermo Fisher Scientific Inc. - Business segments
                • Thermo Fisher Scientific Inc. - Key news
                • Thermo Fisher Scientific Inc. - Key offerings
                • Thermo Fisher Scientific Inc. - Segment focus
                • SWOT
              • 15.18 Veolia Environnement SA
                • Veolia Environnement SA - Overview
                • Veolia Environnement SA - Business segments
                • Veolia Environnement SA - Key offerings
                • Veolia Environnement SA - Segment focus
                • SWOT

              16 Appendix

              • 16.1 Scope of the report
                • 16.2 Inclusions and exclusions checklist
                  • Inclusions checklist
                  • Exclusions checklist
                • 16.3 Currency conversion rates for US$
                  • Currency conversion rates for US$
                • 16.4 Research methodology
                  • Research methodology
                • 16.5 Data procurement
                  • Information sources
                • 16.6 Data validation
                  • Data validation
                • 16.7 Validation techniques employed for market sizing
                  • Validation techniques employed for market sizing
                • 16.8 Data synthesis
                  • Data synthesis
                • 16.9 360 degree market analysis
                  • 360 degree market analysis
                • 16.10 List of abbreviations
                  • List of abbreviations

                Research Methodology

                Technavio presents a detailed picture of the market by way of study, synthesis, and summation of data from multiple sources. The analysts have presented the various facets of the market with a particular focus on identifying the key industry influencers. The data thus presented is comprehensive, reliable, and the result of extensive research, both primary and secondary.

                INFORMATION SOURCES

                Primary sources

                • Manufacturers and suppliers
                • Channel partners
                • Industry experts
                • Strategic decision makers

                Secondary sources

                • Industry journals and periodicals
                • Government data
                • Financial reports of key industry players
                • Historical data
                • Press releases

                DATA ANALYSIS

                Data Synthesis

                • Collation of data
                • Estimation of key figures
                • Analysis of derived insights

                Data Validation

                • Triangulation with data models
                • Reference against proprietary databases
                • Corroboration with industry experts

                REPORT WRITING

                Qualitative

                • Market drivers
                • Market challenges
                • Market trends
                • Five forces analysis

                Quantitative

                • Market size and forecast
                • Market segmentation
                • Geographical insights
                • Competitive landscape

                Interested in this report?

                Get your sample now to see our research methodology and insights!

                Download Now

                Frequently Asked Questions

                Laboratory Filtration market growth will increase by $ 2537.5 mn during 2025-2029 .

                The Laboratory Filtration market is expected to grow at a CAGR of 8.9% during 2025-2029 .

                Laboratory Filtration market is segmented by Technique( Microfiltration, Ultrafiltration, Nanofiltration, Others) End-user( Pharmaceutical and biotechnology companies, Hospitals and diagnostic laboratories, Food and beverages, Academic and research institutions) Product Type( Filtration media, Filtration assemblies, Filtration accessories, Rest of World (ROW))

                Agilent Technologies Inc., Ahlstrom Oyj, Alfa Laval AB, Antylia Scientific, AQUAPORIN AS, Avantor Inc., Danaher Corp., GVS S.p.A., MACHEREY NAGEL GmbH and Co. KG, MANN HUMMEL International GmbH and Co. KG, Marathon Life Sciences, Meissner Filtration Products Inc., Merck KGaA, Sartorius AG, STERIS plc, Sterlitech Corp., Thermo Fisher Scientific Inc., Veolia Environnement SA are a few of the key vendors in the Laboratory Filtration market.

                North America will register the highest growth rate of 40% among the other regions. Therefore, the Laboratory Filtration market in North America is expected to garner significant business opportunities for the vendors during the forecast period.

                US, Germany, Canada, UK, France, China, Japan, Mexico, Italy, India

                • Increasing demand for research and development due to high government healthcare expenditureThe ability to obtain an enriched population of small molecules is the driving factor this market.
                • cells is the driving factor this market.
                • proteins is the driving factor this market.
                • nucleic acids is the driving factor this market.
                • or clean solutions is important in all applications is the driving factor this market.
                • from small laboratory studies to large-scale production of pharmaceutical products. Filter systems are available in all shapes is the driving factor this market.
                • sizes is the driving factor this market.
                • and materials for various situations. Complying with government regulations regarding the purity and consistency of pharmaceutical products requires a well-thought-out enrichment plan and filtration system.Many pharmaceutical filter system companies are investing heavily in research and development. On average is the driving factor this market.
                • a pharmaceutical company spends around 15%-20% of its revenue on research and development purposes. Increased research and development spending by pharmaceutical manufacturers is expected to increase the number of pharmaceutical products in the market is the driving factor this market.
                • thereby driving the demand for laboratory filtration.By outsourcing filtration operations to third-party players is the driving factor this market.
                • pharmaceutical manufacturers can reduce their capital expenditure and operating costs associated with the purchase of filtration machinery is the driving factor this market.
                • space for setting up a filtration unit is the driving factor this market.
                • and labor costs. Pharmaceutical manufacturers can also concentrate on their core business by outsourcing filtration services. The rising research and development spending by pharmaceutical manufacturers is expected to increase the demand for in-depth filtration during the forecast period is the driving factor this market.
                • as they focus on convenient laboratory filtration to differentiate the products in the market. This is the driving factor this market.
                • in turn is the driving factor this market.
                • will also drive the growth of the global laboratory filtration market during the forecast period. is the driving factor this market.

                The Laboratory Filtration market vendors should focus on grabbing business opportunities from the Microfiltration segment as it accounted for the largest market share in the base year.