Light-Emitting Diode (LED) Market Analysis, Size, and Forecast 2025-2029: APAC (China, India, Japan, South Korea), Europe (France, Germany, Italy, UK), North America (US), South America (Brazil), and Middle East and Africa

Light-Emitting Diode (LED) Market Analysis, Size, and Forecast 2025-2029:
APAC (China, India, Japan, South Korea), Europe (France, Germany, Italy, UK), North America (US), South America (Brazil), and Middle East and Africa

Published: Mar 2025 244 Pages SKU: IRTNTR41086

Market Overview at a Glance

$264.1 Mn
Market Opportunity
19.2%
CAGR
15.7
YoY growth 2024-2025(%)

Light-Emitting Diode (LED) Market Size 2025-2029

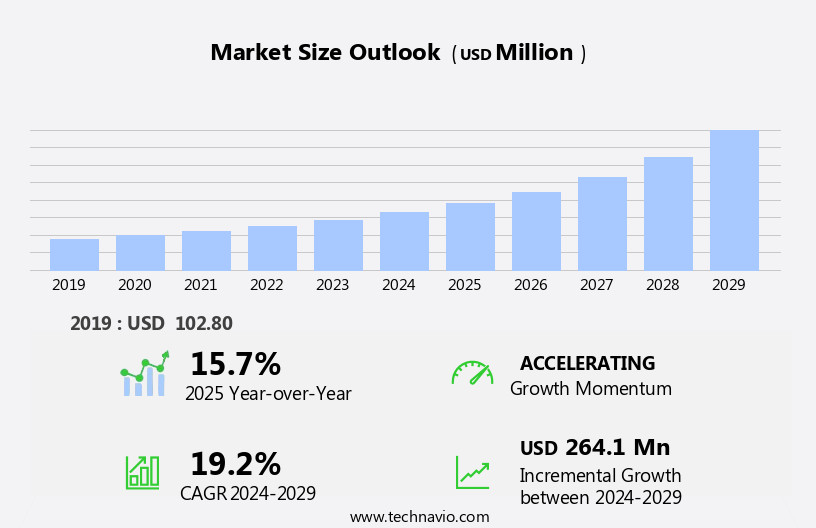
The light-emitting diode market size is forecast to increase by USD 264.1 million at a CAGR of 19.2% between 2024 and 2029.

  • The global LED market is experiencing significant growth, driven by the increasing adoption of energy-efficient lighting technologies and the high traction of intelligent lighting systems. Energy savings and environmental sustainability are key priorities for businesses and consumers alike, leading to a shift away from traditional lighting sources towards LED technology. Moreover, the integration of IoT and AI capabilities in LED lighting systems is revolutionizing the way lighting is used and managed, offering new opportunities for cost savings, energy optimization, and enhanced user experiences. However, the high average cost per LED fixture remains a challenge for market penetration, particularly in price-sensitive markets.
  • To capitalize on this market opportunity, companies should focus on developing cost-effective solutions while continuing to innovate in areas such as design, connectivity, and energy efficiency. By staying abreast of market trends and addressing the challenges, businesses can effectively navigate the dynamic LED market landscape and position themselves for long-term success.

What will be the Size of the Light-Emitting Diode (LED) Market during the forecast period?

Light-Emitting Diode (LED) Market Size

 Request Free Sample

  • The LED market encompasses a diverse range of applications, including LED lighting, displays, signage, strips, backlighting, grow lights, floodlights, tubes, and more. This market continues to experience growth due to the numerous benefits of LED technology, such as energy efficiency, longer lifespan, and versatility. According to industry reports, the global LED market is projected to reach a significant size by 2025, driven by increasing demand for energy-efficient solutions and continuous innovations in LED design, engineering, and materials. LED applications span various sectors, including commercial, residential, industrial, and outdoor lighting, as well as display and signage industries. Ongoing research and development efforts are focused on enhancing the performance, affordability, and customization of LED solutions, further expanding their market reach and potential.

How is this Light-Emitting Diode (LED) Industry segmented?

The light-emitting diode (LED) industry research report provides comprehensive data (region-wise segment analysis), with forecasts and estimates in "USD million" for the period 2025-2029, as well as historical data from 2019-2023 for the following segments.

  • Product
    • Luminaires
    • Lamps
  • Application
    • General lighting
    • Automotive lighting
    • Backlight
    • Others
  • Distribution Channel
    • Offline
    • Online
  • Type
    • SMD LEDs
    • High-power LEDs
    • Through-hole LEDs
    • RGB LEDs
    • Others
  • Geography
    • APAC
      • China
      • India
      • Japan
      • South Korea
    • Europe
      • France
      • Germany
      • Italy
      • UK
    • North America
      • US
      • Canada
    • South America
      • Brazil
    • Middle East and Africa
      • UAE

By Product Insights

The luminaires segment is estimated to witness significant growth during the forecast period.

LED technology has revolutionized the lighting industry with its energy-efficient and cost-effective solutions. LED luminaires, including downlights, troffers, roadway fixtures, outdoor lighting, and others, are increasingly adopted across various sectors such as residential, office, retail, and industrial. LED luminaires offer numerous benefits, including longer lifespan, reduced energy consumption, and lower maintenance costs. Traditional luminaires, such as incandescent and fluorescent, have limitations like frequent replacement due to continuous switching, the need for external ballasts, and the presence of toxic mercury. LED luminaires, on the other hand, do not require external ballasts and have a longer lifespan, making them a more cost-effective and environmentally-friendly alternative.

The LED value chain includes LED chips, materials, components, drivers, controllers, systems, and modules. LED innovations continue to advance, leading to the development of LED displays, signage, backlighting, grow lights, floodlights, tubes, panels, screens, strips, and headlights. The adoption of LED technology is expected to continue, driven by its energy efficiency and cost savings.

Light-Emitting Diode (LED) Market Size

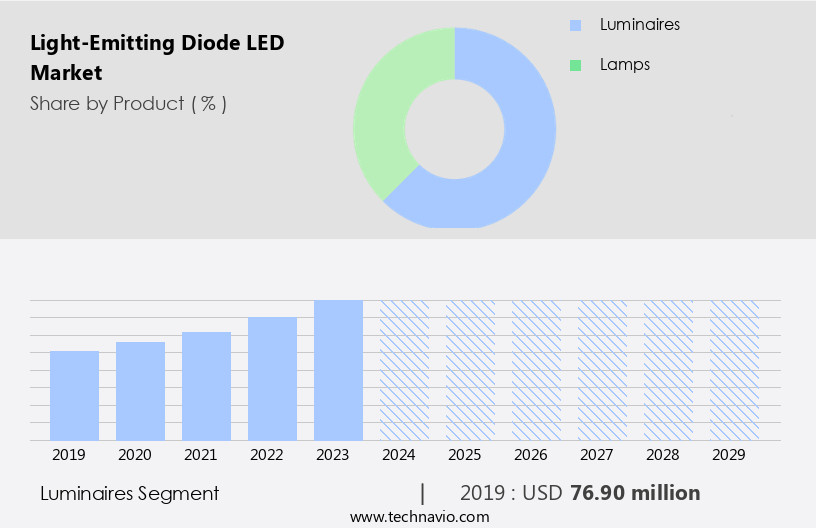
Get a glance at the market report of share of various segments Request Free Sample

The Luminaires segment was valued at USD 76.90 million in 2019 and showed a gradual increase during the forecast period.
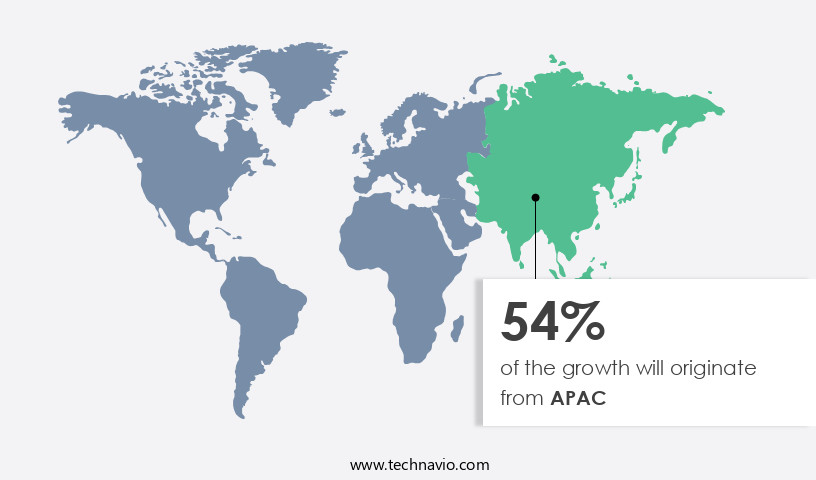
Regional Analysis

APAC is estimated to contribute 54% to the growth of the global market during the forecast period. Technavio's analysts have elaborately explained the regional trends and drivers that shape the market during the forecast period.

Light-Emitting Diode (LED) Market Share by Geography

For more insights on the market size of various regions, Request Free Sample

The market in APAC is experiencing significant growth due to the increasing demand for energy-efficient lighting solutions from the residential and commercial sectors. With the region becoming a hub for industries such as retail, hospitality, and healthcare, and the setting up of offices by multinational companies, the need for cost-effective and long-lasting LED lighting solutions is on the rise. Moreover, the development of smart infrastructure in several countries in the region, driven by improving IT infrastructure, is further fueling market growth. The construction market is also expanding, and governments' investments in infrastructure projects present substantial opportunities for the LED industry.

This trend is leading to increased demand for LED bulbs, fixtures, panels, displays, signage, street lights, strips, drivers, backlighting, grow lights, floodlights, tubes, downlights, headlights, and other LED innovations. The benefits of LED technology, including energy efficiency and environment-friendliness, make it an attractive alternative to traditional incandescent light sources. The LED value chain comprises various components, such as LED chips, materials, controllers, systems, modules, and design and engineering solutions, all contributing to the advancements in LED technology.

Market Dynamics

Our researchers analyzed the data with 2024 as the base year, along with the key drivers, trends, and challenges. A holistic analysis of drivers will help companies refine their marketing strategies to gain a competitive advantage.

What are the key market drivers leading to the rise in the adoption of Light-Emitting Diode (LED) Industry?

  • The growing adoption of energy-efficient lighting technologies is the key driver of the market. The global lighting market is experiencing significant growth due to the increasing demand for energy-efficient solutions. Given that lighting accounts for approximately 20% of global electricity production, governments worldwide are prioritizing the promotion of energy-efficient lighting technologies. In some regions, the use of traditional incandescent bulbs has been banned, leading to a rise in demand for alternatives such as halogen, Compact Fluorescent Lamps (CFL), Light Emitting Diodes (LED), and Lighting Fiber (LFL). Moreover, the growing consciousness towards energy conservation has fueled the adoption of energy-efficient lighting technologies, particularly LEDs, which consume up to 75% less energy than incandescent bulbs and can last up to 25 times longer.
  • This market trend is expected to continue as consumers and businesses seek to reduce their carbon footprint and save on energy costs.

What are the market trends shaping the Light-Emitting Diode (LED) Industry?

  • The growing traction of intelligent lighting systems is the upcoming market trend. The digital transformation of the lighting industry is gaining momentum with the integration of intelligent lighting systems and controls. Energy efficiency and cost savings are key drivers in the market, leading to the increasing adoption of LED technology. Intelligent lighting systems incorporate sensors for occupancy and daylight harvesting, enabling automatic adjustments to lighting levels based on natural light availability and room usage.
  • These systems also offer wireless controls for customized lighting settings and power management. By adapting to changing space requirements, intelligent LED lighting solutions are becoming essential in commercial buildings. The integration of advanced technology in lighting products enhances their functionality and efficiency, making them a valuable investment for businesses. The market for LED lighting solutions is expected to grow further, driven by continuous research and production advancements. LED grow lights are increasingly popular in horticulture, while LED signage and LED backlighting are common in advertising and digital displays. LED floodlights offer excellent outdoor illumination, and LED tubes are a cost-effective replacement for traditional incandescent bulbs. Overall, the LED market is poised for continued growth, driven by its numerous advantages and applications.

What challenges does the Light-Emitting Diode (LED) Industry face during its growth?

  • The high average cost per fixture is a key challenge affecting the industry growth. LED Market Dynamics: Despite the global decline in Average Selling Prices (ASPs) of LED lighting products, the high initial cost per fixture remains a significant barrier to adoption. This cost includes the expense of LED fixtures and related wiring, as well as labor costs. In newer homes, wiring is less of a concern, but older homes may necessitate electrical system renovations for safe LED bulb installation, further increasing costs. 
  • These factors contribute to the continued challenge of widespread LED market penetration. This affordability, coupled with the energy savings and longer lifespan, makes LED an attractive alternative to traditional lighting sources. LED's versatility extends beyond general illumination applications. In display backlighting applications, LEDs offer several advantages, including higher brightness, longer lifespan, and improved color accuracy compared to other backlighting technologies. Additionally, LEDs are used in signage and advertising, where their ability to display vibrant colors and high brightness is essential. LED's environmental friendliness is another factor contributing to its market growth. Unlike traditional lighting sources, such as incandescent bulbs, which contain hazardous materials like mercury, LEDs are free of such substances.

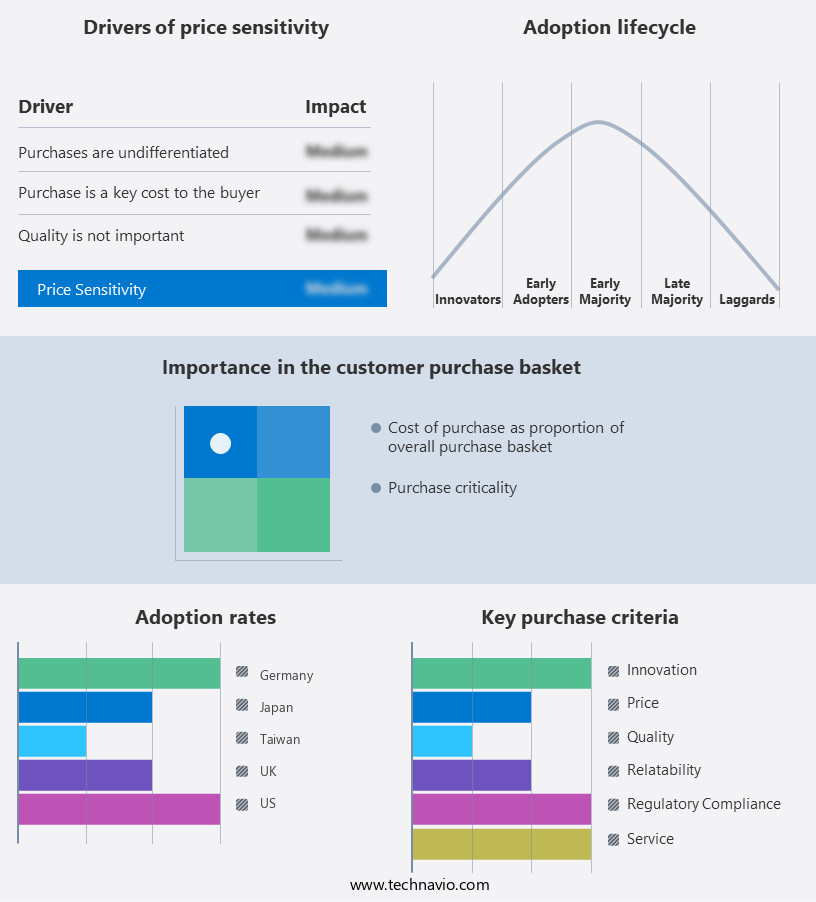
Exclusive Customer Landscape

The light-emitting diode (LED) market forecasting report includes the adoption lifecycle of the market, covering from the innovator's stage to the laggard's stage. It focuses on adoption rates in different regions based on penetration. Furthermore, the light-emitting diode (led) market report also includes key purchase criteria and drivers of price sensitivity to help companies evaluate and develop their market growth analysis strategies.

Light-Emitting Diode (LED) Market Share by Geography

 Customer Landscape

Key Companies & Market Insights

Companies are implementing various strategies, such as strategic alliances, light-emitting diode (led) market forecast, partnerships, mergers and acquisitions, geographical expansion, and product/service launches, to enhance their presence in the industry.

SMART Global Holdings Inc.- The company offers LED such as DL DR6BD14AWG, DL DR6BD14KKG, and DL DR6BD14WWE.

The industry research and growth report includes detailed analyses of the competitive landscape of the market and information about key companies, including:

  • Acuity Brands Inc.
  • ams OSRAM AG
  • Bridgelux Inc.
  • Dialight PLC
  • Eaton Corp. plc
  • Ennostar Inc.
  • EVERLIGHT ELECTRONICS CO. LTD.
  • General Electric Co.
  • GrowRay Lighting Technologies
  • Havells India Ltd.
  • LITE ON Technology Corp.
  • Lumileds Holding BV
  • Nichia Corp.
  • Samsung Electronics Co. Ltd.
  • Seoul Semiconductor Co. Ltd.
  • Sharp Corp.
  • Signify NV
  • SMART Global Holdings Inc.
  • Toyoda Gosei Co. Ltd.
  • Zumtobel Group AG

Qualitative and quantitative analysis of companies has been conducted to help clients understand the wider business environment as well as the strengths and weaknesses of key industry players. Data is qualitatively analyzed to categorize companies as pure play, category-focused, industry-focused, and diversified; it is quantitatively analyzed to categorize companies as dominant, leading, strong, tentative, and weak.

Research Analyst Overview

The global LED market encompasses a diverse range of applications, from general illumination to display backlighting and signage. This market's growth is underpinned by the technological advantages of LED lighting, which offers energy efficiency, longer lifespan, and cost-effectiveness compared to traditional incandescent light sources. LED technology, a semiconductor-based lighting solution, converts electrical energy into light through the emission of photons. Its versatility allows for various forms of LED products, including bulbs, fixtures, panels, screens, street lights, strips, and tubes, among others. The value chain of the LED market comprises several stages, from the production of LED chips to the manufacturing of LED components, systems, and solutions.

LED's energy efficiency is a significant factor driving its adoption in various sectors. Traditional lighting sources, such as incandescent bulbs, consume a substantial amount of electrical energy and emit a considerable amount of heat. In contrast, LEDs convert a large portion of electrical energy into light, making them more energy-efficient and environmentally friendly. Furthermore, LEDs have a longer lifespan, reducing the frequency of replacements and associated costs. LED's cost-effectiveness is another critical factor contributing to its market growth. While the production cost of LED chips has decreased significantly over the years, advancements in LED design, engineering, and manufacturing processes have led to more affordable LED products.

This makes LED a more sustainable and eco-friendly lighting solution. In summary, the global LED market is driven by the technological advantages of LED lighting, including energy efficiency, longer lifespan, and cost-effectiveness. Its versatility and environmental friendliness have led to its adoption in various sectors, from general illumination to display backlighting and signage. As LED technology continues to advance, it is poised to become the dominant lighting solution in the global market.  The LED market is witnessing significant growth with various applications such as LED signage, LED strips, LED backlighting, LED grow lights, LED floodlights, and LED tubes, leading the demand. LED drivers are an essential component in LED lighting systems, ensuring efficient power management. LED research and developments continue to advance, leading to the production of innovative LED materials and modules. Engineering advancements in LED technology result in energy savings, longer lifespan, and improved color rendering. LED benefits, including energy efficiency and eco-friendliness, make it a preferred choice for numerous industries.

Market Scope

Report Coverage

Details

Page number

244

Base year

2024

Historic period

2019-2023

Forecast period

2025-2029

Growth momentum & CAGR

Accelerate at a CAGR of 19.2%

Market growth 2025-2029

USD 264.1 million

Market structure

Fragmented

YoY growth 2024-2025(%)

15.7

Key countries

China, US, Japan, India, Germany, South Korea, Brazil, UK, Italy, and France

Competitive landscape

Leading Companies, Market Positioning of Companies, Competitive Strategies, and Industry Risks

Request Free Sample

What are the Key Data Covered in this Light-Emitting Diode (LED) Market Research and Growth Report?

  • CAGR of the Light-Emitting Diode (LED) industry during the forecast period
  • Detailed information on factors that will drive the growth and forecasting between 2025 and 2029
  • Precise estimation of the size of the market and its contribution of the industry in focus to the parent market
  • Accurate predictions about upcoming growth and trends and changes in consumer behaviour
  • Growth of the market across APAC, Europe, North America, South America, and Middle East and Africa
  • Thorough analysis of the market's competitive landscape and detailed information about companies
  • Comprehensive analysis of factors that will challenge the light-emitting diode (led) market growth of industry companies

We can help! Our analysts can customize this light-emitting diode (led) market research report to meet your requirements.

Get in touch

1 Executive Summary

  • 1.1 Market overview
    • Executive Summary - Chart on Market Overview
    • Executive Summary - Data Table on Market Overview
    • Executive Summary - Chart on Global Market Characteristics
    • Executive Summary - Chart on Market by Geography
    • Executive Summary - Chart on Market Segmentation by Product
    • Executive Summary - Chart on Market Segmentation by Application
    • Executive Summary - Chart on Market Segmentation by Distribution Channel
    • Executive Summary - Chart on Market Segmentation by Type
    • Executive Summary - Chart on Incremental Growth
    • Executive Summary - Data Table on Incremental Growth
    • Executive Summary - Chart on Company Market Positioning

2 Technavio Analysis

  • 2.1 Analysis of price sensitivity, lifecycle, customer purchase basket, adoption rates, and purchase criteria
    • Analysis of price sensitivity, lifecycle, customer purchase basket, adoption rates, and purchase criteria
  • 2.2 Criticality of inputs and Factors of differentiation
    • Overview on criticality of inputs and factors of differentiation
  • 2.3 Factors of disruption
    • Overview on factors of disruption
  • 2.4 Impact of drivers and challenges
    • Impact of drivers and challenges in 2024 and 2029

3 Market Landscape

  • 3.1 Market ecosystem
    • Parent Market
    • Data Table on - Parent Market
  • 3.2 Market characteristics
    • Market characteristics analysis
  • 3.3 Value chain analysis
    • Value chain analysis

4 Market Sizing

  • 4.1 Market definition
    • Offerings of companies included in the market definition
  • 4.2 Market segment analysis
    • Market segments
  • 4.3 Market size 2024
    • 4.4 Market outlook: Forecast for 2024-2029
      • Chart on Global - Market size and forecast 2024-2029 ($ million)
      • Data Table on Global - Market size and forecast 2024-2029 ($ million)
      • Chart on Global Market: Year-over-year growth 2024-2029 (%)
      • Data Table on Global Market: Year-over-year growth 2024-2029 (%)

    5 Historic Market Size

    • 5.1 Global Light-Emitting Diode (LED) Market 2019 - 2023
      • Historic Market Size - Data Table on Global Light-Emitting Diode (LED) Market 2019 - 2023 ($ million)
    • 5.2 Product segment analysis 2019 - 2023
      • Historic Market Size - Product Segment 2019 - 2023 ($ million)
    • 5.3 Application segment analysis 2019 - 2023
      • Historic Market Size - Application Segment 2019 - 2023 ($ million)
    • 5.4 Distribution Channel segment analysis 2019 - 2023
      • Historic Market Size - Distribution Channel Segment 2019 - 2023 ($ million)
    • 5.5 Type segment analysis 2019 - 2023
      • Historic Market Size - Type Segment 2019 - 2023 ($ million)
    • 5.6 Geography segment analysis 2019 - 2023
      • Historic Market Size - Geography Segment 2019 - 2023 ($ million)
    • 5.7 Country segment analysis 2019 - 2023
      • Historic Market Size - Country Segment 2019 - 2023 ($ million)

    6 Qualitative Analysis

    • 6.1 AI Impact on Global Light-Emitting Diode (LED) Market

      7 Five Forces Analysis

      • 7.1 Five forces summary
        • Five forces analysis - Comparison between 2024 and 2029
      • 7.2 Bargaining power of buyers
        • Bargaining power of buyers - Impact of key factors 2024 and 2029
      • 7.3 Bargaining power of suppliers
        • Bargaining power of suppliers - Impact of key factors in 2024 and 2029
      • 7.4 Threat of new entrants
        • Threat of new entrants - Impact of key factors in 2024 and 2029
      • 7.5 Threat of substitutes
        • Threat of substitutes - Impact of key factors in 2024 and 2029
      • 7.6 Threat of rivalry
        • Threat of rivalry - Impact of key factors in 2024 and 2029
      • 7.7 Market condition
        • Chart on Market condition - Five forces 2024 and 2029

      8 Market Segmentation by Product

      • 8.1 Market segments
        • Chart on Product - Market share (2024-2029) (%)
        • Data Table on Product - Market share (2024-2029) (%)
      • 8.2 Comparison by Product
        • Chart on Comparison by Product
        • Data Table on Comparison by Product
      • 8.3 Luminaires - Market size and forecast (2024-2029)
        • Chart on Luminaires - Market size and forecast (2024-2029) ($ million)
        • Data Table on Luminaires - Market size and forecast (2024-2029) ($ million)
        • Chart on Luminaires - Year-over-year growth (2024-2029) (%)
        • Data Table on Luminaires - Year-over-year growth (2024-2029) (%)
      • 8.4 Lamps - Market size and forecast (2024-2029)
        • Chart on Lamps - Market size and forecast (2024-2029) ($ million)
        • Data Table on Lamps - Market size and forecast (2024-2029) ($ million)
        • Chart on Lamps - Year-over-year growth (2024-2029) (%)
        • Data Table on Lamps - Year-over-year growth (2024-2029) (%)
      • 8.5 Market opportunity by Product
        • Market opportunity by Product ($ million)
        • Data Table on Market opportunity by Product ($ million)

      9 Market Segmentation by Application

      • 9.1 Market segments
        • Chart on Application - Market share (2024-2029) (%)
        • Data Table on Application - Market share (2024-2029) (%)
      • 9.2 Comparison by Application
        • Chart on Comparison by Application
        • Data Table on Comparison by Application
      • 9.3 General lighting - Market size and forecast (2024-2029)
        • Chart on General lighting - Market size and forecast (2024-2029) ($ million)
        • Data Table on General lighting - Market size and forecast (2024-2029) ($ million)
        • Chart on General lighting - Year-over-year growth (2024-2029) (%)
        • Data Table on General lighting - Year-over-year growth (2024-2029) (%)
      • 9.4 Automotive lighting - Market size and forecast (2024-2029)
        • Chart on Automotive lighting - Market size and forecast (2024-2029) ($ million)
        • Data Table on Automotive lighting - Market size and forecast (2024-2029) ($ million)
        • Chart on Automotive lighting - Year-over-year growth (2024-2029) (%)
        • Data Table on Automotive lighting - Year-over-year growth (2024-2029) (%)
      • 9.5 Backlight - Market size and forecast (2024-2029)
        • Chart on Backlight - Market size and forecast (2024-2029) ($ million)
        • Data Table on Backlight - Market size and forecast (2024-2029) ($ million)
        • Chart on Backlight - Year-over-year growth (2024-2029) (%)
        • Data Table on Backlight - Year-over-year growth (2024-2029) (%)
      • 9.6 Others - Market size and forecast (2024-2029)
        • Chart on Others - Market size and forecast (2024-2029) ($ million)
        • Data Table on Others - Market size and forecast (2024-2029) ($ million)
        • Chart on Others - Year-over-year growth (2024-2029) (%)
        • Data Table on Others - Year-over-year growth (2024-2029) (%)
      • 9.7 Market opportunity by Application
        • Market opportunity by Application ($ million)
        • Data Table on Market opportunity by Application ($ million)

      10 Market Segmentation by Distribution Channel

      • 10.1 Market segments
        • Chart on Distribution Channel - Market share (2024-2029) (%)
        • Data Table on Distribution Channel - Market share (2024-2029) (%)
      • 10.2 Comparison by Distribution Channel
        • Chart on Comparison by Distribution Channel
        • Data Table on Comparison by Distribution Channel
      • 10.3 Offline - Market size and forecast (2024-2029)
        • Chart on Offline - Market size and forecast (2024-2029) ($ million)
        • Data Table on Offline - Market size and forecast (2024-2029) ($ million)
        • Chart on Offline - Year-over-year growth (2024-2029) (%)
        • Data Table on Offline - Year-over-year growth (2024-2029) (%)
      • 10.4 Online - Market size and forecast (2024-2029)
        • Chart on Online - Market size and forecast (2024-2029) ($ million)
        • Data Table on Online - Market size and forecast (2024-2029) ($ million)
        • Chart on Online - Year-over-year growth (2024-2029) (%)
        • Data Table on Online - Year-over-year growth (2024-2029) (%)
      • 10.5 Market opportunity by Distribution Channel
        • Market opportunity by Distribution Channel ($ million)
        • Data Table on Market opportunity by Distribution Channel ($ million)

      11 Market Segmentation by Type

      • 11.1 Market segments
        • Chart on Type - Market share (2024-2029) (%)
        • Data Table on Type - Market share (2024-2029) (%)
      • 11.2 Comparison by Type
        • Chart on Comparison by Type
        • Data Table on Comparison by Type
      • 11.3 SMD LEDs - Market size and forecast (2024-2029)
        • Chart on SMD LEDs - Market size and forecast (2024-2029) ($ million)
        • Data Table on SMD LEDs - Market size and forecast (2024-2029) ($ million)
        • Chart on SMD LEDs - Year-over-year growth (2024-2029) (%)
        • Data Table on SMD LEDs - Year-over-year growth (2024-2029) (%)
      • 11.4 High-power LEDs - Market size and forecast (2024-2029)
        • Chart on High-power LEDs - Market size and forecast (2024-2029) ($ million)
        • Data Table on High-power LEDs - Market size and forecast (2024-2029) ($ million)
        • Chart on High-power LEDs - Year-over-year growth (2024-2029) (%)
        • Data Table on High-power LEDs - Year-over-year growth (2024-2029) (%)
      • 11.5 Through-hole LEDs - Market size and forecast (2024-2029)
        • Chart on Through-hole LEDs - Market size and forecast (2024-2029) ($ million)
        • Data Table on Through-hole LEDs - Market size and forecast (2024-2029) ($ million)
        • Chart on Through-hole LEDs - Year-over-year growth (2024-2029) (%)
        • Data Table on Through-hole LEDs - Year-over-year growth (2024-2029) (%)
      • 11.6 RGB LEDs - Market size and forecast (2024-2029)
        • Chart on RGB LEDs - Market size and forecast (2024-2029) ($ million)
        • Data Table on RGB LEDs - Market size and forecast (2024-2029) ($ million)
        • Chart on RGB LEDs - Year-over-year growth (2024-2029) (%)
        • Data Table on RGB LEDs - Year-over-year growth (2024-2029) (%)
      • 11.7 Others - Market size and forecast (2024-2029)
        • Chart on Others - Market size and forecast (2024-2029) ($ million)
        • Data Table on Others - Market size and forecast (2024-2029) ($ million)
        • Chart on Others - Year-over-year growth (2024-2029) (%)
        • Data Table on Others - Year-over-year growth (2024-2029) (%)
      • 11.8 Market opportunity by Type
        • Market opportunity by Type ($ million)
        • Data Table on Market opportunity by Type ($ million)

      12 Customer Landscape

      • 12.1 Customer landscape overview
        • Analysis of price sensitivity, lifecycle, customer purchase basket, adoption rates, and purchase criteria

      13 Geographic Landscape

      • 13.1 Geographic segmentation
        • Chart on Market share by geography 2024-2029 (%)
        • Data Table on Market share by geography 2024-2029 (%)
      • 13.2 Geographic comparison
        • Chart on Geographic comparison
        • Data Table on Geographic comparison
      • 13.3 APAC - Market size and forecast 2024-2029
        • Chart on APAC - Market size and forecast 2024-2029 ($ million)
        • Data Table on APAC - Market size and forecast 2024-2029 ($ million)
        • Chart on APAC - Year-over-year growth 2024-2029 (%)
        • Data Table on APAC - Year-over-year growth 2024-2029 (%)
      • 13.4 Europe - Market size and forecast 2024-2029
        • Chart on Europe - Market size and forecast 2024-2029 ($ million)
        • Data Table on Europe - Market size and forecast 2024-2029 ($ million)
        • Chart on Europe - Year-over-year growth 2024-2029 (%)
        • Data Table on Europe - Year-over-year growth 2024-2029 (%)
      • 13.5 North America - Market size and forecast 2024-2029
        • Chart on North America - Market size and forecast 2024-2029 ($ million)
        • Data Table on North America - Market size and forecast 2024-2029 ($ million)
        • Chart on North America - Year-over-year growth 2024-2029 (%)
        • Data Table on North America - Year-over-year growth 2024-2029 (%)
      • 13.6 South America - Market size and forecast 2024-2029
        • Chart on South America - Market size and forecast 2024-2029 ($ million)
        • Data Table on South America - Market size and forecast 2024-2029 ($ million)
        • Chart on South America - Year-over-year growth 2024-2029 (%)
        • Data Table on South America - Year-over-year growth 2024-2029 (%)
      • 13.7 Middle East and Africa - Market size and forecast 2024-2029
        • Chart on Middle East and Africa - Market size and forecast 2024-2029 ($ million)
        • Data Table on Middle East and Africa - Market size and forecast 2024-2029 ($ million)
        • Chart on Middle East and Africa - Year-over-year growth 2024-2029 (%)
        • Data Table on Middle East and Africa - Year-over-year growth 2024-2029 (%)
      • 13.8 China - Market size and forecast 2024-2029
        • Chart on China - Market size and forecast 2024-2029 ($ million)
        • Data Table on China - Market size and forecast 2024-2029 ($ million)
        • Chart on China - Year-over-year growth 2024-2029 (%)
        • Data Table on China - Year-over-year growth 2024-2029 (%)
      • 13.9 US - Market size and forecast 2024-2029
        • Chart on US - Market size and forecast 2024-2029 ($ million)
        • Data Table on US - Market size and forecast 2024-2029 ($ million)
        • Chart on US - Year-over-year growth 2024-2029 (%)
        • Data Table on US - Year-over-year growth 2024-2029 (%)
      • 13.10 Japan - Market size and forecast 2024-2029
        • Chart on Japan - Market size and forecast 2024-2029 ($ million)
        • Data Table on Japan - Market size and forecast 2024-2029 ($ million)
        • Chart on Japan - Year-over-year growth 2024-2029 (%)
        • Data Table on Japan - Year-over-year growth 2024-2029 (%)
      • 13.11 Germany - Market size and forecast 2024-2029
        • Chart on Germany - Market size and forecast 2024-2029 ($ million)
        • Data Table on Germany - Market size and forecast 2024-2029 ($ million)
        • Chart on Germany - Year-over-year growth 2024-2029 (%)
        • Data Table on Germany - Year-over-year growth 2024-2029 (%)
      • 13.12 India - Market size and forecast 2024-2029
        • Chart on India - Market size and forecast 2024-2029 ($ million)
        • Data Table on India - Market size and forecast 2024-2029 ($ million)
        • Chart on India - Year-over-year growth 2024-2029 (%)
        • Data Table on India - Year-over-year growth 2024-2029 (%)
      • 13.13 South Korea - Market size and forecast 2024-2029
        • Chart on South Korea - Market size and forecast 2024-2029 ($ million)
        • Data Table on South Korea - Market size and forecast 2024-2029 ($ million)
        • Chart on South Korea - Year-over-year growth 2024-2029 (%)
        • Data Table on South Korea - Year-over-year growth 2024-2029 (%)
      • 13.14 Brazil - Market size and forecast 2024-2029
        • Chart on Brazil - Market size and forecast 2024-2029 ($ million)
        • Data Table on Brazil - Market size and forecast 2024-2029 ($ million)
        • Chart on Brazil - Year-over-year growth 2024-2029 (%)
        • Data Table on Brazil - Year-over-year growth 2024-2029 (%)
      • 13.15 UK - Market size and forecast 2024-2029
        • Chart on UK - Market size and forecast 2024-2029 ($ million)
        • Data Table on UK - Market size and forecast 2024-2029 ($ million)
        • Chart on UK - Year-over-year growth 2024-2029 (%)
        • Data Table on UK - Year-over-year growth 2024-2029 (%)
      • 13.16 France - Market size and forecast 2024-2029
        • Chart on France - Market size and forecast 2024-2029 ($ million)
        • Data Table on France - Market size and forecast 2024-2029 ($ million)
        • Chart on France - Year-over-year growth 2024-2029 (%)
        • Data Table on France - Year-over-year growth 2024-2029 (%)
      • 13.17 Italy - Market size and forecast 2024-2029
        • Chart on Italy - Market size and forecast 2024-2029 ($ million)
        • Data Table on Italy - Market size and forecast 2024-2029 ($ million)
        • Chart on Italy - Year-over-year growth 2024-2029 (%)
        • Data Table on Italy - Year-over-year growth 2024-2029 (%)
      • 13.18 Market opportunity by geography
        • Market opportunity by geography ($ million)
        • Data Tables on Market opportunity by geography ($ million)
      • 13.19 Rest of World (ROW) - Market size and forecast (2024-2029)
        • Chart on Rest of World (ROW) - Market size and forecast (2024-2029) ($ million)
        • Data Table on Rest of World (ROW) - Market size and forecast (2024-2029) ($ million)
        • Chart on Rest of World (ROW) - Year-over-year growth (2024-2029) (%)
        • Data Table on Rest of World (ROW) - Year-over-year growth (2024-2029) (%)

      14 Drivers, Challenges, and Opportunity/Restraints

      • 14.1 Market drivers
        • 14.2 Market challenges
          • 14.3 Impact of drivers and challenges
            • Impact of drivers and challenges in 2024 and 2029
          • 14.4 Market opportunities/restraints

            15 Competitive Landscape

            • 15.1 Overview
              • 15.2 Competitive Landscape
                • Overview on criticality of inputs and factors of differentiation
              • 15.3 Landscape disruption
                • Overview on factors of disruption
              • 15.4 Industry risks
                • Impact of key risks on business

              16 Competitive Analysis

              • 16.1 Companies profiled
                • Companies covered
              • 16.2 Company ranking index
                • Company ranking index
              • 16.3 Market positioning of companies
                • Matrix on companies position and classification
              • 16.4 Acuity Brands Inc.
                • Acuity Brands Inc. - Overview
                • Acuity Brands Inc. - Business segments
                • Acuity Brands Inc. - Key offerings
                • Acuity Brands Inc. - Segment focus
                • SWOT
              • 16.5 ams OSRAM AG
                • ams OSRAM AG - Overview
                • ams OSRAM AG - Business segments
                • ams OSRAM AG - Key news
                • ams OSRAM AG - Key offerings
                • ams OSRAM AG - Segment focus
                • SWOT
              • 16.6 Bridgelux Inc.
                • Bridgelux Inc. - Overview
                • Bridgelux Inc. - Product / Service
                • Bridgelux Inc. - Key offerings
                • SWOT
              • 16.7 Dialight PLC
                • Dialight PLC - Overview
                • Dialight PLC - Business segments
                • Dialight PLC - Key news
                • Dialight PLC - Key offerings
                • Dialight PLC - Segment focus
                • SWOT
              • 16.8 Eaton Corp. plc
                • Eaton Corp. plc - Overview
                • Eaton Corp. plc - Business segments
                • Eaton Corp. plc - Key news
                • Eaton Corp. plc - Key offerings
                • Eaton Corp. plc - Segment focus
                • SWOT
              • 16.9 Ennostar Inc.
                • Ennostar Inc. - Overview
                • Ennostar Inc. - Business segments
                • Ennostar Inc. - Key news
                • Ennostar Inc. - Key offerings
                • Ennostar Inc. - Segment focus
                • SWOT
              • 16.10 EVERLIGHT ELECTRONICS CO. LTD.
                • EVERLIGHT ELECTRONICS CO. LTD. - Overview
                • EVERLIGHT ELECTRONICS CO. LTD. - Product / Service
                • EVERLIGHT ELECTRONICS CO. LTD. - Key offerings
                • SWOT
              • 16.11 General Electric Co.
                • General Electric Co. - Overview
                • General Electric Co. - Business segments
                • General Electric Co. - Key news
                • General Electric Co. - Key offerings
                • General Electric Co. - Segment focus
                • SWOT
              • 16.12 Havells India Ltd.
                • Havells India Ltd. - Overview
                • Havells India Ltd. - Business segments
                • Havells India Ltd. - Key news
                • Havells India Ltd. - Key offerings
                • Havells India Ltd. - Segment focus
                • SWOT
              • 16.13 LITE ON Technology Corp.
                • LITE ON Technology Corp. - Overview
                • LITE ON Technology Corp. - Business segments
                • LITE ON Technology Corp. - Key news
                • LITE ON Technology Corp. - Key offerings
                • LITE ON Technology Corp. - Segment focus
                • SWOT
              • 16.14 Lumileds Holding BV
                • Lumileds Holding BV - Overview
                • Lumileds Holding BV - Product / Service
                • Lumileds Holding BV - Key offerings
                • SWOT
              • 16.15 Nichia Corp.
                • Nichia Corp. - Overview
                • Nichia Corp. - Product / Service
                • Nichia Corp. - Key news
                • Nichia Corp. - Key offerings
                • SWOT
              • 16.16 Samsung Electronics Co. Ltd.
                • Samsung Electronics Co. Ltd. - Overview
                • Samsung Electronics Co. Ltd. - Business segments
                • Samsung Electronics Co. Ltd. - Key news
                • Samsung Electronics Co. Ltd. - Key offerings
                • Samsung Electronics Co. Ltd. - Segment focus
                • SWOT
              • 16.17 Seoul Semiconductor Co. Ltd.
                • Seoul Semiconductor Co. Ltd. - Overview
                • Seoul Semiconductor Co. Ltd. - Product / Service
                • Seoul Semiconductor Co. Ltd. - Key offerings
                • SWOT
              • 16.18 Sharp Corp.
                • Sharp Corp. - Overview
                • Sharp Corp. - Business segments
                • Sharp Corp. - Key news
                • Sharp Corp. - Key offerings
                • Sharp Corp. - Segment focus
                • SWOT

              17 Appendix

              • 17.1 Scope of the report
                • 17.2 Inclusions and exclusions checklist
                  • Inclusions checklist
                  • Exclusions checklist
                • 17.3 Currency conversion rates for US$
                  • Currency conversion rates for US$
                • 17.4 Research methodology
                  • Research methodology
                • 17.5 Data procurement
                  • Information sources
                • 17.6 Data validation
                  • Data validation
                • 17.7 Validation techniques employed for market sizing
                  • Validation techniques employed for market sizing
                • 17.8 Data synthesis
                  • Data synthesis
                • 17.9 360 degree market analysis
                  • 360 degree market analysis
                • 17.10 List of abbreviations
                  • List of abbreviations

                Research Methodology

                Technavio presents a detailed picture of the market by way of study, synthesis, and summation of data from multiple sources. The analysts have presented the various facets of the market with a particular focus on identifying the key industry influencers. The data thus presented is comprehensive, reliable, and the result of extensive research, both primary and secondary.

                INFORMATION SOURCES

                Primary sources

                • Manufacturers and suppliers
                • Channel partners
                • Industry experts
                • Strategic decision makers

                Secondary sources

                • Industry journals and periodicals
                • Government data
                • Financial reports of key industry players
                • Historical data
                • Press releases

                DATA ANALYSIS

                Data Synthesis

                • Collation of data
                • Estimation of key figures
                • Analysis of derived insights

                Data Validation

                • Triangulation with data models
                • Reference against proprietary databases
                • Corroboration with industry experts

                REPORT WRITING

                Qualitative

                • Market drivers
                • Market challenges
                • Market trends
                • Five forces analysis

                Quantitative

                • Market size and forecast
                • Market segmentation
                • Geographical insights
                • Competitive landscape

                Interested in this report?

                Get your sample now to see our research methodology and insights!

                Download Now

                Frequently Asked Questions

                Light-Emitting Diode (Led) market growth will increase by $ 264.1 mn during 2025-2029 .

                The Light-Emitting Diode (Led) market is expected to grow at a CAGR of 19.2% during 2025-2029 .

                Light-Emitting Diode (Led) market is segmented by Product( Luminaires, Lamps) Application( General lighting, Automotive lighting, Backlight, Others, MEA) Distribution Channel( Offline, Online, North America, South America, Middle East and Africa)

                Acuity Brands Inc., ams OSRAM AG, Bridgelux Inc., Dialight PLC, Eaton Corp. plc, Ennostar Inc., EVERLIGHT ELECTRONICS CO. LTD., General Electric Co., GrowRay Lighting Technologies, Havells India Ltd., LITE ON Technology Corp., Lumileds Holding BV, Nichia Corp., Samsung Electronics Co. Ltd., Seoul Semiconductor Co. Ltd., Sharp Corp., Signify NV, SMART Global Holdings Inc., Toyoda Gosei Co. Ltd., Zumtobel Group AG are a few of the key vendors in the Light-Emitting Diode (Led) market.

                APAC will register the highest growth rate of 54% among the other regions. Therefore, the Light-Emitting Diode (Led) market in APAC is expected to garner significant business opportunities for the vendors during the forecast period.

                China, US, Japan, India, Germany, South Korea, Brazil, UK, Italy, France

                • Growing adoption of energy-efficient lighting technologiesThe increase in demand for lighting has resulted in a rising demand for electricity. As lighting consumes about 20% of global electricity production is the driving factor this market.
                • governments of many countries are focusing on promoting energy-efficient lighting technologies. In some countries is the driving factor this market.
                • governments have banned the use of incandescent bulbs. This is the driving factor this market.
                • in turn is the driving factor this market.
                • is expected to result in the high adoption of other energy-efficient lighting technologies is the driving factor this market.
                • including halogen is the driving factor this market.
                • CFL is the driving factor this market.
                • LFL is the driving factor this market.
                • and LED.In addition is the driving factor this market.
                • growing awareness about power and energy conservation has triggered the adoption of energy-efficient lighting technologies is the driving factor this market.
                • particularly LEDs is the driving factor this market.
                • which consume at least 75% less energy than traditional incandescent bulbs and can last 25 times longer. Similarly is the driving factor this market.
                • LEDs consume 50% less energy than CFL and can last up to four times longer. Manufacturers of lighting products have started focusing on energy-efficient and environment-friendly lighting solutions because of increasing awareness of green technology and decreasing the price of LEDs. This is expected to have a positive impact on the growth of the global light-emitting diode (LED) market during the forecast period.In addition is the driving factor this market.
                • intelligent lighting is increasingly gaining acceptance as it is considered an energy-efficient lighting alternative is the driving factor this market.
                • where the lighting technology has automated or mechanical capabilities is the driving factor this market.
                • unlike traditional or stationary lighting sources. Intelligent lighting includes programmed software that automates the intensity and duration of lighting is the driving factor this market.
                • thus delivering energy and cost benefits to users. The lighting is controlled with the use of various sensors to allow the lamps to operate whenever they are needed. These sensors detect the presence of human motion is the driving factor this market.
                • timing is the driving factor this market.
                • and occupancy. Based on the output of the sensor is the driving factor this market.
                • the lamps switch to ON and OFF modes. With the growth of the wireless communication infrastructure worldwide is the driving factor this market.
                • intelligent lighting products are gaining increased traction among several applications is the driving factor this market.
                • including in residential is the driving factor this market.
                • outdoor is the driving factor this market.
                • and architectural lighting. LEDs are preferred in intelligent lighting solutions.Several energy-efficiency programs have been introduced by governments globally to encourage the widespread adoption of energy-efficient lighting products to save energy and reduce the carbon footprint. Some such energy certification programs are ENERGY STAR certification is the driving factor this market.
                • DLC is the driving factor this market.
                • and Lighting Design Lab certification. In 1992 is the driving factor this market.
                • the US Environmental Protection Agency established the ENERGY STAR program to promote the use of energy-efficient lighting solutions in buildings is the driving factor this market.
                • homes is the driving factor this market.
                • and industries. The increase in government regulations in the country related to energy-efficient lighting solutions has led to the high adoption of ENERGY STAR-certified products. The certification defines specific guidelines for lighting products in terms of color quality is the driving factor this market.
                • lifespan is the driving factor this market.
                • energy efficiency is the driving factor this market.
                • and optical output to acquire the ENERGY STAR-certified label. In the US is the driving factor this market.
                • the ENERGY STAR label is also shown on the EnergyGuide labels for qualifying products into the energy-saving category. ENERGY STAR-certified LED products consume 75% less energy than incandescent light bulbs. Considering such advantages is the driving factor this market.
                • the use of LEDs will overtake that of traditional lighting technologies in all application sectors during the forecast period. This will drive the growth of the global light-emitting diode (LED) market during the forecast period. is the driving factor this market.

                The Light-Emitting Diode (Led) market vendors should focus on grabbing business opportunities from the Luminaires segment as it accounted for the largest market share in the base year.