LIDAR Systems Market for Wind Industry Analysis, Size, and Forecast 2024-2028: North America (US and Mexico), Europe (France, Germany, Italy, Spain, and UK), Middle East and Africa (UAE), APAC (Australia, China, India, Japan, and South Korea), South America (Brazil), and Rest of World (ROW)

LIDAR Systems Market for Wind Industry Analysis, Size, and Forecast 2024-2028:
North America (US and Mexico), Europe (France, Germany, Italy, Spain, and UK), Middle East and Africa (UAE), APAC (Australia, China, India, Japan, and South Korea), South America (Brazil), and Rest of World (ROW)

Published: Jan 2024 172 Pages SKU: IRTNTR73212

Market Overview at a Glance

$203.43 Mn
Market Opportunity
12.35%
CAGR
11.87
YoY growth 2023-2024(%)

LIDAR Systems Market for Wind Industry Size 2024-2028

The lidar systems market for wind industry size is forecast to increase by USD 203.43 million at a CAGR of 12.35% between 2023 and 2028.

  • The LIDAR (Light Detection and Ranging) systems market for the wind industry is experiencing significant growth, driven by the increasing trend toward taller wind turbine hub heights and the expansion of offshore wind installations. The rise in hub heights necessitates more precise wind measurement for optimal energy production, making LIDAR systems an essential tool for wind farm operators. Additionally, the number of offshore wind installations is on the rise, as countries seek to reduce their carbon footprint and harness the vast potential of offshore wind resources. However, the high cost of implementing LIDAR systems remains a substantial challenge for market growth.
  • These systems can cost upwards of USD1 million per turbine, making affordability a critical consideration for wind farm developers and operators. Despite this hurdle, the market's strategic landscape offers ample opportunities for companies to capitalize on the growing demand for accurate wind measurement and data analysis. By focusing on cost reduction strategies, technological advancements, and partnerships, companies can effectively navigate this dynamic market and position themselves for long-term success.

What will be the Size of the LIDAR Systems Market for Wind Industry during the forecast period?

LIDAR Systems Market for Wind Industry Size

 Request Free Sample

  • The wind industry continues to witness dynamic market activities, with Lidar systems playing a pivotal role in optimizing wind energy production. Lidar technology enables real-time, accurate measurements of wind direction and speed, contributing to improved wind turbine performance. Offshore wind farms, with their unique challenges, are increasingly adopting Lidar for resource assessment and site selection. Object detection, aided by artificial intelligence (AI), is revolutionizing wind turbine inspections. AI-driven systems can identify anomalies in wind turbines, towers, and foundations, ensuring timely maintenance and reducing downtime. Lidar's integration with AI facilitates advanced capabilities like bird strike detection, ice detection, and blade fatigue analysis.
  • Turbulence measurement and wind direction measurement are essential for power output optimization. Lidar's 3D mapping and real-time data processing enable wind farm operators to make data-driven decisions, enhancing operational efficiency. Remote sensing and data analysis are integral to asset management and wind resource assessment, reducing costs through informed decision-making. Mobile Lidar and aerial Lidar expand the technology's reach, enabling environmental impact assessments and foundation stability evaluations. Wind shear and tower fatigue analysis are also possible with Lidar, ensuring the longevity of wind energy infrastructure. Machine learning (ML) and computer vision are the latest additions to Lidar's capabilities, offering advanced capabilities for blade inspection and wake effect analysis.
  • The ongoing evolution of Lidar technology underscores its importance in the wind energy sector, driving innovation and cost reduction in the renewable energy landscape.

How is this LIDAR Systems for Wind Industry Industry segmented?

The lidar systems for wind industry industry research report provides comprehensive data (region-wise segment analysis), with forecasts and estimates in "USD million" for the period 2024-2028, as well as historical data from 2018-2022 for the following segments.

  • Product
    • Ground mounted LIDAR systems
    • Nacelle mounted LIDAR systems
  • Component
    • Laser
    • Scanner
    • Navigation system
    • Others
  • End-User
    • Wind Farm Operators
    • Energy Companies
    • Research Institutions
  • Application
    • Wind Farm Planning
    • Turbine Optimization
    • Wind Resource Assessment
  • Geography
    • North America
      • US
      • Mexico
    • Europe
      • France
      • Germany
      • Italy
      • Spain
      • UK
    • Middle East and Africa
      • UAE
    • APAC
      • Australia
      • China
      • India
      • Japan
      • South Korea
    • South America
      • Brazil
    • Rest of World (ROW)

By Product Insights

The ground mounted lidar systems segment is estimated to witness significant growth during the forecast period.

The wind energy sector is witnessing significant advancements with the integration of LIDAR technology. Ground mounted LIDAR systems are gaining popularity due to their effectiveness in onshore wind farms. These systems offer enhanced wind turbine performance by providing accurate wind measurements up to the tip height of wind turbines. Compared to met masts and nacelle mounted LIDAR systems, ground mounted LIDAR systems are easier to deploy and offer increased efficiency. Their portability allows for multiple turbine location surveys with a single deployment. According to ZephIR Lidar, these systems can increase the value of onshore projects by USD408,288 by delivering more Annual Energy Production (AEP) than met masts.

Offshore wind farms also benefit from LIDAR technology, with mobile LIDAR systems enabling accurate wind resource assessment and reducing the need for costly and time-consuming site visits. Object detection and ice detection are crucial applications of LIDAR technology in wind energy. AI and machine learning algorithms enhance LIDAR data processing, enabling real-time data analysis and power output optimization. Remote sensing and 3D mapping enable wind farm developers to assess site conditions, foundation stability, and identify potential hazards such as scour and wake effect analysis. LIDAR systems are also used for wind turbine blade inspection, tower inspection, and environmental impact assessment.

The integration of LIDAR technology in wind energy is expected to lead to cost reduction and improved operational efficiency. Moreover, LIDAR technology is essential for wind direction measurement, wind speed measurement, and turbulence measurement, enabling wind farm operators to optimize power output and ensure the health of wind turbines. LIDAR systems also play a crucial role in wind resource assessment, providing accurate and reliable data for wind farm planning and development. In conclusion, LIDAR technology is revolutionizing the wind energy sector by providing accurate and reliable wind data, enabling power output optimization, reducing costs, and improving operational efficiency. From onshore wind farms to offshore wind farms, LIDAR systems are essential for wind resource assessment, turbine placement, and site assessment.

The integration of AI, machine learning, and computer vision further enhances the capabilities of LIDAR systems, making them an indispensable tool for the wind energy sector.

LIDAR Systems Market for Wind Industry Size

Request Free Sample

The Ground mounted LIDAR systems segment was valued at USD 105.63 million in 2018 and showed a gradual increase during the forecast period.

Regional Analysis

North America is estimated to contribute 37% to the growth of the global market during the forecast period.Technavio's analysts have elaborately explained the regional trends and drivers that shape the market during the forecast period.

LIDAR Systems Market for Wind Industry Share by Geography

 Request Free Sample

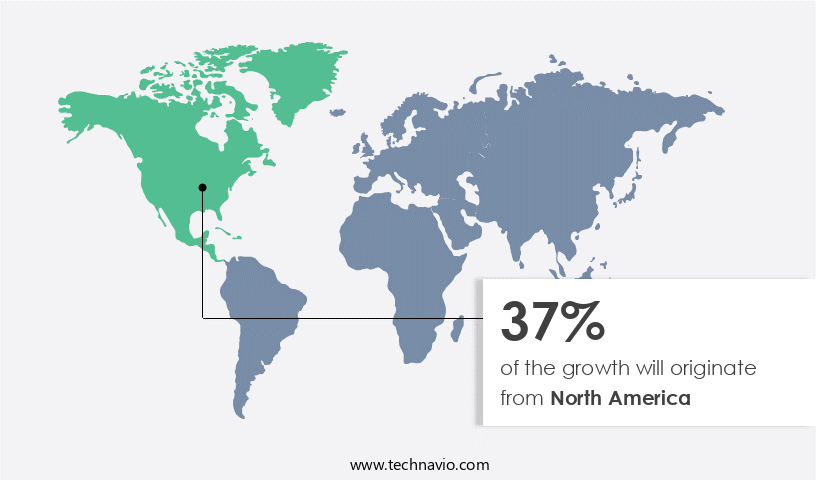
The wind industry in North America is witnessing significant growth, with a steady increase in the adoption of LIDAR systems. The US, in particular, is expected to see a surge in wind energy installations, both onshore and offshore. Offshore wind farms are becoming increasingly popular, with the US aiming to install up to 30 GW of offshore wind capacity by 2030. LIDAR systems play a crucial role in wind resource assessment, measurement of wind direction and speed, and turbulence analysis. These systems enable power output optimization and 3D mapping of wind farms, ensuring operational efficiency. Moreover, LIDAR systems are essential for asset management and maintenance, including tower inspection, blade inspection, and ice detection.

Object detection using deep learning algorithms and computer vision technology is also gaining popularity in the wind industry. LIDAR systems are used for real-time data acquisition and analysis, enabling the measurement of wind shear, wind direction, and wind speed. This data is critical for wind farm planning, turbine placement, and foundation stability assessment. The use of LIDAR systems is not limited to wind energy production but also extends to environmental impact assessment and cost reduction. Mobile LIDAR systems and aerial LIDAR are increasingly being used for site assessment, wake effect analysis, scour detection, and foundation stability evaluation. Machine learning and artificial intelligence are being integrated into LIDAR systems to improve data processing and analysis, enabling more accurate predictions and better decision-making.

Overall, the wind industry's adoption of LIDAR systems is a critical trend driving the market's growth, ensuring the efficient and sustainable production of renewable energy.

Market Dynamics

Our researchers analyzed the data with 2023 as the base year, along with the key drivers, trends, and challenges. A holistic analysis of drivers will help companies refine their marketing strategies to gain a competitive advantage.

The Global LIDAR Systems Market for Wind Industry thrives with LIDAR for wind turbine optimization and nacelle-mounted LIDAR systems. LIDAR market trends wind industry emphasize floating LIDAR for offshore wind and LIDAR for wind resource assessment. LIDAR systems for wind farm planning and LIDAR for wind energy forecasting boost efficiency, per LIDAR market forecast wind. Doppler LIDAR for wind measurement enhances LIDAR for turbine performance, while LIDAR systems for renewable energy ensure precision. LIDAR for wind turbulence detection and LIDAR for wind farm maintenance improve reliability. LIDAR systems for coastal wind, high-resolution LIDAR for wind, and LIDAR for wind power optimization support LIDAR for sustainable energy. LIDAR systems for wind monitoring, advanced LIDAR for wind analytics, LIDAR market supply chain wind, LIDAR for wind farm scalability, and LIDAR for wind energy integration drive growth through 2028.

What are the key market drivers leading to the rise in the adoption of LIDAR Systems for Wind Industry Industry?

  • The height increase of tower hubs serves as the primary catalyst for market growth. 
  • Wind energy generation relies heavily on meteorological conditions, making accurate wind assessment essential for optimizing wind turbine performance. LIDAR (Light Detection and Ranging) systems play a crucial role in this process by providing real-time, three-dimensional data on wind speed, direction, and turbulence. These insights enable wind farm operators to maximize energy production and minimize downtime. Offshore wind farms, which are increasingly popular due to their high potential for generating large amounts of renewable energy, pose unique challenges for wind assessment. LIDAR systems are particularly valuable in these environments, as they can detect objects such as birds and ice, which are more prevalent offshore and can cause significant damage to wind turbines.
  • Advancements in artificial intelligence (AI) and remote sensing technologies have enhanced the capabilities of LIDAR systems, allowing for more sophisticated object detection and analysis. For instance, AI algorithms can be used to identify and classify different types of birds, enabling wind farm operators to take appropriate measures to minimize the risk of bird strikes. Similarly, AI can be employed for ice detection, enabling preventative maintenance and reducing the likelihood of costly repairs. The global LIDAR systems market for the wind industry is poised for significant growth, driven by the increasing adoption of wind energy and the need for more efficient and accurate wind assessment.
  • The integration of AI and other advanced technologies into LIDAR systems is expected to further fuel market growth, as these innovations enable more precise and real-time data analysis, ultimately leading to improved wind turbine performance and increased renewable energy generation.

What are the market trends shaping the LIDAR Systems for Wind Industry Industry?

  • The trend in the renewable energy sector is evident in the rising number of offshore wind installations. This growth represents a significant market development in the global energy landscape.
  • Onshore wind energy continues to dominate the global wind industry, with a larger installed capacity compared to offshore wind farms. However, there is a growing trend towards the development of offshore wind farms due to their potential to generate higher wind speeds and power output. LIDAR (Light Detection and Ranging) systems play a crucial role in optimizing wind energy production in both onshore and offshore wind farms. LIDAR technology is used for wind direction measurement and wind speed measurement, enabling turbine placement in areas with optimal wind conditions. The technology creates a point cloud of data, which is then analyzed to provide accurate and real-time wind data.
  • This data is essential for power output optimization and 3D mapping of wind patterns. Moreover, LIDAR systems help in blade fatigue analysis by measuring wind loads on wind turbine blades. Deep learning algorithms are used to analyze the data, providing insights into wind patterns and turbine performance. This information is crucial for maintenance planning and reducing downtime. Despite the challenges associated with offshore wind farm installation and maintenance, countries such as the US, China, Japan, South Korea, and India are investing in these projects. Encouraging competition and deploying large turbines can provide cost savings, while handling supply chain challenges and increasing the number of turbine installations can increase wind power capacity.
  • LIDAR systems will continue to play a vital role in optimizing wind energy production in both onshore and offshore wind farms.

What challenges does the LIDAR Systems for Wind Industry Industry face during its growth?

  • The high implementation cost of LIDAR systems poses a significant challenge to the industry's growth trajectory. This expense, a key concern for stakeholders, may hinder the industry's advancement. 
  • Offshore wind farms represent significant investments in the renewable energy sector, with costs escalating due to the unique challenges posed by marine environments. The seabed and water conditions dictate the size of wind turbines and the type of foundation necessary for installation, impacting the capital expenditure (CAPEX) of offshore wind projects. Other contributing factors include the length of electrical interconnection cables and the need for robust infrastructure to withstand harsh weather conditions. Mobile Lidar technology plays a pivotal role in wind resource assessment, enabling accurate measurement of wind speeds and direction at different heights and locations.
  • This data is crucial for optimizing wind farm design and site selection. Aerial Lidar systems offer flexibility in data acquisition, enabling assessments of large areas and complex terrain. Furthermore, cloud-based platforms and advanced image processing techniques facilitate data analysis, including wake effect analysis and foundation stability assessments. Cost reduction is a primary focus in the wind industry, and Lidar technology contributes to this goal by streamlining site assessment processes, reducing the need for meteorological masts, and minimizing the time and resources required for environmental impact assessments. In conclusion, the integration of Lidar technology in offshore wind farm development offers numerous benefits, from improved site selection and design to cost savings and enhanced operational efficiency.

Exclusive Customer Landscape

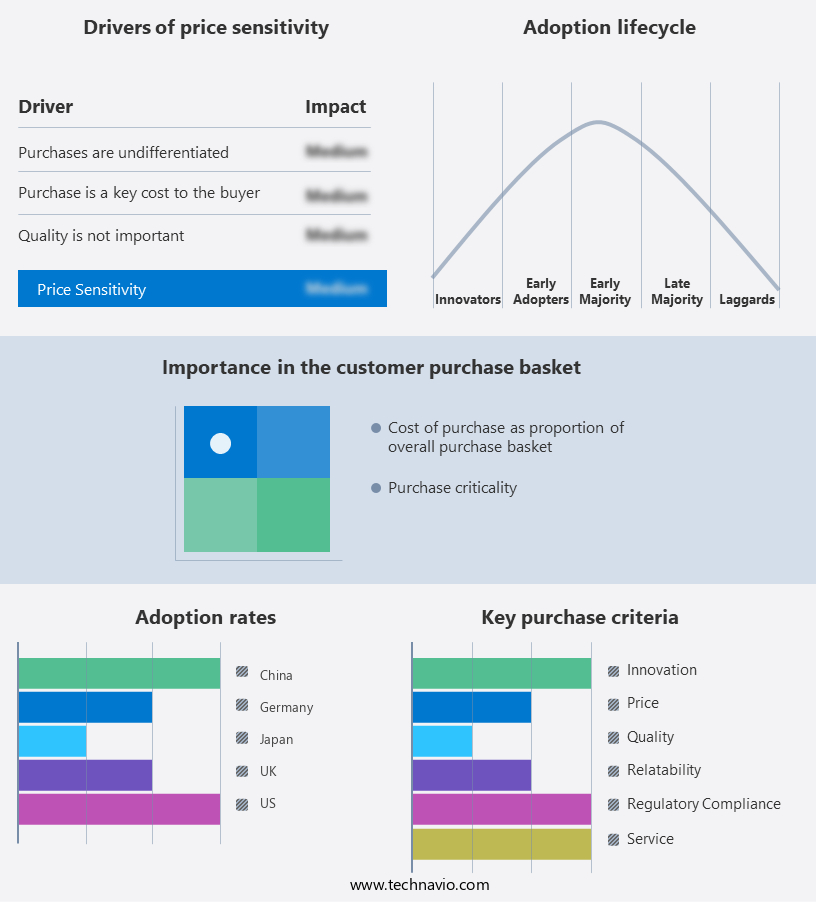
The lidar systems market for wind industry forecasting report includes the adoption lifecycle of the market, covering from the innovator's stage to the laggard's stage. It focuses on adoption rates in different regions based on penetration. Furthermore, the lidar systems market for wind industry report also includes key purchase criteria and drivers of price sensitivity to help companies evaluate and develop their market growth analysis strategies.

LIDAR Systems Market for Wind Industry Share by Geography

 Customer Landscape

Key Companies & Market Insights

Companies are implementing various strategies, such as strategic alliances, lidar systems market for wind industry forecast, partnerships, mergers and acquisitions, geographical expansion, and product/service launches, to enhance their presence in the industry.

Vaisala - The company specializes in LIDAR system applications, catering to industries including automotive, aerospace and defense, security and surveillance, and more. The advanced LIDAR technology enables accurate distance measurement and 3D mapping, enhancing safety, efficiency, and situational awareness. By integrating LIDAR systems into various applications, we contribute to innovation and progress in sectors such as autonomous vehicles, airborne LiDAR mapping, and intrusion detection systems. Our commitment to research and development ensures the delivery of cutting-edge solutions that meet the evolving needs of our clients.

The industry research and growth report includes detailed analyses of the competitive landscape of the market and information about key companies, including:

  • Vaisala
  • Leosphere (Vaisala)
  • ZephIR Lidar
  • Windar Photonics
  • NRG Systems
  • METEK GmbH
  • ZX Lidars
  • Deutsche WindGuard
  • Mitsubishi Electric
  • Lockheed Martin
  • QinetiQ
  • Raymetrics
  • Everise Technology
  • SGURR Energy
  • RENEW Energy Systems
  • GWU-Umwelttechnik
  • HALO Photonics
  • MOVELASER
  • Nortek AS
  • Ammonit Measurement

Qualitative and quantitative analysis of companies has been conducted to help clients understand the wider business environment as well as the strengths and weaknesses of key industry players. Data is qualitatively analyzed to categorize companies as pure play, category-focused, industry-focused, and diversified; it is quantitatively analyzed to categorize companies as dominant, leading, strong, tentative, and weak.

Recent Development and News in LIDAR Systems Market For Wind Industry

  • In February 2023, Siemens Gamesa Renewable Energy and LeddarTech announced a strategic collaboration to integrate LeddarTech's LIDAR technology into Siemens Gamesa's wind turbines. This partnership aims to enhance wind farm efficiency and productivity by providing real-time data on wind conditions, thereby optimizing energy production (Siemens Gamesa Renewable Energy press release, 2023).
  • In November 2022, First Solar, a leading solar energy company, acquired Terra-Gen, a wind and solar power developer, for approximately USD1.1 billion. This acquisition marks First Solar's entry into the wind energy sector and expands its renewable energy portfolio (Bloomberg, 2022).
  • In July 2021, Vestas, the world's largest wind turbine manufacturer, launched its new LIDAR system, the Vestas Wind Lidar 150. This system provides higher resolution wind data and is designed to reduce the cost of wind energy by optimizing wind farm performance (Vestas press release, 2021).
  • In April 2020, the European Union approved the European Commission's Innovation Fund, which includes a €1 billion allocation for wind energy projects. This funding is expected to boost the adoption of advanced wind energy technologies, including LIDAR systems, and contribute to the EU's green energy goals (European Commission press release, 2020).

Research Analyst Overview

The wind industry's Lidar systems market is experiencing significant advancements, driven by the integration of deep learning models and wake modeling for optimizing wind farm performance. Safety protocols are being reinforced through remote inspection and tower integrity assessment, enabling cost optimization and regulatory compliance. O&M optimization and asset performance management are key focus areas, with lifecycle management and edge computing playing essential roles. Efficiency gains are achieved through blade condition monitoring, digital twin technology, and data acquisition systems. Risk assessment and remote operation are facilitated by machine vision and smart sensors, enabling automated data collection and autonomous operation. Predictive analytics and wind farm optimization are crucial for environmental permitting and data visualization tools, while data processing software and cloud computing enable the handling of vast point cloud data.

Lidar scan data is analyzed through data analytics platforms for foundation monitoring and health monitoring, ensuring optimal wind turbine design and regulatory compliance.

Dive into Technavio's robust research methodology, blending expert interviews, extensive data synthesis, and validated models for unparalleled LIDAR Systems Market for Wind Industry insights. See full methodology.

Market Scope

Report Coverage

Details

Page number

172

Base year

2023

Historic period

2018-2022

Forecast period

2024-2028

Growth momentum & CAGR

Accelerate at a CAGR of 12.35%

Market growth 2024-2028

USD 203.43 million

Market structure

Fragmented

YoY growth 2023-2024(%)

11.87

Key countries

US, China, Japan, Germany, UKa US, China, Germany, Japan, UK, Australia, India, France, Brazil, UAE, Rest of World (ROW), Saudi Arabia, France, South Korea, Mexico, Italy, and Spain

Competitive landscape

Leading Companies, Market Positioning of Companies, Competitive Strategies, and Industry Risks

Request Free Sample

What are the Key Data Covered in this LIDAR Systems Market for Wind Industry Research and Growth Report?

  • CAGR of the LIDAR Systems for Wind Industry industry during the forecast period
  • Detailed information on factors that will drive the growth and forecasting between 2024 and 2028
  • Precise estimation of the size of the market and its contribution of the industry in focus to the parent market
  • Accurate predictions about upcoming growth and trends and changes in consumer behaviour
  • Growth of the market across North America, Europe, APAC, Middle East and Africa, and South America
  • Thorough analysis of the market's competitive landscape and detailed information about companies
  • Comprehensive analysis of factors that will challenge the lidar systems market for wind industry growth of industry companies

We can help! Our analysts can customize this lidar systems market for wind industry research report to meet your requirements.

Get in touch

1 Executive Summary

  • 1.1 Market overview
    • Exhibit 01: Executive Summary – Chart on Market Overview
    • Exhibit 02: Executive Summary – Data Table on Market Overview
    • Exhibit 03: Executive Summary – Chart on Global Market Characteristics
    • Exhibit 04: Executive Summary – Chart on Market by Geography
    • Exhibit 05: Executive Summary – Chart on Market Segmentation by Product
    • Exhibit 06: Executive Summary – Chart on Market Segmentation by Component
    • Exhibit 07: Executive Summary – Chart on Incremental Growth
    • Exhibit 08: Executive Summary – Data Table on Incremental Growth
    • Exhibit 09: Executive Summary – Chart on Vendor Market Positioning

2 Market Landscape

  • 2.1 Market ecosystem
    • Exhibit 10: Parent market
    • Exhibit 11: Market Characteristics

3 Market Sizing

  • 3.1 Market definition
    • Exhibit 12: Offerings of vendors included in the market definition
  • 3.2 Market segment analysis
    • Exhibit 13: Market segments
  • 3.3 Market size 2023
    • 3.4 Market outlook: Forecast for 2023-2028
      • Exhibit 14: Chart on Global - Market size and forecast 2023-2028 ($ million)
      • Exhibit 15: Data Table on Global - Market size and forecast 2023-2028 ($ million)
      • Exhibit 16: Chart on Global Market: Year-over-year growth 2023-2028 (%)
      • Exhibit 17: Data Table on Global Market: Year-over-year growth 2023-2028 (%)

    4 Historic Market Size

    • 4.1 Global LIDAR systems market for wind industry 2018 - 2022
      • Exhibit 18: Historic Market Size – Data Table on global lidar systems market for wind industry 2018 - 2022 ($ million)
    • 4.2 Product Segment Analysis 2018 - 2022
      • Exhibit 19: Historic Market Size – Product Segment 2018 - 2022 ($ million)
    • 4.3 Component Segment Analysis 2018 - 2022
      • Exhibit 20: Historic Market Size – Component Segment 2018 - 2022 ($ million)
    • 4.4 Geography Segment Analysis 2018 - 2022
      • Exhibit 21: Historic Market Size – Geography Segment 2018 - 2022 ($ million)
    • 4.5 Country Segment Analysis 2018 - 2022
      • Exhibit 22: Historic Market Size – Country Segment 2018 - 2022 ($ million)

    5 Five Forces Analysis

    • 5.1 Five forces summary
      • Exhibit 23: Five forces analysis - Comparison between 2023 and 2028
    • 5.2 Bargaining power of buyers
      • Exhibit 24: Chart on Bargaining power of buyers – Impact of key factors 2023 and 2028
    • 5.3 Bargaining power of suppliers
      • Exhibit 25: Bargaining power of suppliers – Impact of key factors in 2023 and 2028
    • 5.4 Threat of new entrants
      • Exhibit 26: Threat of new entrants – Impact of key factors in 2023 and 2028
    • 5.5 Threat of substitutes
      • Exhibit 27: Threat of substitutes – Impact of key factors in 2023 and 2028
    • 5.6 Threat of rivalry
      • Exhibit 28: Threat of rivalry – Impact of key factors in 2023 and 2028
    • 5.7 Market condition
      • Exhibit 29: Chart on Market condition - Five forces 2023 and 2028

    6 Market Segmentation by Product

    • 6.1 Market segments
      • Chart on Product - Market share (2023-2028) (%)
      • Data Table on Product - Market share (2023-2028) (%)
    • 6.2 Comparison by Product
      • Chart on Comparison by Product
      • Data Table on Comparison by Product
    • 6.3 Ground mounted LIDAR systems - Market size and forecast (2023-2028)
      • Chart on Ground mounted LIDAR systems - Market size and forecast (2023-2028) ($ million)
      • Data Table on Ground mounted LIDAR systems - Market size and forecast (2023-2028) ($ million)
      • Chart on Ground mounted LIDAR systems - Year-over-year growth (2023-2028) (%)
      • Data Table on Ground mounted LIDAR systems - Year-over-year growth (2023-2028) (%)
    • 6.4 Nacelle mounted LIDAR systems - Market size and forecast (2023-2028)
      • Chart on Nacelle mounted LIDAR systems - Market size and forecast (2023-2028) ($ million)
      • Data Table on Nacelle mounted LIDAR systems - Market size and forecast (2023-2028) ($ million)
      • Chart on Nacelle mounted LIDAR systems - Year-over-year growth (2023-2028) (%)
      • Data Table on Nacelle mounted LIDAR systems - Year-over-year growth (2023-2028) (%)
    • 6.5 Market opportunity by Product
      • Market opportunity by Product ($ million)
      • Data Table on Market opportunity by Product ($ million)

    7 Market Segmentation by Component

    • 7.1 Market segments
      • Chart on Component - Market share (2023-2028) (%)
      • Data Table on Component - Market share (2023-2028) (%)
    • 7.2 Comparison by Component
      • Chart on Comparison by Component
      • Data Table on Comparison by Component
    • 7.3 Laser - Market size and forecast (2023-2028)
      • Chart on Laser - Market size and forecast (2023-2028) ($ million)
      • Data Table on Laser - Market size and forecast (2023-2028) ($ million)
      • Chart on Laser - Year-over-year growth (2023-2028) (%)
      • Data Table on Laser - Year-over-year growth (2023-2028) (%)
    • 7.4 Scanner - Market size and forecast (2023-2028)
      • Chart on Scanner - Market size and forecast (2023-2028) ($ million)
      • Data Table on Scanner - Market size and forecast (2023-2028) ($ million)
      • Chart on Scanner - Year-over-year growth (2023-2028) (%)
      • Data Table on Scanner - Year-over-year growth (2023-2028) (%)
    • 7.5 Navigation system - Market size and forecast (2023-2028)
      • Chart on Navigation system - Market size and forecast (2023-2028) ($ million)
      • Data Table on Navigation system - Market size and forecast (2023-2028) ($ million)
      • Chart on Navigation system - Year-over-year growth (2023-2028) (%)
      • Data Table on Navigation system - Year-over-year growth (2023-2028) (%)
    • 7.6 Others - Market size and forecast (2023-2028)
      • Chart on Others - Market size and forecast (2023-2028) ($ million)
      • Data Table on Others - Market size and forecast (2023-2028) ($ million)
      • Chart on Others - Year-over-year growth (2023-2028) (%)
      • Data Table on Others - Year-over-year growth (2023-2028) (%)
    • 7.7 Market opportunity by Component
      • Market opportunity by Component ($ million)
      • Data Table on Market opportunity by Component ($ million)

    8 Market Segmentation by End-User

    • 8.1 Market segments
      • Chart on End-User - Market share (2023-2028) (%)
      • Data Table on End-User - Market share (2023-2028) (%)
    • 8.2 Comparison by End-User
      • Chart on Comparison by End-User
      • Data Table on Comparison by End-User
    • 8.3 Wind Farm Operators - Market size and forecast (2023-2028)
      • Chart on Wind Farm Operators - Market size and forecast (2023-2028) ($ million)
      • Data Table on Wind Farm Operators - Market size and forecast (2023-2028) ($ million)
      • Chart on Wind Farm Operators - Year-over-year growth (2023-2028) (%)
      • Data Table on Wind Farm Operators - Year-over-year growth (2023-2028) (%)
    • 8.4 Energy Companies - Market size and forecast (2023-2028)
      • Chart on Energy Companies - Market size and forecast (2023-2028) ($ million)
      • Data Table on Energy Companies - Market size and forecast (2023-2028) ($ million)
      • Chart on Energy Companies - Year-over-year growth (2023-2028) (%)
      • Data Table on Energy Companies - Year-over-year growth (2023-2028) (%)
    • 8.5 Research Institutions - Market size and forecast (2023-2028)
      • Chart on Research Institutions - Market size and forecast (2023-2028) ($ million)
      • Data Table on Research Institutions - Market size and forecast (2023-2028) ($ million)
      • Chart on Research Institutions - Year-over-year growth (2023-2028) (%)
      • Data Table on Research Institutions - Year-over-year growth (2023-2028) (%)
    • 8.6 Market opportunity by End-User
      • Market opportunity by End-User ($ million)
      • Data Table on Market opportunity by End-User ($ million)

    9 Market Segmentation by Application

    • 9.1 Market segments
      • Chart on Application - Market share (2023-2028) (%)
      • Data Table on Application - Market share (2023-2028) (%)
    • 9.2 Comparison by Application
      • Chart on Comparison by Application
      • Data Table on Comparison by Application
    • 9.3 Wind Farm Planning - Market size and forecast (2023-2028)
      • Chart on Wind Farm Planning - Market size and forecast (2023-2028) ($ million)
      • Data Table on Wind Farm Planning - Market size and forecast (2023-2028) ($ million)
      • Chart on Wind Farm Planning - Year-over-year growth (2023-2028) (%)
      • Data Table on Wind Farm Planning - Year-over-year growth (2023-2028) (%)
    • 9.4 Turbine Optimization - Market size and forecast (2023-2028)
      • Chart on Turbine Optimization - Market size and forecast (2023-2028) ($ million)
      • Data Table on Turbine Optimization - Market size and forecast (2023-2028) ($ million)
      • Chart on Turbine Optimization - Year-over-year growth (2023-2028) (%)
      • Data Table on Turbine Optimization - Year-over-year growth (2023-2028) (%)
    • 9.5 Wind Resource Assessment - Market size and forecast (2023-2028)
      • Chart on Wind Resource Assessment - Market size and forecast (2023-2028) ($ million)
      • Data Table on Wind Resource Assessment - Market size and forecast (2023-2028) ($ million)
      • Chart on Wind Resource Assessment - Year-over-year growth (2023-2028) (%)
      • Data Table on Wind Resource Assessment - Year-over-year growth (2023-2028) (%)
    • 9.6 Market opportunity by Application
      • Market opportunity by Application ($ million)
      • Data Table on Market opportunity by Application ($ million)

    8 Customer Landscape

    • 8.1 Customer landscape overview
      • Exhibit 66: Analysis of price sensitivity, lifecycle, customer purchase basket, adoption rates, and purchase criteria

    9 Geographic Landscape

    • 9.1 Geographic segmentation
      • Exhibit 67: Chart on Market share by geography 2023-2028 (%)
      • Exhibit 68: Data Table on Market share by geography 2023-2028 (%)
    • 9.2 Geographic comparison
      • Exhibit 69: Chart on Geographic comparison
      • Exhibit 70: Data Table on Geographic comparison
    • 9.3 North America - Market size and forecast 2023-2028
      • Exhibit 71: Chart on North America - Market size and forecast 2023-2028 ($ million)
      • Exhibit 72: Data Table on North America - Market size and forecast 2023-2028 ($ million)
      • Exhibit 73: Chart on North America - Year-over-year growth 2023-2028 (%)
      • Exhibit 74: Data Table on North America - Year-over-year growth 2023-2028 (%)
    • 9.4 Europe - Market size and forecast 2023-2028
      • Exhibit 75: Chart on Europe - Market size and forecast 2023-2028 ($ million)
      • Exhibit 76: Data Table on Europe - Market size and forecast 2023-2028 ($ million)
      • Exhibit 77: Chart on Europe - Year-over-year growth 2023-2028 (%)
      • Exhibit 78: Data Table on Europe - Year-over-year growth 2023-2028 (%)
    • 9.5 APAC - Market size and forecast 2023-2028
      • Exhibit 79: Chart on APAC - Market size and forecast 2023-2028 ($ million)
      • Exhibit 80: Data Table on APAC - Market size and forecast 2023-2028 ($ million)
      • Exhibit 81: Chart on APAC - Year-over-year growth 2023-2028 (%)
      • Exhibit 82: Data Table on APAC - Year-over-year growth 2023-2028 (%)
    • 9.6 Middle East and Africa - Market size and forecast 2023-2028
      • Exhibit 83: Chart on Middle East and Africa - Market size and forecast 2023-2028 ($ million)
      • Exhibit 84: Data Table on Middle East and Africa - Market size and forecast 2023-2028 ($ million)
      • Exhibit 85: Chart on Middle East and Africa - Year-over-year growth 2023-2028 (%)
      • Exhibit 86: Data Table on Middle East and Africa - Year-over-year growth 2023-2028 (%)
    • 9.7 South America - Market size and forecast 2023-2028
      • Exhibit 87: Chart on South America - Market size and forecast 2023-2028 ($ million)
      • Exhibit 88: Data Table on South America - Market size and forecast 2023-2028 ($ million)
      • Exhibit 89: Chart on South America - Year-over-year growth 2023-2028 (%)
      • Exhibit 90: Data Table on South America - Year-over-year growth 2023-2028 (%)
    • 9.8 US - Market size and forecast 2023-2028
      • Exhibit 91: Chart on US - Market size and forecast 2023-2028 ($ million)
      • Exhibit 92: Data Table on US - Market size and forecast 2023-2028 ($ million)
      • Exhibit 93: Chart on US - Year-over-year growth 2023-2028 (%)
      • Exhibit 94: Data Table on US - Year-over-year growth 2023-2028 (%)
    • 9.9 China - Market size and forecast 2023-2028
      • Exhibit 95: Chart on China - Market size and forecast 2023-2028 ($ million)
      • Exhibit 96: Data Table on China - Market size and forecast 2023-2028 ($ million)
      • Exhibit 97: Chart on China - Year-over-year growth 2023-2028 (%)
      • Exhibit 98: Data Table on China - Year-over-year growth 2023-2028 (%)
    • 9.10 Germany - Market size and forecast 2023-2028
      • Exhibit 99: Chart on Germany - Market size and forecast 2023-2028 ($ million)
      • Exhibit 100: Data Table on Germany - Market size and forecast 2023-2028 ($ million)
      • Exhibit 101: Chart on Germany - Year-over-year growth 2023-2028 (%)
      • Exhibit 102: Data Table on Germany - Year-over-year growth 2023-2028 (%)
    • 9.11 UK - Market size and forecast 2023-2028
      • Exhibit 103: Chart on UK - Market size and forecast 2023-2028 ($ million)
      • Exhibit 104: Data Table on UK - Market size and forecast 2023-2028 ($ million)
      • Exhibit 105: Chart on UK - Year-over-year growth 2023-2028 (%)
      • Exhibit 106: Data Table on UK - Year-over-year growth 2023-2028 (%)
    • 9.12 Japan - Market size and forecast 2023-2028
      • Exhibit 107: Chart on Japan - Market size and forecast 2023-2028 ($ million)
      • Exhibit 108: Data Table on Japan - Market size and forecast 2023-2028 ($ million)
      • Exhibit 109: Chart on Japan - Year-over-year growth 2023-2028 (%)
      • Exhibit 110: Data Table on Japan - Year-over-year growth 2023-2028 (%)
    • 9.13 Market opportunity by geography
      • Exhibit 111: Market opportunity by geography ($ million)
      • Exhibit 112: Data Tables on Market opportunity by geography ($ million)
    • 11.14 UKa US - Market size and forecast (2023-2028)
      • Chart on UKa US - Market size and forecast (2023-2028) ($ million)
      • Data Table on UKa US - Market size and forecast (2023-2028) ($ million)
      • Chart on UKa US - Year-over-year growth (2023-2028) (%)
      • Data Table on UKa US - Year-over-year growth (2023-2028) (%)
    • 11.15 Australia - Market size and forecast (2023-2028)
      • Chart on Australia - Market size and forecast (2023-2028) ($ million)
      • Data Table on Australia - Market size and forecast (2023-2028) ($ million)
      • Chart on Australia - Year-over-year growth (2023-2028) (%)
      • Data Table on Australia - Year-over-year growth (2023-2028) (%)
    • 11.16 India - Market size and forecast (2023-2028)
      • Chart on India - Market size and forecast (2023-2028) ($ million)
      • Data Table on India - Market size and forecast (2023-2028) ($ million)
      • Chart on India - Year-over-year growth (2023-2028) (%)
      • Data Table on India - Year-over-year growth (2023-2028) (%)
    • 11.17 France - Market size and forecast (2023-2028)
      • Chart on France - Market size and forecast (2023-2028) ($ million)
      • Data Table on France - Market size and forecast (2023-2028) ($ million)
      • Chart on France - Year-over-year growth (2023-2028) (%)
      • Data Table on France - Year-over-year growth (2023-2028) (%)
    • 11.18 Brazil - Market size and forecast (2023-2028)
      • Chart on Brazil - Market size and forecast (2023-2028) ($ million)
      • Data Table on Brazil - Market size and forecast (2023-2028) ($ million)
      • Chart on Brazil - Year-over-year growth (2023-2028) (%)
      • Data Table on Brazil - Year-over-year growth (2023-2028) (%)
    • 11.19 UAE - Market size and forecast (2023-2028)
      • Chart on UAE - Market size and forecast (2023-2028) ($ million)
      • Data Table on UAE - Market size and forecast (2023-2028) ($ million)
      • Chart on UAE - Year-over-year growth (2023-2028) (%)
      • Data Table on UAE - Year-over-year growth (2023-2028) (%)
    • 11.20 Rest of World (ROW) - Market size and forecast (2023-2028)
      • Chart on Rest of World (ROW) - Market size and forecast (2023-2028) ($ million)
      • Data Table on Rest of World (ROW) - Market size and forecast (2023-2028) ($ million)
      • Chart on Rest of World (ROW) - Year-over-year growth (2023-2028) (%)
      • Data Table on Rest of World (ROW) - Year-over-year growth (2023-2028) (%)
    • 11.21 Saudi Arabia - Market size and forecast (2023-2028)
      • Chart on Saudi Arabia - Market size and forecast (2023-2028) ($ million)
      • Data Table on Saudi Arabia - Market size and forecast (2023-2028) ($ million)
      • Chart on Saudi Arabia - Year-over-year growth (2023-2028) (%)
      • Data Table on Saudi Arabia - Year-over-year growth (2023-2028) (%)
    • 11.22 South Korea - Market size and forecast (2023-2028)
      • Chart on South Korea - Market size and forecast (2023-2028) ($ million)
      • Data Table on South Korea - Market size and forecast (2023-2028) ($ million)
      • Chart on South Korea - Year-over-year growth (2023-2028) (%)
      • Data Table on South Korea - Year-over-year growth (2023-2028) (%)
    • 11.23 Mexico - Market size and forecast (2023-2028)
      • Chart on Mexico - Market size and forecast (2023-2028) ($ million)
      • Data Table on Mexico - Market size and forecast (2023-2028) ($ million)
      • Chart on Mexico - Year-over-year growth (2023-2028) (%)
      • Data Table on Mexico - Year-over-year growth (2023-2028) (%)
    • 11.24 Italy - Market size and forecast (2023-2028)
      • Chart on Italy - Market size and forecast (2023-2028) ($ million)
      • Data Table on Italy - Market size and forecast (2023-2028) ($ million)
      • Chart on Italy - Year-over-year growth (2023-2028) (%)
      • Data Table on Italy - Year-over-year growth (2023-2028) (%)
    • 11.25 Spain - Market size and forecast (2023-2028)
      • Chart on Spain - Market size and forecast (2023-2028) ($ million)
      • Data Table on Spain - Market size and forecast (2023-2028) ($ million)
      • Chart on Spain - Year-over-year growth (2023-2028) (%)
      • Data Table on Spain - Year-over-year growth (2023-2028) (%)

    10 Drivers, Challenges, and Trends

    • 10.1 Market drivers
      • 10.2 Market challenges
        • 10.3 Impact of drivers and challenges
          • Exhibit 113: Impact of drivers and challenges in 2023 and 2028
        • 10.4 Market trends

          11 Vendor Landscape

          • 11.1 Overview
            • 11.2 Vendor landscape
              • Exhibit 114: Overview on Criticality of inputs and Factors of differentiation
            • 11.3 Landscape disruption
              • Exhibit 115: Overview on factors of disruption
            • 11.4 Industry risks
              • Exhibit 116: Impact of key risks on business

            14 Competitive Analysis

            • 14.1 Companies profiled
              • Companies covered
            • 14.2 Market positioning of companies
              • Matrix on companies position and classification
            • 14.3 Vaisala
              • Vaisala - Overview
              • Vaisala - Product / Service
              • Vaisala - Key offerings
            • 14.4 Leosphere (Vaisala)
              • Leosphere (Vaisala) - Overview
              • Leosphere (Vaisala) - Product / Service
              • Leosphere (Vaisala) - Key offerings
            • 14.5 ZephIR Lidar
              • ZephIR Lidar - Overview
              • ZephIR Lidar - Product / Service
              • ZephIR Lidar - Key offerings
            • 14.6 Windar Photonics
              • Windar Photonics - Overview
              • Windar Photonics - Product / Service
              • Windar Photonics - Key offerings
            • 14.7 NRG Systems
              • NRG Systems - Overview
              • NRG Systems - Product / Service
              • NRG Systems - Key offerings
            • 14.8 METEK GmbH
              • METEK GmbH - Overview
              • METEK GmbH - Product / Service
              • METEK GmbH - Key offerings
            • 14.9 ZX Lidars
              • ZX Lidars - Overview
              • ZX Lidars - Product / Service
              • ZX Lidars - Key offerings
            • 14.10 Deutsche WindGuard
              • Deutsche WindGuard - Overview
              • Deutsche WindGuard - Product / Service
              • Deutsche WindGuard - Key offerings
            • 14.11 Mitsubishi Electric
              • Mitsubishi Electric - Overview
              • Mitsubishi Electric - Product / Service
              • Mitsubishi Electric - Key offerings
            • 14.12 Lockheed Martin
              • Lockheed Martin - Overview
              • Lockheed Martin - Product / Service
              • Lockheed Martin - Key offerings
            • 14.13 QinetiQ
              • QinetiQ - Overview
              • QinetiQ - Product / Service
              • QinetiQ - Key offerings
            • 14.14 Raymetrics
              • Raymetrics - Overview
              • Raymetrics - Product / Service
              • Raymetrics - Key offerings
            • 14.15 Everise Technology
              • Everise Technology - Overview
              • Everise Technology - Product / Service
              • Everise Technology - Key offerings
            • 14.16 SGURR Energy
              • SGURR Energy - Overview
              • SGURR Energy - Product / Service
              • SGURR Energy - Key offerings
            • 14.17 RENEW Energy Systems
              • RENEW Energy Systems - Overview
              • RENEW Energy Systems - Product / Service
              • RENEW Energy Systems - Key offerings
            • 14.18 GWU-Umwelttechnik
              • GWU-Umwelttechnik - Overview
              • GWU-Umwelttechnik - Product / Service
              • GWU-Umwelttechnik - Key offerings
            • 14.19 HALO Photonics
              • HALO Photonics - Overview
              • HALO Photonics - Product / Service
              • HALO Photonics - Key offerings
            • 14.20 MOVELASER
              • MOVELASER - Overview
              • MOVELASER - Product / Service
              • MOVELASER - Key offerings
            • 14.21 Nortek AS
              • Nortek AS - Overview
              • Nortek AS - Product / Service
              • Nortek AS - Key offerings
            • 14.22 Ammonit Measurement
              • Ammonit Measurement - Overview
              • Ammonit Measurement - Product / Service
              • Ammonit Measurement - Key offerings
            • 14.23 Aeva Inc.
              • Aeva Inc. - Overview
              • Aeva Inc. - Product / Service
              • Aeva Inc. - Key offerings
            • 14.24 Analog Devices Inc.
              • Analog Devices Inc. - Overview
              • Analog Devices Inc. - Product / Service
              • Analog Devices Inc. - Key offerings
            • 14.25 ESCO Technologies Inc.
              • ESCO Technologies Inc. - Overview
              • ESCO Technologies Inc. - Product / Service
              • ESCO Technologies Inc. - Key offerings
            • 14.26 Fred. Olsen Ocean AS
              • Fred. Olsen Ocean AS - Overview
              • Fred. Olsen Ocean AS - Product / Service
              • Fred. Olsen Ocean AS - Key offerings
            • 14.27 Hexagon AB
              • Hexagon AB - Overview
              • Hexagon AB - Product / Service
              • Hexagon AB - Key offerings
            • 14.28 John Wood Group PLC
              • John Wood Group PLC - Overview
              • John Wood Group PLC - Product / Service
              • John Wood Group PLC - Key offerings
            • 14.29 Lockheed Martin Corp.
              • Lockheed Martin Corp. - Overview
              • Lockheed Martin Corp. - Product / Service
              • Lockheed Martin Corp. - Key offerings
            • 14.30 LUMIBIRD SA
              • LUMIBIRD SA - Overview
              • LUMIBIRD SA - Product / Service
              • LUMIBIRD SA - Key offerings
            • 14.31 MGW TRADE and SERVICE PTY LTD.
              • MGW TRADE and SERVICE PTY LTD. - Overview
              • MGW TRADE and SERVICE PTY LTD. - Product / Service
              • MGW TRADE and SERVICE PTY LTD. - Key offerings
            • 14.32 Mitsubishi Electric Corp.
              • Mitsubishi Electric Corp. - Overview
              • Mitsubishi Electric Corp. - Product / Service
              • Mitsubishi Electric Corp. - Key offerings
            • 14.33 Pepperl and Fuchs SE
              • Pepperl and Fuchs SE - Overview
              • Pepperl and Fuchs SE - Product / Service
              • Pepperl and Fuchs SE - Key offerings
            • 14.34 Quanergy Systems Inc.
              • Quanergy Systems Inc. - Overview
              • Quanergy Systems Inc. - Product / Service
              • Quanergy Systems Inc. - Key offerings
            • 14.35 SICK AG
              • SICK AG - Overview
              • SICK AG - Product / Service
              • SICK AG - Key offerings
            • 14.36 Teledyne Technologies Inc.
              • Teledyne Technologies Inc. - Overview
              • Teledyne Technologies Inc. - Product / Service
              • Teledyne Technologies Inc. - Key offerings
            • 14.37 Trimble Inc.
              • Trimble Inc. - Overview
              • Trimble Inc. - Product / Service
              • Trimble Inc. - Key offerings
            • 14.38 Vaisala Oyj
              • Vaisala Oyj - Overview
              • Vaisala Oyj - Product / Service
              • Vaisala Oyj - Key offerings
            • 14.39 Valeo SA
              • Valeo SA - Overview
              • Valeo SA - Product / Service
              • Valeo SA - Key offerings
            • 14.40 Velodyne Lidar Inc.
              • Velodyne Lidar Inc. - Overview
              • Velodyne Lidar Inc. - Product / Service
              • Velodyne Lidar Inc. - Key offerings
            • 14.41 Windar Photonics Plc
              • Windar Photonics Plc - Overview
              • Windar Photonics Plc - Product / Service
              • Windar Photonics Plc - Key offerings

            13 Appendix

            • 13.1 Scope of the report
              • 13.2 Inclusions and exclusions checklist
                • Exhibit 179: Inclusions checklist
                • Exhibit 180: Exclusions checklist
              • 13.3 Currency conversion rates for US$
                • Exhibit 181: Currency conversion rates for US$
              • 13.4 Research methodology
                • Exhibit 182: Research methodology
                • Exhibit 183: Validation techniques employed for market sizing
                • Exhibit 184: Information sources
              • 13.5 List of abbreviations
                • Exhibit 185: List of abbreviations

              Research Methodology

              Technavio presents a detailed picture of the market by way of study, synthesis, and summation of data from multiple sources. The analysts have presented the various facets of the market with a particular focus on identifying the key industry influencers. The data thus presented is comprehensive, reliable, and the result of extensive research, both primary and secondary.

              INFORMATION SOURCES

              Primary sources

              • Manufacturers and suppliers
              • Channel partners
              • Industry experts
              • Strategic decision makers

              Secondary sources

              • Industry journals and periodicals
              • Government data
              • Financial reports of key industry players
              • Historical data
              • Press releases

              DATA ANALYSIS

              Data Synthesis

              • Collation of data
              • Estimation of key figures
              • Analysis of derived insights

              Data Validation

              • Triangulation with data models
              • Reference against proprietary databases
              • Corroboration with industry experts

              REPORT WRITING

              Qualitative

              • Market drivers
              • Market challenges
              • Market trends
              • Five forces analysis

              Quantitative

              • Market size and forecast
              • Market segmentation
              • Geographical insights
              • Competitive landscape

              Interested in this report?

              Get your sample now to see our research methodology and insights!

              Download Now

              Frequently Asked Questions

              LIDAR Systemsfor Wind Industry market growth will increase by $ 203.43 mn during 2024-2028 .

              The LIDAR Systemsfor Wind Industry market is expected to grow at a CAGR of 12.35% during 2024-2028 .

              LIDAR Systemsfor Wind Industry market is segmented by Product( Ground mounted LIDAR systems, Nacelle mounted LIDAR systems) Component( Laser, Scanner, Navigation system, Others, South America)

              Vaisala, Leosphere (Vaisala), ZephIR Lidar, Windar Photonics, NRG Systems, METEK GmbH, ZX Lidars, Deutsche WindGuard, Mitsubishi Electric, Lockheed Martin, QinetiQ, Raymetrics, Everise Technology, SGURR Energy, RENEW Energy Systems, GWU-Umwelttechnik, HALO Photonics, MOVELASER, Nortek AS, Ammonit Measurement are a few of the key vendors in the LIDAR Systemsfor Wind Industry market.

              North America will register the highest growth rate of 37% among the other regions. Therefore, the LIDAR Systemsfor Wind Industry market in North America is expected to garner significant business opportunities for the vendors during the forecast period.

              US, China, Japan, Germany, UKa US, China, Germany, Japan, UK, Australia, India, France, Brazil, UAE, Rest of World (ROW), Saudi Arabia, France, South Korea, Mexico, Italy, Spain

              • Increase in tower hub heightUnlike conventional power generation from fossil fuels is the driving factor this market.
              • generating electricity from wind is highly dependent on meteorological conditions. Wind assessment is carried out to quantify the wind speed and direction is the driving factor this market.
              • temperature is the driving factor this market.
              • and several other factors is the driving factor this market.
              • all of which have an impact on the power that is generated from the wind turbines. Technological advances and developments in blade designs are the main factors that lead to an increase in wind turbine output and capacity. By just doubling the rotor size or diameter is the driving factor this market.
              • the power output increases fourfold. Therefore is the driving factor this market.
              • the need to increase renewable power generation and rapid technological advances are increasing the adoption of wind towers and turbines is the driving factor this market.
              • which will fuel the growth of the global LIDAR systems market for wind industry. With the tower height increasing continuously is the driving factor this market.
              • the met mast height also needs to be increased to measure the wind. However is the driving factor this market.
              • owing to the cost and practical limitations such as time and complexity is the driving factor this market.
              • the met mast tower heights are generally limited to less than 100 meters. When it is necessary to take wind measurements above 100 meters is the driving factor this market.
              • vertical extrapolation is carried out based on the measured wind shear is the driving factor this market.
              • resulting in the uncertainty of the annual yields. The need to overcome the uncertainty has driven the demand for remote-sensing devices is the driving factor this market.
              • such as nacelle mounted LIDAR systems is the driving factor this market.
              • as they can be easily deployed is the driving factor this market.
              • typically in half a day. Moreover is the driving factor this market.
              • such systems are easy to operate. A met mast should neither be closely located nor be located far from the turbine as it results in the inaccurate measurement of wind speeds. Therefore is the driving factor this market.
              • wind operators follow the IEC 61400-12-1 standard for wind measurements. According to the IEC 61400-12-1 standard is the driving factor this market.
              • met masts must be located between 2D and 4D (D represents the distance of 'X' times the rotor diameter). Thus is the driving factor this market.
              • the increase in the tower hub height will boost the growth of the global LIDAR systems market for wind industry during the forecast period. is the driving factor this market.

              The LIDAR Systemsfor Wind Industry market vendors should focus on grabbing business opportunities from the Ground mounted LIDAR systems segment as it accounted for the largest market share in the base year.