Limestone Powder Market Analysis, Size, and Forecast 2026-2030: North America (US, Canada, and Mexico), Europe (Germany, UK, and France), APAC (China, Japan, and India), Middle East and Africa (Saudi Arabia, South Africa, and UAE), South America (Brazil, Argentina, and Colombia), and Rest of World (ROW)

Limestone Powder Market Analysis, Size, and Forecast 2026-2030:
North America (US, Canada, and Mexico), Europe (Germany, UK, and France), APAC (China, Japan, and India), Middle East and Africa (Saudi Arabia, South Africa, and UAE), South America (Brazil, Argentina, and Colombia), and Rest of World (ROW)

Published: Dec 2025 286 Pages SKU: IRTNTR80152

Market Overview at a Glance

$4.84 B
Market Opportunity
8%
CAGR 2025 - 2030
49.2%
North America Growth
$5.55 B
Heavy calcium carbonate powder segment 2024

Limestone Powder Market Size 2026-2030

The limestone powder market size is valued to increase by USD 4.84 billion, at a CAGR of 8% from 2025 to 2030. Asia Pacific infrastructure boom will drive the limestone powder market.

Major Market Trends & Insights

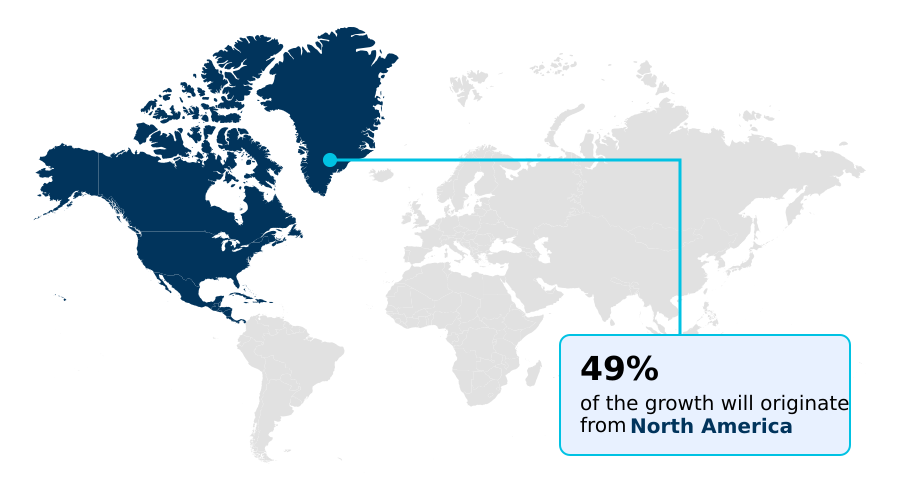
  • North America dominated the market and accounted for a 49.2% growth during the forecast period.
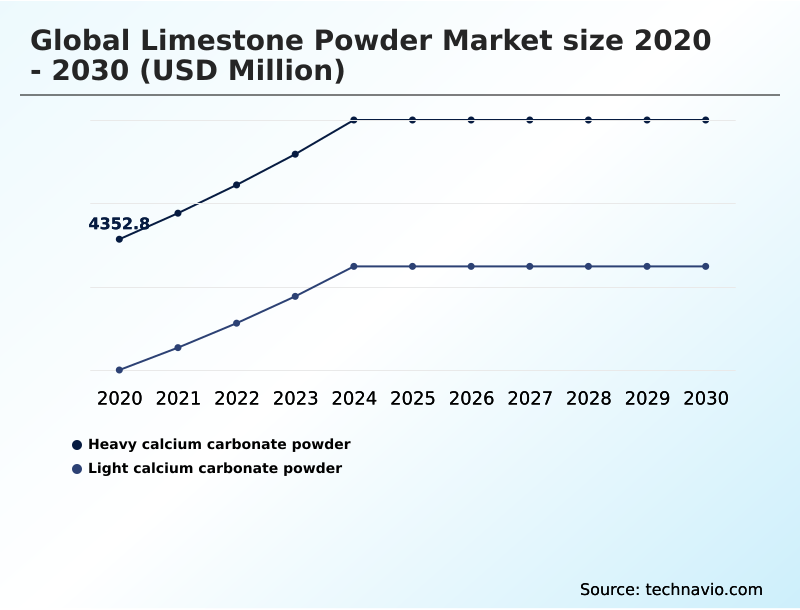
  • By Type - Heavy calcium carbonate powder segment was valued at USD 5.55 billion in 2024
  • By Application - Building materials segment accounted for the largest market revenue share in 2024

Market Size & Forecast

  • Market Opportunities: USD 7.78 billion
  • Market Future Opportunities: USD 4.84 billion
  • CAGR from 2025 to 2030 : 8%

Market Summary

  • The limestone powder market is foundational to numerous global industries, driven by its versatility as a mineral filler and chemical agent. Demand is consistently fueled by the construction sector, where it is a critical component in cement, concrete, and asphalt.
  • Simultaneously, the agricultural industry relies on it for soil pH regulation and as a calcium supplement in animal feed, supporting global food production. Environmental applications, particularly flue gas desulfurization (FGD) in power plants, represent a significant growth area as nations tighten emission standards. However, producers face considerable challenges, including stringent quarrying regulations that increase operational costs and supply constraints.
  • For instance, a producer might invest heavily in advanced dust suppression and land rehabilitation to secure a mining permit, impacting capital expenditure budgets. In response to these pressures and to capture higher-value opportunities, there is a strategic industry shift toward producing specialized grades, such as precipitated calcium carbonate (PCC) and surface-modified powders, for applications in plastics, paints, and pharmaceuticals.

What will be the Size of the Limestone Powder Market during the forecast period?

Get Key Insights on Market Forecast (PDF) Request Free Sample

How is the Limestone Powder Market Segmented?

The limestone powder industry research report provides comprehensive data (region-wise segment analysis), with forecasts and estimates in "USD million" for the period 2026-2030, as well as historical data from 2020-2024 for the following segments.

  • Type
    • Heavy calcium carbonate powder
    • Light calcium carbonate powder
  • Application
    • Building materials
    • Rubber
    • Wire insulation
  • Method
    • Dry grinding
    • Wet grinding
  • Geography
    • North America
      • US
      • Canada
      • Mexico
    • Europe
      • Germany
      • UK
      • France
    • APAC
      • China
      • Japan
      • India
    • Middle East and Africa
      • Saudi Arabia
      • South Africa
      • UAE
    • South America
      • Brazil
      • Argentina
      • Colombia
    • Rest of World (ROW)

By Type Insights

The heavy calcium carbonate powder segment is estimated to witness significant growth during the forecast period.

The limestone powder market is segmented based on processing methods and end-user applications, with significant distinctions between product grades.

Heavy calcium carbonate powder, produced through dry grinding, is a cornerstone industrial filler used extensively as a construction aggregate and asphalt filler. Its production is less energy-intensive for coarser grades, making it a cost-effective mineral filler in bulk applications.

Innovations in dry grinding have improved efficiency, reducing operational power consumption by up to 15%. This material is crucial for enhancing the physical properties of polymer compounds and serves as a vital cement raw material.

The demand for this grade is driven by its utility as an animal feed supplement and its role in soil pH regulation and water treatment neutralizer applications.

Request Free Sample

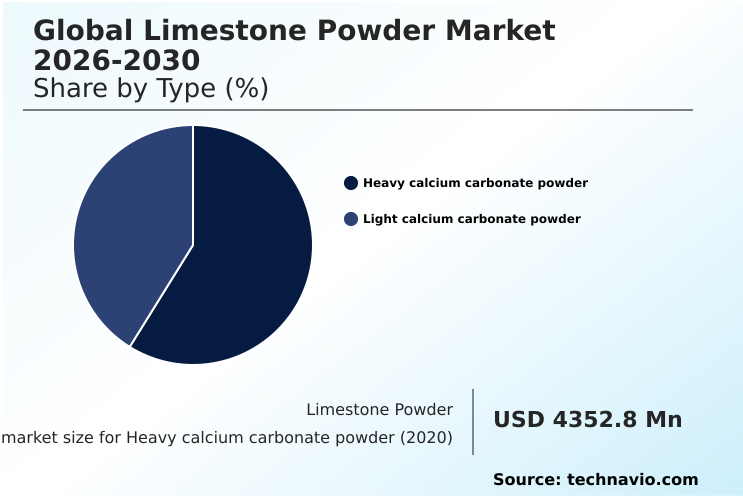
The Heavy calcium carbonate powder segment was valued at USD 5.55 billion in 2024 and showed a gradual increase during the forecast period.

Request Free Sample

Regional Analysis

North America is estimated to contribute 49.2% to the growth of the global market during the forecast period.Technavio’s analysts have elaborately explained the regional trends and drivers that shape the market during the forecast period.

See How Limestone Powder Market Demand is Rising in North America Request Free Sample

The geographic landscape of the limestone powder market is characterized by diverse regional dynamics, with APAC poised to exhibit the highest growth, expanding at an estimated 9.4% annually.

This expansion is driven by massive infrastructure investments and rapid industrialization, creating immense demand for ground calcium carbonate (GCC) and precipitated calcium carbonate (PCC).

In contrast, North America, with a steady growth of 7.7%, shows mature demand centered on high-quality limestone for soil conditioning and environmental applications like flue gas desulfurization (FGD).

Europe, growing at 8.5%, prioritizes value-added products, including specialized industrial fillers for polymer compounds and sustainable construction aggregates. The region's focus on a circular economy also presents unique challenges and opportunities.

Market Dynamics

Our researchers analyzed the data with 2025 as the base year, along with the key drivers, trends, and challenges. A holistic analysis of drivers will help companies refine their marketing strategies to gain a competitive advantage.

  • Strategic analysis of the limestone powder market reveals distinct value propositions across specialized applications. For instance, the use of ultra-fine limestone powder in plastics is driven by its ability to enhance mechanical properties and reduce resin consumption, a key cost-saving measure for manufacturers.
  • In contrast, the selection of limestone powder for flue gas desulfurization is based on its chemical reactivity and cost-effectiveness in capturing sulfur dioxide emissions, a critical factor for regulatory compliance in the energy sector. When evaluating limestone powder vs.
  • talc as a filler, companies often weigh the former's lower cost and high brightness against talc's superior barrier properties in certain polymer films. Similarly, the benefits of limestone in animal feed center on providing a bioavailable calcium source, a different functional requirement than its role in improving the opacity of paper coatings.
  • Understanding these nuances is vital; for example, regionalizing supply chains for ground calcium carbonate in animal feed can reduce transportation expenses by over 25% compared to sourcing from distant international suppliers, significantly impacting operational margins. This highlights how application-specific demands and logistical efficiencies dictate market positioning and profitability.

What are the key market drivers leading to the rise in the adoption of Limestone Powder Industry?

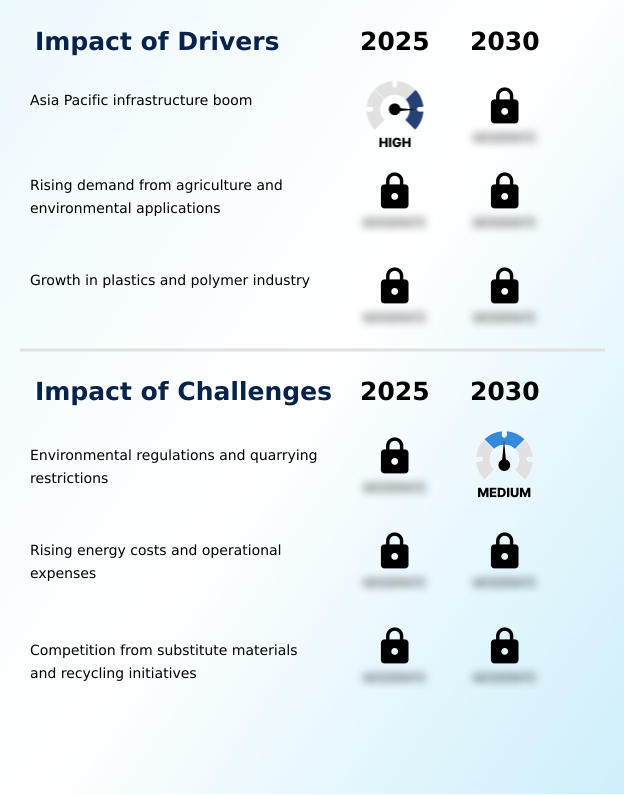
  • The infrastructure boom across the Asia Pacific region stands as a primary driver for the limestone powder market.

  • Market growth is fundamentally driven by sustained demand from construction, agriculture, and environmental sectors. Massive infrastructure projects globally create a high-volume requirement for limestone powder as a primary mineral filler in cement and concrete.
  • In agriculture, its use for soil pH regulation can boost crop yields by over 10% in acidic soils, ensuring its role as a vital input.
  • Concurrently, stringent environmental policies mandate its use for flue gas desulfurization (FGD), where high-purity ground calcium carbonate (GCC) systems can capture more than 95% of sulfur dioxide emissions.
  • This multi-faceted demand, from bulk construction aggregate to specialized applications like precipitated calcium carbonate (PCC), solidifies the market's robust outlook.

What are the market trends shaping the Limestone Powder Industry?

  • A key market trend is the growing adoption of ultra-fine and surface-modified limestone powders. These advanced materials are increasingly sought for high-performance applications.

  • A significant trend shaping the market is the increasing adoption of specialized grades offering enhanced performance. The demand for ultra-fine and surface-modified limestone is driven by its ability to act as a high-performance asphalt filler and rheology control agent in advanced formulations.
  • The adoption of these premium grades can improve polymer dispersibility by up to 40%, leading to superior product consistency. Furthermore, an emphasis on sustainability is compelling producers to invest in greener technologies for wet grinding and developing certified product lines.
  • These sustainably sourced materials are showing 15% higher adoption rates among buyers in environmentally sensitive sectors, reinforcing the importance of agricultural lime and fine particle limestone in the circular economy.

What challenges does the Limestone Powder Industry face during its growth?

  • Stringent environmental regulations and quarrying restrictions present a significant challenge to the industry's growth.

  • The primary challenges facing the limestone powder market stem from operational costs and regulatory pressures. Increasingly strict environmental rules on quarrying add significant compliance costs, while energy-intensive processes like dry grinding and fine particle limestone production are vulnerable to volatile energy prices, which can represent up to 30% of total operational expenditure. Furthermore, the industry faces competition from substitute materials.
  • In construction, the use of industrial byproducts like fly ash as a concrete additive can displace limestone powder usage by up to 25% in certain green building formulations. This forces producers to innovate and highlight the unique benefits of their products, from serving as a paper coating pigment to a plastic extender.

Exclusive Technavio Analysis on Customer Landscape

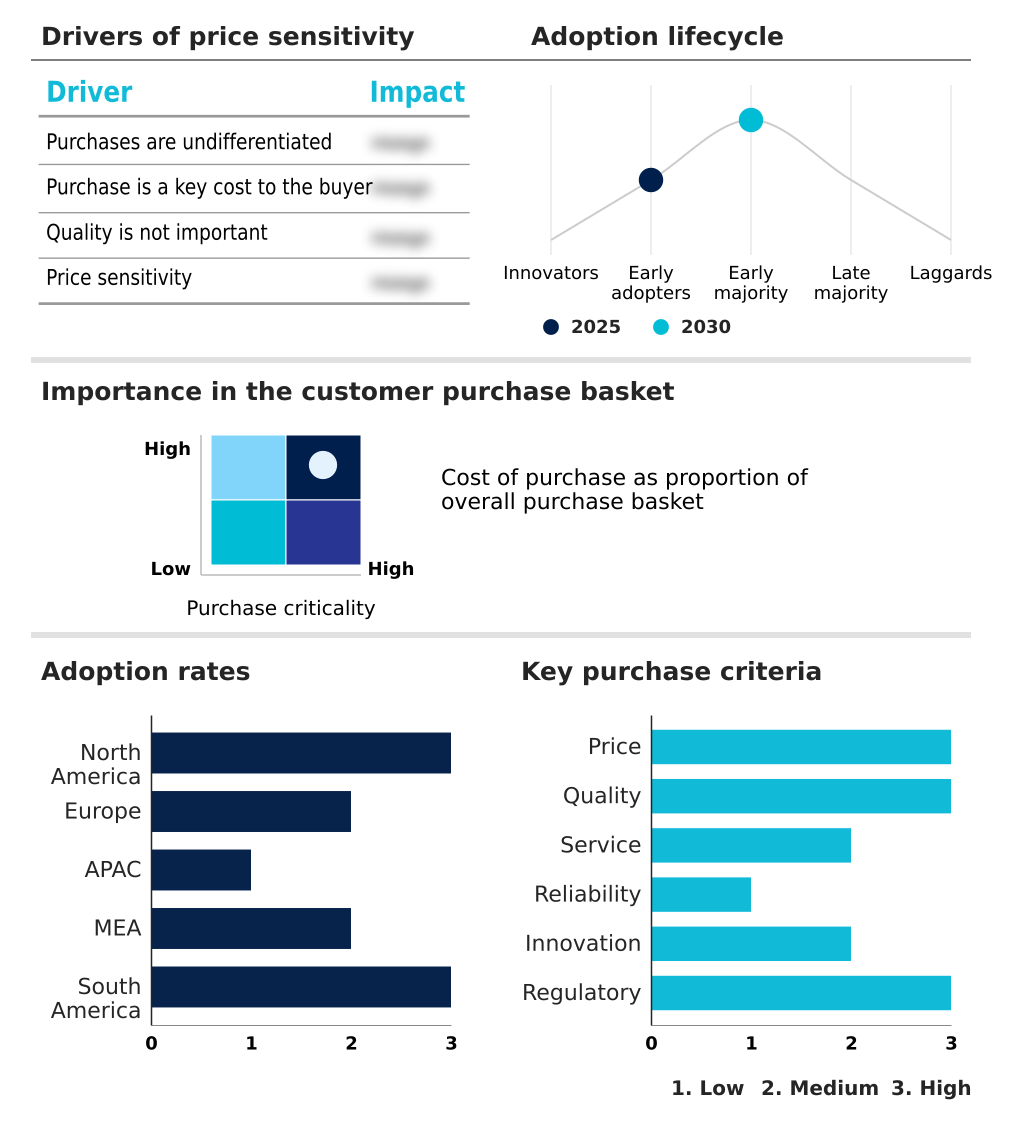
The limestone powder market forecasting report includes the adoption lifecycle of the market, covering from the innovator’s stage to the laggard’s stage. It focuses on adoption rates in different regions based on penetration. Furthermore, the limestone powder market report also includes key purchase criteria and drivers of price sensitivity to help companies evaluate and develop their market growth analysis strategies.

Customer Landscape of Limestone Powder Industry

Competitive Landscape

Companies are implementing various strategies, such as strategic alliances, limestone powder market forecast, partnerships, mergers and acquisitions, geographical expansion, and product/service launches, to enhance their presence in the industry.

Astrra Chemicals - Provides specialized calcium carbonate powders, serving as essential industrial fillers and additives for the construction and agricultural sectors.

The industry research and growth report includes detailed analyses of the competitive landscape of the market and information about key companies, including:

  • Astrra Chemicals
  • Blue Mountain Minerals
  • Graymont Ltd.
  • Greer Lime Co.
  • Gulshan Polyols Ltd.
  • Imerys S.A.
  • Lhoist SA
  • Linwood Mining and Minerals Corp.
  • Martin Marietta Materials Inc.
  • Mississippi Lime Co.
  • Nippon Steel Corp.
  • Northern Minerals Ltd.
  • Pete Lien and Sons Inc.
  • SCR Sibelco NV
  • Sigma Minerals Ltd.
  • SigmaRoc
  • United States Lime and Minerals Inc.

Qualitative and quantitative analysis of companies has been conducted to help clients understand the wider business environment as well as the strengths and weaknesses of key industry players. Data is qualitatively analyzed to categorize companies as pure play, category-focused, industry-focused, and diversified; it is quantitatively analyzed to categorize companies as dominant, leading, strong, tentative, and weak.

Recent Development and News in Limestone powder market

  • In May 2025, Imerys S.A. launched a new range of surface-modified, ultra-fine precipitated calcium carbonate (PCC) products, targeting high-performance applications in the automotive plastics and biopolymer packaging industries.
  • In February 2025, Lhoist SA announced the completion of its new high-purity limestone powder production line in Texas, specifically designed to meet the increasing demand from flue gas desulfurization (FGD) applications in the energy sector.
  • In November 2024, SigmaRoc completed the acquisition of a key quarry and processing facility in the Baltic region, strengthening its localized supply chain for construction aggregates and industrial limestone in Northern Europe.
  • In September 2024, Gulshan Polyols Ltd. entered into a long-term strategic partnership with a major pharmaceutical manufacturer to supply high-purity precipitated calcium carbonate as a key excipient for tablet formulations.

Dive into Technavio’s robust research methodology, blending expert interviews, extensive data synthesis, and validated models for unparalleled Limestone Powder Market insights. See full methodology.

Market Scope
Page number 286
Base year 2025
Historic period 2020-2024
Forecast period 2026-2030
Growth momentum & CAGR Accelerate at a CAGR of 8%
Market growth 2026-2030 USD 4843.4 million
Market structure Fragmented
YoY growth 2025-2026(%) 7.5%
Key countries US, Canada, Mexico, Germany, UK, France, Italy, Spain, The Netherlands, China, Japan, India, South Korea, Australia, Indonesia, Saudi Arabia, South Africa, UAE, Egypt, Turkey, Brazil, Argentina and Colombia
Competitive landscape Leading Companies, Market Positioning of Companies, Competitive Strategies, and Industry Risks

Request Free Sample

Research Analyst Overview

  • The limestone powder market's trajectory is defined by the dual pressures of commodity demand and specialization. Core applications rely on ground calcium carbonate (GCC) as a fundamental mineral filler, asphalt filler, and agricultural lime. However, profitability is increasingly linked to advanced processing techniques like wet grinding and dry grinding to produce high-value materials.
  • The industry is navigating a strategic pivot toward precipitated calcium carbonate (PCC) and surface-modified limestone, which offer enhanced performance for demanding sectors. A key boardroom consideration is the capital investment required for sustainable production, as environmental compliance for flue gas desulfurization (FGD) and responsible quarrying for soil pH regulation have become critical.
  • For instance, deploying energy-efficient dry grinding technologies can lower operational power consumption by up to 15%. This reflects a broader shift where technical capability in areas like rheology control and producing fine particle limestone dictates competitive advantage.

What are the Key Data Covered in this Limestone Powder Market Research and Growth Report?

  • What is the expected growth of the Limestone Powder Market between 2026 and 2030?

    • USD 4.84 billion, at a CAGR of 8%

  • What segmentation does the market report cover?

    • The report is segmented by Type (Heavy calcium carbonate powder, and Light calcium carbonate powder), Application (Building materials, Rubber, and Wire insulation), Method (Dry grinding, and Wet grinding) and Geography (North America, Europe, APAC, Middle East and Africa, South America)

  • Which regions are analyzed in the report?

    • North America, Europe, APAC, Middle East and Africa and South America

  • What are the key growth drivers and market challenges?

    • Asia Pacific infrastructure boom, Environmental regulations and quarrying restrictions

  • Who are the major players in the Limestone Powder Market?

    • Astrra Chemicals, Blue Mountain Minerals, Graymont Ltd., Greer Lime Co., Gulshan Polyols Ltd., Imerys S.A., Lhoist SA, Linwood Mining and Minerals Corp., Martin Marietta Materials Inc., Mississippi Lime Co., Nippon Steel Corp., Northern Minerals Ltd., Pete Lien and Sons Inc., SCR Sibelco NV, Sigma Minerals Ltd., SigmaRoc and United States Lime and Minerals Inc.

Market Research Insights

  • The limestone powder market is shaped by demand for functional and cost-effective materials across industrial verticals. The adoption of specialized grades like precipitated calcium carbonate is expanding, as its use can increase the opacity of paper coatings by over 10% compared to standard fillers.
  • In polymer applications, surface-modified limestone powder serves as a plastic extender that can enhance compound stiffness by up to 20% while reducing formulation costs. This material's role as a concrete additive improves workability and strength, while its function as a water treatment neutralizer is critical for environmental compliance.
  • As an animal feed supplement, it provides essential calcium, demonstrating its diverse utility. The market's dynamism is rooted in this ability to deliver performance benefits and economic advantages simultaneously.

We can help! Our analysts can customize this limestone powder market research report to meet your requirements.

Get in touch

1. Executive Summary

1.1 Market overview

Executive Summary - Chart on Market Overview
Executive Summary - Data Table on Market Overview
Executive Summary - Chart on Global Market Characteristics
Executive Summary - Chart on Market by Geography
Executive Summary - Chart on Market Segmentation by Type
Executive Summary - Chart on Market Segmentation by Application
Executive Summary - Chart on Market Segmentation by Method
Executive Summary - Chart on Incremental Growth
Executive Summary - Data Table on Incremental Growth
Executive Summary - Chart on Company Market Positioning

2. Technavio Analysis

2.1 Analysis of price sensitivity, lifecycle, customer purchase basket, adoption rates, and purchase criteria

2.2 Criticality of inputs and Factors of differentiation

Chart on Overview on criticality of inputs and factors of differentiation

2.3 Factors of disruption

Chart on Overview on factors of disruption

2.4 Impact of drivers and challenges

Chart on Impact of drivers and challenges in 2025 and 2030

3. Market Landscape

3.1 Market ecosystem

Chart on Parent Market
Data Table on - Parent Market

3.2 Market characteristics

Chart on Market characteristics analysis

3.3 Value chain analysis

Chart on Value chain analysis

4. Market Sizing

4.1 Market definition

Data Table on Offerings of companies included in the market definition

4.2 Market segment analysis

Market segments

4.3 Market size 2025

4.4 Market outlook: Forecast for 2025-2030

Chart on Global - Market size and forecast 2025-2030 ($ million)
Data Table on Global - Market size and forecast 2025-2030 ($ million)
Chart on Global Market: Year-over-year growth 2025-2030 (%)
Data Table on Global Market: Year-over-year growth 2025-2030 (%)

5. Historic Market Size

5.1 Global Limestone Powder Market 2020 - 2024

Historic Market Size - Data Table on Global Limestone Powder Market 2020 - 2024 ($ million)

5.2 Type segment analysis 2020 - 2024

Historic Market Size - Type Segment 2020 - 2024 ($ million)

5.3 Application segment analysis 2020 - 2024

Historic Market Size - Application Segment 2020 - 2024 ($ million)

5.4 Method segment analysis 2020 - 2024

Historic Market Size - Method Segment 2020 - 2024 ($ million)

5.5 Geography segment analysis 2020 - 2024

Historic Market Size - Geography Segment 2020 - 2024 ($ million)

5.6 Country segment analysis 2020 - 2024

Historic Market Size - Country Segment 2020 - 2024 ($ million)

6. Qualitative Analysis

6.1 Impact of AI on global limestone powder market

7. Five Forces Analysis

7.1 Five forces summary

Five forces analysis - Comparison between 2025 and 2030

7.2 Bargaining power of buyers

Bargaining power of buyers - Impact of key factors 2025 and 2030

7.3 Bargaining power of suppliers

Bargaining power of suppliers - Impact of key factors in 2025 and 2030

7.4 Threat of new entrants

Threat of new entrants - Impact of key factors in 2025 and 2030

7.5 Threat of substitutes

Threat of substitutes - Impact of key factors in 2025 and 2030

7.6 Threat of rivalry

Threat of rivalry - Impact of key factors in 2025 and 2030

7.7 Market condition

Chart on Market condition - Five forces 2025 and 2030

8. Market Segmentation by Type

8.1 Market segments

Chart on Type - Market share 2025-2030 (%)
Data Table on Type - Market share 2025-2030 (%)

8.2 Comparison by Type

Chart on Comparison by Type
Data Table on Comparison by Type

8.3 Heavy calcium carbonate powder - Market size and forecast 2025-2030

Chart on Heavy calcium carbonate powder - Market size and forecast 2025-2030 ($ million)
Data Table on Heavy calcium carbonate powder - Market size and forecast 2025-2030 ($ million)
Chart on Heavy calcium carbonate powder - Year-over-year growth 2025-2030 (%)
Data Table on Heavy calcium carbonate powder - Year-over-year growth 2025-2030 (%)

8.4 Light calcium carbonate powder - Market size and forecast 2025-2030

Chart on Light calcium carbonate powder - Market size and forecast 2025-2030 ($ million)
Data Table on Light calcium carbonate powder - Market size and forecast 2025-2030 ($ million)
Chart on Light calcium carbonate powder - Year-over-year growth 2025-2030 (%)
Data Table on Light calcium carbonate powder - Year-over-year growth 2025-2030 (%)

8.5 Market opportunity by Type

Market opportunity by Type ($ million)
Data Table on Market opportunity by Type ($ million)

9. Market Segmentation by Application

9.1 Market segments

Chart on Application - Market share 2025-2030 (%)
Data Table on Application - Market share 2025-2030 (%)

9.2 Comparison by Application

Chart on Comparison by Application
Data Table on Comparison by Application

9.3 Building materials - Market size and forecast 2025-2030

Chart on Building materials - Market size and forecast 2025-2030 ($ million)
Data Table on Building materials - Market size and forecast 2025-2030 ($ million)
Chart on Building materials - Year-over-year growth 2025-2030 (%)
Data Table on Building materials - Year-over-year growth 2025-2030 (%)

9.4 Rubber - Market size and forecast 2025-2030

Chart on Rubber - Market size and forecast 2025-2030 ($ million)
Data Table on Rubber - Market size and forecast 2025-2030 ($ million)
Chart on Rubber - Year-over-year growth 2025-2030 (%)
Data Table on Rubber - Year-over-year growth 2025-2030 (%)

9.5 Wire insulation - Market size and forecast 2025-2030

Chart on Wire insulation - Market size and forecast 2025-2030 ($ million)
Data Table on Wire insulation - Market size and forecast 2025-2030 ($ million)
Chart on Wire insulation - Year-over-year growth 2025-2030 (%)
Data Table on Wire insulation - Year-over-year growth 2025-2030 (%)

9.6 Market opportunity by Application

Market opportunity by Application ($ million)
Data Table on Market opportunity by Application ($ million)

10. Market Segmentation by Method

10.1 Market segments

Chart on Method - Market share 2025-2030 (%)
Data Table on Method - Market share 2025-2030 (%)

10.2 Comparison by Method

Chart on Comparison by Method
Data Table on Comparison by Method

10.3 Dry grinding - Market size and forecast 2025-2030

Chart on Dry grinding - Market size and forecast 2025-2030 ($ million)
Data Table on Dry grinding - Market size and forecast 2025-2030 ($ million)
Chart on Dry grinding - Year-over-year growth 2025-2030 (%)
Data Table on Dry grinding - Year-over-year growth 2025-2030 (%)

10.4 Wet grinding - Market size and forecast 2025-2030

Chart on Wet grinding - Market size and forecast 2025-2030 ($ million)
Data Table on Wet grinding - Market size and forecast 2025-2030 ($ million)
Chart on Wet grinding - Year-over-year growth 2025-2030 (%)
Data Table on Wet grinding - Year-over-year growth 2025-2030 (%)

10.5 Market opportunity by Method

Market opportunity by Method ($ million)
Data Table on Market opportunity by Method ($ million)

11. Customer Landscape

11.1 Customer landscape overview

Analysis of price sensitivity, lifecycle, customer purchase basket, adoption rates, and purchase criteria

12. Geographic Landscape

12.1 Geographic segmentation

Chart on Market share by geography 2025-2030 (%)
Data Table on Market share by geography 2025-2030 (%)

12.2 Geographic comparison

Chart on Geographic comparison
Data Table on Geographic comparison

12.3 North America - Market size and forecast 2025-2030

Chart on North America - Market size and forecast 2025-2030 ($ million)
Data Table on North America - Market size and forecast 2025-2030 ($ million)
Chart on North America - Year-over-year growth 2025-2030 (%)
Data Table on North America - Year-over-year growth 2025-2030 (%)
Chart on Regional Comparison - North America
Data Table on Regional Comparison - North America

12.3.1 US - Market size and forecast 2025-2030

Chart on US - Market size and forecast 2025-2030 ($ million)
Data Table on US - Market size and forecast 2025-2030 ($ million)
Chart on US - Year-over-year growth 2025-2030 (%)
Data Table on US - Year-over-year growth 2025-2030 (%)

12.3.2 Canada - Market size and forecast 2025-2030

Chart on Canada - Market size and forecast 2025-2030 ($ million)
Data Table on Canada - Market size and forecast 2025-2030 ($ million)
Chart on Canada - Year-over-year growth 2025-2030 (%)
Data Table on Canada - Year-over-year growth 2025-2030 (%)

12.3.3 Mexico - Market size and forecast 2025-2030

Chart on Mexico - Market size and forecast 2025-2030 ($ million)
Data Table on Mexico - Market size and forecast 2025-2030 ($ million)
Chart on Mexico - Year-over-year growth 2025-2030 (%)
Data Table on Mexico - Year-over-year growth 2025-2030 (%)

12.4 Europe - Market size and forecast 2025-2030

Chart on Europe - Market size and forecast 2025-2030 ($ million)
Data Table on Europe - Market size and forecast 2025-2030 ($ million)
Chart on Europe - Year-over-year growth 2025-2030 (%)
Data Table on Europe - Year-over-year growth 2025-2030 (%)
Chart on Regional Comparison - Europe
Data Table on Regional Comparison - Europe

12.4.1 Germany - Market size and forecast 2025-2030

Chart on Germany - Market size and forecast 2025-2030 ($ million)
Data Table on Germany - Market size and forecast 2025-2030 ($ million)
Chart on Germany - Year-over-year growth 2025-2030 (%)
Data Table on Germany - Year-over-year growth 2025-2030 (%)

12.4.2 UK - Market size and forecast 2025-2030

Chart on UK - Market size and forecast 2025-2030 ($ million)
Data Table on UK - Market size and forecast 2025-2030 ($ million)
Chart on UK - Year-over-year growth 2025-2030 (%)
Data Table on UK - Year-over-year growth 2025-2030 (%)

12.4.3 France - Market size and forecast 2025-2030

Chart on France - Market size and forecast 2025-2030 ($ million)
Data Table on France - Market size and forecast 2025-2030 ($ million)
Chart on France - Year-over-year growth 2025-2030 (%)
Data Table on France - Year-over-year growth 2025-2030 (%)

12.4.4 Italy - Market size and forecast 2025-2030

Chart on Italy - Market size and forecast 2025-2030 ($ million)
Data Table on Italy - Market size and forecast 2025-2030 ($ million)
Chart on Italy - Year-over-year growth 2025-2030 (%)
Data Table on Italy - Year-over-year growth 2025-2030 (%)

12.4.5 Spain - Market size and forecast 2025-2030

Chart on Spain - Market size and forecast 2025-2030 ($ million)
Data Table on Spain - Market size and forecast 2025-2030 ($ million)
Chart on Spain - Year-over-year growth 2025-2030 (%)
Data Table on Spain - Year-over-year growth 2025-2030 (%)

12.4.6 The Netherlands - Market size and forecast 2025-2030

Chart on The Netherlands - Market size and forecast 2025-2030 ($ million)
Data Table on The Netherlands - Market size and forecast 2025-2030 ($ million)
Chart on The Netherlands - Year-over-year growth 2025-2030 (%)
Data Table on The Netherlands - Year-over-year growth 2025-2030 (%)

12.5 APAC - Market size and forecast 2025-2030

Chart on APAC - Market size and forecast 2025-2030 ($ million)
Data Table on APAC - Market size and forecast 2025-2030 ($ million)
Chart on APAC - Year-over-year growth 2025-2030 (%)
Data Table on APAC - Year-over-year growth 2025-2030 (%)
Chart on Regional Comparison - APAC
Data Table on Regional Comparison - APAC

12.5.1 China - Market size and forecast 2025-2030

Chart on China - Market size and forecast 2025-2030 ($ million)
Data Table on China - Market size and forecast 2025-2030 ($ million)
Chart on China - Year-over-year growth 2025-2030 (%)
Data Table on China - Year-over-year growth 2025-2030 (%)

12.5.2 Japan - Market size and forecast 2025-2030

Chart on Japan - Market size and forecast 2025-2030 ($ million)
Data Table on Japan - Market size and forecast 2025-2030 ($ million)
Chart on Japan - Year-over-year growth 2025-2030 (%)
Data Table on Japan - Year-over-year growth 2025-2030 (%)

12.5.3 India - Market size and forecast 2025-2030

Chart on India - Market size and forecast 2025-2030 ($ million)
Data Table on India - Market size and forecast 2025-2030 ($ million)
Chart on India - Year-over-year growth 2025-2030 (%)
Data Table on India - Year-over-year growth 2025-2030 (%)

12.5.4 South Korea - Market size and forecast 2025-2030

Chart on South Korea - Market size and forecast 2025-2030 ($ million)
Data Table on South Korea - Market size and forecast 2025-2030 ($ million)
Chart on South Korea - Year-over-year growth 2025-2030 (%)
Data Table on South Korea - Year-over-year growth 2025-2030 (%)

12.5.5 Australia - Market size and forecast 2025-2030

Chart on Australia - Market size and forecast 2025-2030 ($ million)
Data Table on Australia - Market size and forecast 2025-2030 ($ million)
Chart on Australia - Year-over-year growth 2025-2030 (%)
Data Table on Australia - Year-over-year growth 2025-2030 (%)

12.5.6 Indonesia - Market size and forecast 2025-2030

Chart on Indonesia - Market size and forecast 2025-2030 ($ million)
Data Table on Indonesia - Market size and forecast 2025-2030 ($ million)
Chart on Indonesia - Year-over-year growth 2025-2030 (%)
Data Table on Indonesia - Year-over-year growth 2025-2030 (%)

12.6 Middle East and Africa - Market size and forecast 2025-2030

Chart on Middle East and Africa - Market size and forecast 2025-2030 ($ million)
Data Table on Middle East and Africa - Market size and forecast 2025-2030 ($ million)
Chart on Middle East and Africa - Year-over-year growth 2025-2030 (%)
Data Table on Middle East and Africa - Year-over-year growth 2025-2030 (%)
Chart on Regional Comparison - Middle East and Africa
Data Table on Regional Comparison - Middle East and Africa

12.6.1 Saudi Arabia - Market size and forecast 2025-2030

Chart on Saudi Arabia - Market size and forecast 2025-2030 ($ million)
Data Table on Saudi Arabia - Market size and forecast 2025-2030 ($ million)
Chart on Saudi Arabia - Year-over-year growth 2025-2030 (%)
Data Table on Saudi Arabia - Year-over-year growth 2025-2030 (%)

12.6.2 South Africa - Market size and forecast 2025-2030

Chart on South Africa - Market size and forecast 2025-2030 ($ million)
Data Table on South Africa - Market size and forecast 2025-2030 ($ million)
Chart on South Africa - Year-over-year growth 2025-2030 (%)
Data Table on South Africa - Year-over-year growth 2025-2030 (%)

12.6.3 UAE - Market size and forecast 2025-2030

Chart on UAE - Market size and forecast 2025-2030 ($ million)
Data Table on UAE - Market size and forecast 2025-2030 ($ million)
Chart on UAE - Year-over-year growth 2025-2030 (%)
Data Table on UAE - Year-over-year growth 2025-2030 (%)

12.6.4 Egypt - Market size and forecast 2025-2030

Chart on Egypt - Market size and forecast 2025-2030 ($ million)
Data Table on Egypt - Market size and forecast 2025-2030 ($ million)
Chart on Egypt - Year-over-year growth 2025-2030 (%)
Data Table on Egypt - Year-over-year growth 2025-2030 (%)

12.6.5 Turkey - Market size and forecast 2025-2030

Chart on Turkey - Market size and forecast 2025-2030 ($ million)
Data Table on Turkey - Market size and forecast 2025-2030 ($ million)
Chart on Turkey - Year-over-year growth 2025-2030 (%)
Data Table on Turkey - Year-over-year growth 2025-2030 (%)

12.7 South America - Market size and forecast 2025-2030

Chart on South America - Market size and forecast 2025-2030 ($ million)
Data Table on South America - Market size and forecast 2025-2030 ($ million)
Chart on South America - Year-over-year growth 2025-2030 (%)
Data Table on South America - Year-over-year growth 2025-2030 (%)
Chart on Regional Comparison - South America
Data Table on Regional Comparison - South America

12.7.1 Brazil - Market size and forecast 2025-2030

Chart on Brazil - Market size and forecast 2025-2030 ($ million)
Data Table on Brazil - Market size and forecast 2025-2030 ($ million)
Chart on Brazil - Year-over-year growth 2025-2030 (%)
Data Table on Brazil - Year-over-year growth 2025-2030 (%)

12.7.2 Argentina - Market size and forecast 2025-2030

Chart on Argentina - Market size and forecast 2025-2030 ($ million)
Data Table on Argentina - Market size and forecast 2025-2030 ($ million)
Chart on Argentina - Year-over-year growth 2025-2030 (%)
Data Table on Argentina - Year-over-year growth 2025-2030 (%)

12.7.3 Colombia - Market size and forecast 2025-2030

Chart on Colombia - Market size and forecast 2025-2030 ($ million)
Data Table on Colombia - Market size and forecast 2025-2030 ($ million)
Chart on Colombia - Year-over-year growth 2025-2030 (%)
Data Table on Colombia - Year-over-year growth 2025-2030 (%)

12.8 Market opportunity by geography

Market opportunity by geography ($ million)
Data Tables on Market opportunity by geography ($ million)

13. Drivers, Challenges, and Opportunity

13.1 Market drivers

Asia Pacific infrastructure boom
Rising demand from agriculture and environmental applications
Growth in plastics and polymer industry

13.2 Market challenges

Environmental regulations and quarrying restrictions
Rising energy costs and operational expenses
Competition from substitute materials and recycling initiatives

13.3 Impact of drivers and challenges

Impact of drivers and challenges in 2025 and 2030

13.4 Market opportunities

Growing adoption of ultra-fine and surface-modified limestone powder
Emphasis on sustainable sourcing and production
Regionalization of supply chains and localized production

14. Competitive Landscape

14.1 Overview

14.2

Overview on criticality of inputs and factors of differentiation

14.3 Landscape disruption

Overview on factors of disruption

14.4 Industry risks

Impact of key risks on business

15. Competitive Analysis

15.1 Companies profiled

Companies covered

15.2 Company ranking index

15.3 Market positioning of companies

Matrix on companies position and classification

15.4 Astrra Chemicals

Astrra Chemicals - Overview
Astrra Chemicals - Product / Service
Astrra Chemicals - Key offerings
SWOT

15.5 Blue Mountain Minerals

Blue Mountain Minerals - Overview
Blue Mountain Minerals - Product / Service
Blue Mountain Minerals - Key offerings
SWOT

15.6 Graymont Ltd.

Graymont Ltd. - Overview
Graymont Ltd. - Product / Service
Graymont Ltd. - Key offerings
SWOT

15.7 Greer Lime Co.

Greer Lime Co. - Overview
Greer Lime Co. - Product / Service
Greer Lime Co. - Key offerings
SWOT

15.8 Gulshan Polyols Ltd.

Gulshan Polyols Ltd. - Overview
Gulshan Polyols Ltd. - Business segments
Gulshan Polyols Ltd. - Key offerings
Gulshan Polyols Ltd. - Segment focus
SWOT

15.9 Imerys S.A.

Imerys S.A. - Overview
Imerys S.A. - Business segments
Imerys S.A. - Key offerings
Imerys S.A. - Segment focus
SWOT

15.10 Lhoist SA

Lhoist SA - Overview
Lhoist SA - Product / Service
Lhoist SA - Key offerings
SWOT

15.11 Linwood Mining and Minerals Corp.

Linwood Mining and Minerals Corp. - Overview
Linwood Mining and Minerals Corp. - Product / Service
Linwood Mining and Minerals Corp. - Key offerings
SWOT

15.12 Martin Marietta Materials Inc.

Martin Marietta Materials Inc. - Overview
Martin Marietta Materials Inc. - Business segments
Martin Marietta Materials Inc. - Key offerings
Martin Marietta Materials Inc. - Segment focus
SWOT

15.13 Mississippi Lime Co.

Mississippi Lime Co. - Overview
Mississippi Lime Co. - Product / Service
Mississippi Lime Co. - Key offerings
SWOT

15.14 Pete Lien and Sons Inc.

Pete Lien and Sons Inc. - Overview
Pete Lien and Sons Inc. - Product / Service
Pete Lien and Sons Inc. - Key offerings
SWOT

15.15 SCR Sibelco NV

SCR Sibelco NV - Overview
SCR Sibelco NV - Product / Service
SCR Sibelco NV - Key news
SCR Sibelco NV - Key offerings
SWOT

15.16 Sigma Minerals Ltd.

Sigma Minerals Ltd. - Overview
Sigma Minerals Ltd. - Product / Service
Sigma Minerals Ltd. - Key offerings
SWOT

15.17 SigmaRoc

SigmaRoc - Overview
SigmaRoc - Product / Service
SigmaRoc - Key offerings
SWOT

15.18 United States Lime and Minerals Inc.

United States Lime and Minerals Inc. - Overview
United States Lime and Minerals Inc. - Product / Service
United States Lime and Minerals Inc. - Key offerings
SWOT

16. Appendix

16.1 Scope of the report

Market definition
Objectives
Notes and caveats

16.2 Inclusions and exclusions checklist

Inclusions checklist
Exclusions checklist

16.3 Currency conversion rates for US$

16.4 Research methodology

16.5 Data procurement

Information sources

16.6 Data validation

16.7 Validation techniques employed for market sizing

16.8 Data synthesis

16.9 360 degree market analysis

16.10 List of abbreviations

Research Methodology

Technavio presents a detailed picture of the market by way of study, synthesis, and summation of data from multiple sources. The analysts have presented the various facets of the market with a particular focus on identifying the key industry influencers. The data thus presented is comprehensive, reliable, and the result of extensive research, both primary and secondary.

INFORMATION SOURCES

Primary sources

  • Manufacturers and suppliers
  • Channel partners
  • Industry experts
  • Strategic decision makers

Secondary sources

  • Industry journals and periodicals
  • Government data
  • Financial reports of key industry players
  • Historical data
  • Press releases

DATA ANALYSIS

Data Synthesis

  • Collation of data
  • Estimation of key figures
  • Analysis of derived insights

Data Validation

  • Triangulation with data models
  • Reference against proprietary databases
  • Corroboration with industry experts

REPORT WRITING

Qualitative

  • Market drivers
  • Market challenges
  • Market trends
  • Five forces analysis

Quantitative

  • Market size and forecast
  • Market segmentation
  • Geographical insights
  • Competitive landscape

Interested in this report?

Get your sample now to see our research methodology and insights!

Download Now

Frequently Asked Questions

Limestone Powder market growth will increase by USD 4843.4 million during 2026-2030 .

The Limestone Powder market is expected to grow at a CAGR of 8% during 2026-2030 .

Limestone Powder market is segmented by Type (Heavy calcium carbonate powder, Light calcium carbonate powder) Application (Building materials, Rubber, Wire insulation) Method (Dry grinding, Wet grinding)

Astrra Chemicals, Blue Mountain Minerals, Graymont Ltd., Greer Lime Co., Gulshan Polyols Ltd., Imerys S.A., Lhoist SA, Linwood Mining and Minerals Corp., Martin Marietta Materials Inc., Mississippi Lime Co., Nippon Steel Corp., Northern Minerals Ltd., Pete Lien and Sons Inc., SCR Sibelco NV, Sigma Minerals Ltd., SigmaRoc, United States Lime and Minerals Inc. are a few of the key vendors in the Limestone Powder market.

North America will register the highest growth rate of 49.2% among the other regions. Therefore, the Limestone Powder market in North America is expected to garner significant business opportunities for the vendors during the forecast period.

US, Canada, Mexico, Germany, UK, France, Italy, Spain, The Netherlands, China, Japan, India, South Korea, Australia, Indonesia, Saudi Arabia, South Africa, UAE, Egypt, Turkey, Brazil, Argentina, Colombia

  • Asia Pacific infrastructure boom is the driving factor this market.

The Limestone Powder market vendors should focus on grabbing business opportunities from the Type segment as it accounted for the largest market share in the base year.